Here's a statement of the obvious: The opinions expressed here are those of the participants, not those of the Mutual Fund Observer. We cannot vouch for the accuracy or appropriateness of any of it, though we do encourage civility and good humor.
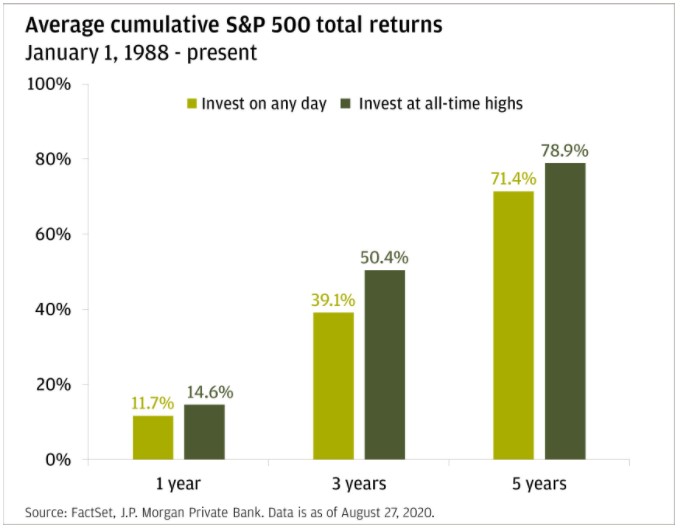
Waiting to "buy the dips" (the strategy to wait for a 10% peak-to-trough loss before buying, then holding for at least 12 months or until the drawdown threshold is exceeded before returning to cash) doesn't work verses Just "Buy and Hold":
This is why Warren Buffet recommends S&P 500 index fund for many investors. The compounding return year after year helps to build wealth.
My kid's 529 college funds invested in Total Market Index, Total Int'l Market Index, Total bond index and Total int'l bond index fund. Eighteen years later the 529 plan accumulated enough to pay for their 4-years college tuition plus room and board. The cost basis is about 40% of the total sum after 18 years of compounding. Through monthly investment the college grew and grew. We also added our year-end bonus to the 529 fund. Asset allocation were adjusted to pay the college bills.
This is even true for the peak starting 9/2k --- it took ~6y, though, following the ensuing dip --- and for the peak starting 11/07 --- and that one took, following the ensuing dip, just under ~5y. To break even.
Sobering, but if one stays optimistic ....
Worse, as everyone knows, if you 'ignore' (somehow) the second peak (and had gone all in Labor Day 2k), it was not until xmas 2010, over a decade later, that you were breakeven on paper --- and that while suffering ~27% inflation.
Such a scenario certainly seems more likely now going forward than anything else, with the market 'foaming at the mouth':
It's funny how most studies on market performance ignore the Great Depression as if it never happened, yet the first article does reference it: The author does mention that this price performance ignores dividends so the recovery rate would've been sooner than 25 years with that, but I wonder how many people during the Great Depression would have had the stomach or the financial wherewithal with 25% unemployment to hold on and reinvest their dividends as the market went into free-fall.
@LB, My trough period intervals were taken from M* $10k growth (= reinvestments) of FXAIX.
Something seems off with your chart, as $10k in Jan of 1973 into SP500 reinvested was back to $10k by early December '76, meaning breakeven a little less than 4y later.
The US market was sideways the next two years after that, though, yes --- until the nonstop bull started mid-'78 and rolled and rolled till the late summer of 2k. So I dunno where their 7.5 comes from.
1929 will never repeat for a whole host of reasons behind now being way different.
« 1929 will never repeat... » When my parents died and their house needed selling, my sibs and I found a pile of stock certificates representing shares in companies that had ceased to exist as result of the Great Crash. It was both fascinating and sobering. The companies I’ve invested in that went belly up don’t leave certificates behind, they just disappear into the ether.
M* always includes "S&P 500 TR USD", which is often (not always) slightly unmatched by the performance of actual SP500 mfunds. That aside, the $10k value of S&P 500 TR USD as of 1/11/73 returned to $10k (with reinvestment), indeed had broken even and then gone above, by 7/2/76. Which is earlier than I wrote.
This abovewater state continued for a while.
I don't know what a fair fund example would be for SP500 for that period. FFIDX, fwiw, was itself back to breakeven by the middle of June of the Centennial, ~3.5y later.
I know Hussman carries little weight but he has done studies that show much the opposite. Of course, it’s not clear what “market internals” are & also we are reminded that *In theory there is no difference between theory and practice but in practice there is often a significant difference*.
I think he just figured it out. It’s back testing. In (limited) defense of Hussman, don’t they say that Vale Line picks great stocks but their mutual funds always sucked? Same for Martin Zweig, great insights, his CEFs, not so much.
I agree 1929 will not come again. True of all history. But as long as the potential for nukes, climate change, ideological fanatics, the computer hack to end all hacks like "Mr. Robot," nationalist/fascist resurgence, war with China, a far worse pandemic, etc. exist, who's to say really what could or couldn't happen in the stock market? The modern stock market's history is so short relative to human history and virtually non-existent relative to evolutionary history, yet people make assertions about its future performance like it is as certain as the law of gravity. I know there are no guarantees in life, but it often seems strange to me that so many people's futures depend on something as random as securities markets. It's this kind of disconnected thinking that makes me laugh when I hear people demanding we privatize Social Security and put the whole ball of wax in stocks. The desire seems to me to rip up all the safety nets and let everything become a winner-take-all game of chance. Nor do I assume most on this board think this way--most I assume know that just because investing at peaks has worked recently doesn't mean it will continue to--but I know there are plenty out there who do think religiously about stock market appreciation. They take it as a given.
I meant in the shorter terms of current times. There is too much persistence to the greed, you might almost say resilience, plus the utter triumph of rigged monopoly capitalism.
If you need to spend your money within the next 3-5 years... keep it in cash (or ST Treasury Bonds).
@davidmoran, If you can avoid the powerful persuasions of fear and greed over the middle term (3 -10 years) by following rules...we all need personal investment rules...then equities over the long term looks promising.
The 10 year rolling average of an index such as the S&P 500 is pretty impressive.
There are two major takeaways from the chart below:
1. Historically, once the long-term mean has been breached on the up-side, annualized returns have remained elevated above the mean for an average of almost 18 years. 2. Historically, once the long-term mean has been breached on the down-side, annualized returns have remained subdued below the mean for an average of almost 10 years. This is significantly lower relative to the time-frame on above mean returns.
This year 5 stocks in the S&P 500 accounted for a 35% gain. The other 495 stock together accounted for a collective 5% loss. That's changing...see article linked below:
I use it (not nearly enough!) because it very slightly outperforms SP500 over 10-5-3-1y etc. (Same w/ CAPE, again not nearly enough, so faithless was I this last year.)
I was looking at the same thing david. I'm guessing that it must have something to do with the mid-cap inclusion in the Russell. I've never invested in either index but according to Fidelity I might have been better off doing so. However, and it's a big however, Fidelity's performance figure seems to only relate to the price performance of my holdings and ignores my distribution returns on those distributions not reinvested. I'm still calculating that business. Also, the figures they use seem to ignore my CEF holdings but I'm not totally sure about that. We'll see.
VTCLX is an actively managed fund that tracks the Russell 1000 Index while minimizing tax effects. The fund has performed well and may be worthy of consideration.
VTCLX is an actively managed fund that tracks the Russell 1000 Index while minimizing tax effects. The fund has performed well and may be worthy of consideration.
Fascinating to track how it remains the barest hair ahead of VONE over all large intervals from 10y on in --- so consistent. How dey do dat?
Fascinating to track how it remains the barest hair ahead of VONE over all large intervals from 10y on in --- so consistent. How dey do dat?
From M* Fund Report by Venkata Sai Uppaluri:
"The fund samples the Russell 1000 Index to minimize taxable dividends while approximating the composition of the Russell 1000 Index. To do this, the fund invests in stocks that pay lower dividends within the index, harvests tax losses when available to offset capital gains, and minimizes turnover that can unlock capital gain taxes. The portfolio managers are constrained by strict tracking-error limits to the Russell index. Consequently, the fund closely approximates that benchmark, with a low active share of 14%."
@davidrmoran - not that it matters but Fidelity states this about account historical rate of return:
"The returns shown on the Historical Returns card are Investment Rate of Return values. Your Investment Rate of Return uses a time-weighted formula that measures the performance of underlying investments and takes into account fees, but does not take into account the size and timing of any deposits or withdrawals to your account during the defined time period. The Investment Rate of Return is subject to change and should not be used solely in making investment decisions. Fidelity will not provide notification that past data may have been inaccurate, or that it has been corrected. Rates of return include changes in share price and reinvestment of dividends and capital gains, if applicable." (emphasis mine)


Comments
Linked Article:
reasons-why-you-shouldnt-wait-for-the-stock-market-to-crash
My kid's 529 college funds invested in Total Market Index, Total Int'l Market Index, Total bond index and Total int'l bond index fund. Eighteen years later the 529 plan accumulated enough to pay for their 4-years college tuition plus room and board. The cost basis is about 40% of the total sum after 18 years of compounding. Through monthly investment the college grew and grew. We also added our year-end bonus to the 529 fund. Asset allocation were adjusted to pay the college bills.
This is even true for the peak starting 9/2k --- it took ~6y, though, following the ensuing dip --- and for the peak starting 11/07 --- and that one took, following the ensuing dip, just under ~5y. To break even.
Sobering, but if one stays optimistic ....
Worse, as everyone knows, if you 'ignore' (somehow) the second peak (and had gone all in Labor Day 2k), it was not until xmas 2010, over a decade later, that you were breakeven on paper --- and that while suffering ~27% inflation.
Such a scenario certainly seems more likely now going forward than anything else, with the market 'foaming at the mouth':
https://www.nytimes.com/2020/12/26/business/investors-bull-market-pandemic.html
The author does mention that this price performance ignores dividends so the recovery rate would've been sooner than 25 years with that, but I wonder how many people during the Great Depression would have had the stomach or the financial wherewithal with 25% unemployment to hold on and reinvest their dividends as the market went into free-fall.
My trough period intervals were taken from M* $10k growth (= reinvestments) of FXAIX.
Something seems off with your chart, as $10k in Jan of 1973 into SP500 reinvested was back to $10k by early December '76, meaning breakeven a little less than 4y later.
The US market was sideways the next two years after that, though, yes --- until the nonstop bull started mid-'78 and rolled and rolled till the late summer of 2k.
So I dunno where their 7.5 comes from.
1929 will never repeat for a whole host of reasons behind now being way different.
"Something seems off with your chart, as $10k in Jan of 1973 into SP500 reinvested was back to $10k by early December '76"
According to Wikipedia (IMHO not the best data source but quick and dirty), the S&P 500 closed at 120.24 on 1/11/73, and closed at 121.44 on 7/17/80; that was also the first day that it rose back to (and through) 120.24.
https://en.wikipedia.org/wiki/Closing_milestones_of_the_S&P_500#The_1970s_Bear_Market_(1967–1973)
This is consistent with data from TheStreet.com, which shows that the 1973 high for the S&P 500 was 120.24 and that no subsequent year achieved a value at least that high until 1980.
https://www.thestreet.com/investing/annual-sp-500-returns-in-history
When my parents died and their house needed selling, my sibs and I found a pile of stock certificates representing shares in companies that had ceased to exist as result of the Great Crash. It was both fascinating and sobering. The companies I’ve invested in that went belly up don’t leave certificates behind, they just disappear into the ether.
I picked a longlived mfund, FFIDX, and as usual went to:
http://quotes.morningstar.com/chart/fund/chart.action?t=ffidx
M* always includes "S&P 500 TR USD", which is often (not always) slightly unmatched by the performance of actual SP500 mfunds. That aside, the $10k value of S&P 500 TR USD as of 1/11/73 returned to $10k (with reinvestment), indeed had broken even and then gone above, by 7/2/76. Which is earlier than I wrote.
This abovewater state continued for a while.
I don't know what a fair fund example would be for SP500 for that period. FFIDX, fwiw, was itself back to breakeven by the middle of June of the Centennial, ~3.5y later.
If only he also offered a fund 50-50 VONE and BND.
stock-market-by-president
If you need to spend your money within the next 3-5 years... keep it in cash (or ST Treasury Bonds).
@davidmoran, If you can avoid the powerful persuasions of fear and greed over the middle term (3 -10 years) by following rules...we all need personal investment rules...then equities over the long term looks promising.
The 10 year rolling average of an index such as the S&P 500 is pretty impressive.
In Percentage Change (last update 2016):
Source:
https://bespokepremium.com/think-big-blog/rolling-1-2-3-5-10-and-20-year-sp-500-performance/
In Percentage Returns (10 year rolling average):
https://credentwealth.com/blog/10-year-annualized-rolling-returns
the-biggest-market-comeback-of-the-year
@bee, are you looking more at VONE and/or VONV?
I own very few ETFs...if I were to own either I would select VONE which I assume is more of a blend of value and growth.
Also, have some chosen to use that index instead of the S&P 500 index?
All of my statements about performance entail reinvestment.
The fund has performed well and may be worthy of consideration.
https://www.washingtonpost.com/business/2020/12/31/stock-market-record-2020/
From M* Fund Report by Venkata Sai Uppaluri:
"The fund samples the Russell 1000 Index to
minimize taxable dividends while approximating the
composition of the Russell 1000 Index. To do this, the
fund invests in stocks that pay lower dividends within
the index, harvests tax losses when available to offset
capital gains, and minimizes turnover that can unlock
capital gain taxes. The portfolio managers are
constrained by strict tracking-error limits to the Russell
index. Consequently, the fund closely approximates that
benchmark, with a low active share of 14%."
a veteran M* analyst knows he shd use unlock somewhere but can't decide or recall exactly where, much less what it connotes
just wild
also turning 'low active share' into virtue
well, the fund's strategy does work, by a hair
"The returns shown on the Historical Returns card are Investment Rate of Return values. Your Investment Rate of Return uses a time-weighted formula that measures the performance of underlying investments and takes into account fees, but does not take into account the size and timing of any deposits or withdrawals to your account during the defined time period. The Investment Rate of Return is subject to change and should not be used solely in making investment decisions. Fidelity will not provide notification that past data may have been inaccurate, or that it has been corrected. Rates of return include changes in share price and reinvestment of dividends and capital gains, if applicable." (emphasis mine)