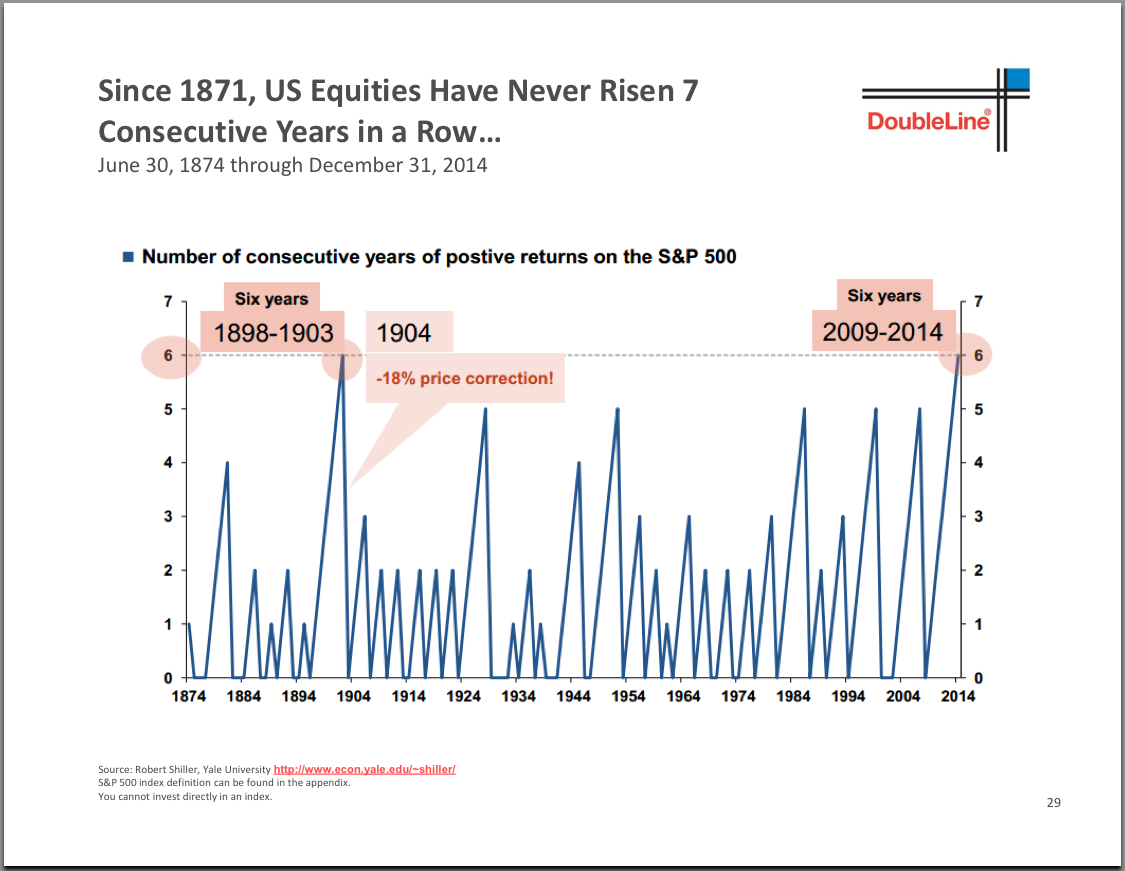
Howdy, Stranger!

It looks like you're new here. If you want to get involved, click one of these buttons!

Here's a statement of the obvious: The opinions expressed here are those of the participants, not those of the Mutual Fund Observer. We cannot vouch for the accuracy or appropriateness of any of it, though we do encourage civility and good humor.
  • Difference between TTM Yield and 30 day SEC Yield
    @Soupkitchen
    Mark's link, yes.
    Basically, the "TTM" is the previous 12 month period average of what the stock or fund was paying. For the two funds you noted, both the dividends from equities held and yields from bonds held in the fund were higher during the prior 12 month period. As the price of either or both the equity and bond holdings increased, the dividend/yield moved lower. Which was generally the case for both in 2014. This TTM will vary depending upon what is held within any given fund based upon the mix.
    The 30 day yield is related (as noted in Mark's link) to the most recent short time period, usually based at the end of the prior month (in this case, Dec. of 2014).
    The funds you noted show yields decreasing; being from price appreciation during the previous 12 month period.
    The same applies to high yield/junk bonds; but in reverse to what you find with the funds you mentioned.
    SPHIX is an example: 12 months ago, more folks were still buying junk bonds, moving prices up and yields down. Today is the reverse, with folks selling junk bonds causing pricing to move down and yields to much higher.
    TTM for the above fund is 5.44% (average). The 30 day SEC yield is 6.08%.
    'Course, related to investment grade bonds in particular; is some of the supposedly sharp folks who talk on the tv and write articles; is that how can one expect to make any money with IG bonds with such crappy, low yields. Seldom do they note what happened to the bond pricing as yields continued downward. The answer, of course; is that investors made money on the price appreciation, not really caring about the yield, as long as it (the yield) was still going down.
    Hope this helds somewhat.
    Regards,
    Catch
  • Difference between TTM Yield and 30 day SEC Yield
    I've been looking at a fund that has a 4.67% TTM yield, at the same time having a 2.99% 30 day SEC yield. What would the difference be between the two yields (not mathematically :), and why are the numbers so different? Oh, the fund is CAIBX by the way. Looking at another income fund, VWINX, I see that the two yields are almost the same. 3.10% TTM and 2.53% 30 day. What gives?
  • 10 Things Investors Won't Tell You
    @catch. Yep.
    Here's some Bio on the author Priya Anand from Likiden. Nothing in her background relating to financial training or experience. https://www.linkedin.com/in/prianand
    Here's The Newsroom Roster from MarketWatch. Most seem to have only Liberal Arts and Journalism backgrounds.http://www.marketwatch.com/newsroom/roster
    To be fair, perhaps 25% (being generous) have degrees in Finance, Economics or some other type of financial experience. (Some intriguing descriptions: "mutual funds analyst" and "broker-trader")
  • 10 Things Investors Won't Tell You
    Even healthy people over the age of 65 show “profound declines in cognitive function” that affect their financial decision-making ...
    Maybe all posts here should have poster's age prominently displayed? (Like those EPA window stickers?)
    -
    (I think it would be fun writing for Marketwatch. Begin with a shred of evidence ... than let your imagination run. Very compelling writing - if greatly exaggerated and distorted.)
  • MFO Ratings Through 4th Quarter
    Hi David.
    I love you man.
    I agree.
    15 years is about the most we can hope for with single manager.
    But I do not know for sure...our database does not account for category drift...or, manager drift, sad to say...past performance, numbers only.
    Here are some of the 10 year funds with top-quintile risk-adjusted performance across the past 10, 5, 3, and even 1 year evaluation periods through Dec 2014. (I left off most of the sector funds and munis.)
    Access Capital Community Investment I (ACCSX)
    American Century Mid Cap Value Inv (ACMVX)
    AMG Chicago Equity Partners Bal Instl (MBEYX)
    Artisan International Value Investor (ARTKX)
    Buffalo Discovery (BUFTX)
    First Trust Value Line Dividend ETF (FVD)
    GE Instl Premier Growth Equity Inv (GEIPX)
    Guinness Atkinson Global Innovators (IWIRX)
    Hennessy Equity and Income Institutional (HEIIX)
    Homestead Small Company Stock (HSCSX)
    iShares Morningstar Large-Cap (JKD)
    iShares S&P 500 Growth (IVW)
    JPMorgan Mid Cap Value Instl (FLMVX)
    Metropolitan West Total Return Bond M (MWTRX)
    PIMCO Intl StksPLUS AR Strat (USD-Hg) A (PIPAX)
    PIMCO StocksPLUS Absolute Return Instl (PSPTX)
    Pinnacle Value (PVFIX)
    Principal MidCap R2 (PMBNX)
    RidgeWorth Conservative Allc Strat I (SCCTX)
    SEI Moderate Strategy Allc A (SAAT) (SXMAX)
    SEI US Managed Volatility A (SIMT) (SVOAX)
    Shelton Nasdaq-100 Index Direct (NASDX)
    T. Rowe Price Diversified Sm Cap Growth (PRDSX)
    T. Rowe Price Global Technology (PRGTX)
    T. Rowe Price Instl Mid-Cap Equity Gr (PMEGX)
    T. Rowe Price Instl Small-Cap Stock (TRSSX)
    Vanguard Target Retirement 2015 Inv (VTXVX)
    Vanguard Target Retirement 2045 Inv (VTIVX)
  • DLTNX versus DLFNX.
    Hi @JohnChisum
    Chart for DLFNX set for 50, 100 & 200 days, over a 3 year period, RSI (relative strength) at 14.
    Chart for DLFNX set for 10 & 39 days, over 1 year period, RSI at 14, smooth moving average.
    There are numerous other setting one may fiddle with below the chart in 3 different areas. Also, just to the right of the ticker symbol; these charts are set for weekly price movements. This may be changed to daily. An "inspect" box may be checked to allow some other functions with the cursor over the graph.
    I have only studied a few of the features available at this site. Wish I had more time in the day.
    Take care,
    Catch
  • Switzerland etf EWL
    Take a look at the components, and it's not hard to realize that it is not "up" at all for 2015.
  • Switzerland etf EWL
    I was just looking on Morningstar at the performance for EWL. The fine print says that the performance is as of 1/16/15, but it clearly is not. The year to date number for example cannot be even close to correct. If they are old numbers, why don't they just say so? They shouldn't say they are up to date if they are nowhere close.
  • DLTNX versus DLFNX.
    @JohnChisum @Crash et al
    Linked chart for DLFNX vs DLTNX
    Linked chart for for DLFNX vs DLTNX vs PONDX
    In both cases with these charts, this is an active site link. Being that you may add and/or remove the tickers for your own comparative use. Save the site/chart link for future use for any compares. ALSO NOTE, that these charts do include "total returns" inclusive of dividends, cap. gains, etc.
    ALSO, left click at the left edge of the 200 day slider (default setting) and drag the slider to the left for about a 1150 business day view. NOTE the "temper tantrum" period that came into place in May of 2013 when the Fed stated that they were going to remove some of the easy money. One may also view any 200 day period (not available for very new funds, stocks) with holding a left click onto the 200 day slider and dragging the slider to the left for earlier periods. The slider can be reduced to about 2 days and to much earlier start dates, depending upon the age of what is being viewed.
    We looked at DoubleLine when they were first born, but maintained our PONDX holding, which later evolved into a PIMIX holding.
    Active management is going to cause any of these "multi-sector" funds to travel different paths, yes?
    An alternative for the "build your own" would be to hold equal amounts of about 5 or 6 etfs in bond areas of your choice.
    Take care,
    Catch
  • For Healthcare Investors, A Medical Breakthrough ETF.
    I ran across this earlier today. A new wearable pain relief device called Quell. The company making the device is NeuroMetrix. This wearable goes on your upper calf and works for chronic pain like low back, diabetic nerve pain, and knee pain.
    Ticker is NURO. This does seem like a promising device and it is already FDA approved.
    http://www.medicaldevice-network.com/news/newsneurometrix-pain-relief-quell-4445711
  • DLTNX versus DLFNX.
    Here is the sector break down as of 11/2014 according to Double line
    DLFNX
    Cash 9.1%
    Government 17.7%
    Mortgage-Backed Securities 29.6%
    Emerging Markets 13.4%
    Investment Grade Corporate 10.2%
    Commercial Mortgage-Backed Securities 6.6%
    Bank Loans 5.0%
    High Yield Corporate 4.5%
    Collateralized Loan Obligations 3.9%
    Total 100.0%
    DLTNX
    Cash 12.1%
    Treasury 5.1%
    Agency Passthroughs 24.1%
    Agency CMO 21.3%
    Non Agency Residential MBS 25.5%
    Commercial MBS 6.4%
    Collateralized Loan Obligations 4.8%
    Other 0.6%
    Total 100.0%
  • Junkster give my $500 to charity
    Do you have an exit point or strategy? Would you let a profitable trade turn into a losing one or willing to give back the majority of your profits?
    Junkster,
    My thought is that this situation will last for at least 1 year and maybe as long as 4. It will take some time for people to recognize/admit the deflationary pressure.
    HYD's all time high is 33.57, now 31.34. I will be watching that high and as/if we get close to it I would consider changing the dividends from re-investing to cash. Then watch to sell. Other things I would be watching is the yield on the 10 year and the US$. I really think with the relative high 10 year rate and the strong $ the USA will be importing deflation. The FED would make the situation worse by raising rates.
    I'm watching the $ because it high yield foreign bonds might be a good buy on $ strength.
    Many of those analysist have pushed their est for a FED increase to the 3rd quarter.
  • Gundlach 2015 Market Outlook Webcast
    Hi @Charles
    You noted: "All that said, he's selling bonds.
    Which means that either naturally or with intent, he's always building a wall of worry."
    >>>Yes, he is a bond fella. Do you feel his "pitch" is for this only; and that his statements and/or views reflect a wall of worry? Or is he only expressing what he feels he has discovered "at the moment, subject to change"?
    My most simple view of available investments today remains with the fact that the overwhelming exposure via any form of media remains equity-centric. Flag wavers of every notion regarding the direction of equity investments in one sector and/or country are on the opposite side of the fence every business day of the week; and they are in full expression on tv, printed articles and internet sites, of course. Some of these folks also express what could be called a "wall of worry"; although they are equity folks, by nature.
    Equity folks may often note that bond folks are "worried" about something.
    The equity stock folks may protect against "the wall" using equity shorts or put options. This could be their method.
    A bond person may use bonds in the same fashion (protection), if they perceive a problem in equity/general economic areas, which could also include another bond type, the junk bond.
    One could suspect those who choose to hold what they feel are decent equity style funds, even in shaky market periods; but who do not choose to use inverse funds for protection, may rely on investment grade bonds for a cushion; which could be a mix of gov't and corp. type.
    Mr. Gundlach and company sells bond funds for a fee, of course. As long as he does not charge an arm and leg more than a similar active managed bond fund; I don't find an effort at his being a shill for his own fund groups to offer enough monetary reward. He has enough money. I suggest, that he is proud of and aware of his skills in this area of investments and his overview of many other areas that affect investments.
    If I do not have to pay extra for his ego and/or lose money holding his funds; he may demostrate as he feels the need.
    We do not hold any DoubleLine products.
    'Course, in the end; the above may be a very good argument for holding 5 of the best long term balanced or equity-income funds and relax, eh?
    We remain U.S. centered with equity and bond holdings; with the exception of international exposure to companies held and their earnings generated, via a fund's holdings.
    Regards,
    Catch
  • Morningstar's Portfolio Manager Price Updating Concern ...
    ---- 312 posts on the MORNINGSTAR CONVERSATION FORUM --- 312 !!!!!!!
    INCLUDING 44 IN AN " OPEN LETTER TO M* CIO AND CEO " as follows =
    As discussed HERE, HERE, HERE and HERE, the recent crash of the Portfolio Manager is just another example of extremely poor System Testing and User-Acceptance Testing prior to deployment. M* does a lot of things right, but one thing they do VERY POORLY is follow a traditional structured IT lifecycle development and deployment process which would catch 95% of these issues before they affect their customers.
    I honestly have never seen another company push out such "buggy" or error-prone code into a live customer-facing environment, and I have worked with dozens of organizations both large and small throughout my consulting career. This has been at least a quarterly, if not monthly occurence for YEARS and shows no sign of changing.
    This is a leadership issue, not a technical issue, and has crossed from "mistake" to "problem."
    If your IT folks have the authority to make changes to the live production environment without a sign-off first from some sort of business or marketing person, that's a problem.
    A complete re-vamp of the pre-deployment QA / Testing process up to normal customer-facing marketplace standards should be underway, as measured by a sharp reduction in customer-impacting outages and post-deployment bug reports.
    Ultimately, you're going to lose this Premium customer along with many others if this continues without any hope of systemic changes at the IT leadership level.
    Please advise.
  • Gundlach 2015 Market Outlook Webcast
    Just so everyone knows. His very popular chart about never 7 years of positive returns is not correct.
    image
    8 years 1982-1989 and 9 years 1991-1999. Just trying to kill the myth .