
It looks like you're new here. If you want to get involved, click one of these buttons!
Getting FasterChinese scientists claim to have built a quantum computer that is able to perform certain computations nearly 100 trillion times faster than the world’s most advanced supercomputer, representing the first milestone in the country’s efforts to develop the technology.
Great work FD, I wish I could say the same for my portfolio...but happy I'm up a bit. Been about 47% cash all this year. On the other hand, you could have stayed in ANBEX (one of your choices) and been up over 17% YTD while you did nothing but sip wine and coffee!dtconroe.
I'm OK with VCFIX but the meltdown of over 18% was too much, even PIMIX was down less than that around 11%. I don't put a lot of faith in Schwab bond selections. I think Fidelity is better and free to all investors even if you are not a client, right now their selected Multi list(link) is as follows:PTIAX, HSNAX, BMSAX, DINAX, JHFIX (PONAX/PIMIX used to be on this list for years). Fidelity always promote their funds as selected but I disregard it until I verify their superiority and in most cases I can find better choices.
I think funds like TSIIX,PTIAX are more of a hold than VCFIX.
As usual, I don't trust any fund/managers, volatility can show up any time and I hope not to be there.
wxman, GIBLX is still doing well in its category at one month=2.2% and 3 months=1.4% This is still in the top 15% in its M* category. For most investors who are looking for a ballast, performance and longer term hold, it's a great fund.
For a much smaller group of investors like me, who rely more on bonds for higher performance and use momentum successfully, I hardly ever use Core and Core Plus funds. I would not recommend this for most investors.
Junkster, I stayed away from IOFIX for several months after the crash, I made most of my money after that with HY munis. I wanted to see more calm and was glad the Fed actions worked. I sure missed a lot of performance from the bottom but I also missed all the meltdown in March of 2020 (documented in this thread). Every Saturday I write down my portfolio performance for the last week and YTD. I can't complain too much when I'm up 18% in 2020, only one week loss at -0.3%, 5 weeks at zero and the rest are all up.
Not apparently the thousands--soon to be millions--already displaced as climate refugees from their homes or apparently the sea otter to you. And of course there's the sheer absurdity of your assuming that reducing fossil fuel dependence and carbon emissions only destroys jobs and won't create any simultaneously. Reducing the world's carbon footprint will be an immense task that will create more jobs certainly than it destroys in the already moribund coal industry. But as I said previously and I maintain, none of this really matters to you. You know the science is true and the impact will be severe but just don't care.As for the coal minor, sure, a comparatively small industry, but one that is directly affected by the new green movement. Every life matters, right?
We estimate that the more conservative $25 carbon tax would boost U.S. employment by 1.4 million jobs each year between 2020 and 2030, which is nearly a 1 percent increase above the reference–case forecast of 160 million jobs in 2030. As the economy expands and the tax increases, job growth from the GND [i.e., Green New Deal] would accelerate, creating, on average, 3.4 million new jobs each year between 2040 and 2050—a nearly 2 percent increase above the 182 million jobs forecast for the U.S. in 2050. Overall, it is estimated that 72 million job years would be created over the three decades with a $25 carbon tax. (Note that if one job continues after one year for another 12 months, it represents two job years.)
With the more aggressive $60 carbon tax, U.S. employment would still exceed the reference-case forecast, but the increase would be less than that of the $25 tax. The higher tax causes much larger supply-side job losses, but they are still smaller than the gains in energy-efficiency jobs motivated by higher energy prices. Overall, 35 million job years would be created between 2020 and 2050, with net job increases in almost all regions.
According to the latest data, in 2018 about 9.2 million Americans (5.7 percent of the U.S. workforce of roughly 162 million at the time) were employed in an energy industry. Nearly half of these jobs (about 4.3 million) made up the traditional supply-oriented categories: fuels, including petroleum, natural gas, coal and woody biomass (1.1 million); electric power generation (900,000); and transmission, distribution and storage (2.3 million). The motor-vehicle-related industries employed 2.5 million, and energy efficiency employed 2.4 million.
The GND would cause traditional supply-oriented jobs to decrease, but energy-efficiency jobs would more than compensate for the losses. New jobs from energy-efficiency investments would be significant, totaling 1.8 million in 2030 and 4.2 million in 2050. These estimates reflect the labor-intensity of jobs in construction, which account for more than half of the energy-efficiency workforce in 2018. Other large gains would be associated with heating, ventilation, air-conditioning and refrigeration systems—the largest share of energy-efficiency investments in the residential and commercial sectors. In industry, the greatest investments estimated would be in energy and environmental management and smart controls, followed by industrial-machinery manufacturing such as that of high-efficiency motors and variable-speed drives. The result would be job growth across all nine Census divisions of the U.S., in all three decades with a $25 carbon tax. The $60 tax would boost job growth in the U.S. overall and across a majority of its nine Census divisions and three decades.
We finally agree on something. Covid, and, more accurately stated, the overblown and ineffective response, is decimating not only the retail industry, but also travel, food and beverage, personal care, etc. As is my point on climate, the cure cannot be worse than the disease. That clearly has been the case with Covid. As for the coal minor, sure, a comparatively small industry, but one that is directly affected by the new green movement. Every life matters, right? That said, if I bought your premise that shutting down American energy independence is needed to save the planet, I can get on board with that. But it probably isn't and won't even if it is.How many people did the U.S. coal mining industry employ in 2019? 53,000. https://statista.com/statistics/215790/coal-mining-employment-in-the-us/
How many people are employed in the retail service sector: 9.8 million.
https://census.gov/library/stories/2020/09/profile-of-the-retail-workforce.html
Yet guys like wxman123 and our soon to be ex-president wax poetic about the poor coal miners while millions in retail are struggling to stay afloat because of Amazon and covid. You know what the difference is? This is who the retail sector employs--not the Fox News demographic--according to the Census bureau:But oh, the poor coal miners! The symbolism is perfect to stoke that tribalistic white nationalist animosity because 91% of coal miners are white males, and only 0.9% are black: https://bls.gov/cps/cpsaat18.htm They are being replaced by technology regardless whether we have a green new deal or not. Meanwhile, the retail workforce is being decimated by Covid: https://cnbc.com/2020/07/22/coronavirus-retail-workforce-faces-permanent-decline.htmlRetail workers are younger. Over half of all retail workers were ages 16 to 34.
Women were more likely to work in retail jobs. About 56.5% of retail workers were women, compared with 43.5% who were men.
Blacks and Hispanics were overrepresented in retail work. Blacks comprised 12.5% of the retail workforce compared to 11.4% of the total workforce; Hispanics were 18.7% and 17.5%, respectively.
>> What sacrifices do we need to make to save that half a degree?
You write as though you keep up, but it is clear you do not, not really. There is a lot of work out there, hardcore practical effective proposals, a lot of them by your mocked academics, covering what is entailed to effect such a huge course alteration as a half a degree.
You must have read, while worrying about working coalminers (of whom there are very very few), and about John Kerry's lifestyle indicating what, hypocrisy? seriously? Kerry?, about the temperature point (which is close, meaning not that far off) at which human life becomes nearly impossible.
>> How about moving north?
Oh, go for it.
Eventually, and not so far off either, those forests will burn every summer too.
Or ... get hep to renewables and feasible policy:
https://blogs.imf.org/2020/10/07/finding-the-right-policy-mix-to-safeguard-our-climate/
I am fascinated that someone literate and thoughtful-sounding falls back on the tiredest of Fox editorials:
\\\ ... causing substantial damage to the environment and people in other respects? This is the real and fair debate among knowledgeable people,
Yes, there absolutely is real discussion of trades. Moneys for retraining. Serious moneys. Disaster relief. Can you cite the debates you think are most informed or fairminded or interesting or promising?
\\\ and to deny it makes you the ignorant one.
You probably had best not go there, honestly, and not just with LB.
\\\ Some honest and good people do care about an entire industry and its workers being told to shut down. If your brother, son, daughter or best friend made their living as a coal minor or working an oil rig I think you would see this point.
Again, best not to personalize or go to anecdote.
There is no helping coalminers or rig workers no matter what anyone does or what policies are adopted. Everybody but you and the most extreme of rightwingers know that --- National Review, the industries themselves, any of the candidates except for the departing pantsloaded infant. 'See this point'? What point would that be? Have you followed (e.g.) coal trends and the data over the last decades ?
These are old and tired arguments, from the 1970s, as though you are 95yo and just waking up and never read the number-crunching.
\\\ I doubt you know any of those types.
oh, here we go. You probably also do not want to turn this into some blue-collar cred thing either, not if you want to present as thoughtful. It's not like a Clifford Odets play from 1934.
But oh, the poor coal miners! The symbolism is perfect to stoke that tribalistic white nationalist animosity because 91% of coal miners are white males, and only 0.9% are black: https://bls.gov/cps/cpsaat18.htm They are being replaced by technology regardless whether we have a green new deal or not. Meanwhile, the retail workforce is being decimated by Covid: https://cnbc.com/2020/07/22/coronavirus-retail-workforce-faces-permanent-decline.htmlRetail workers are younger. Over half of all retail workers were ages 16 to 34.
Women were more likely to work in retail jobs. About 56.5% of retail workers were women, compared with 43.5% who were men.
Blacks and Hispanics were overrepresented in retail work. Blacks comprised 12.5% of the retail workforce compared to 11.4% of the total workforce; Hispanics were 18.7% and 17.5%, respectively.
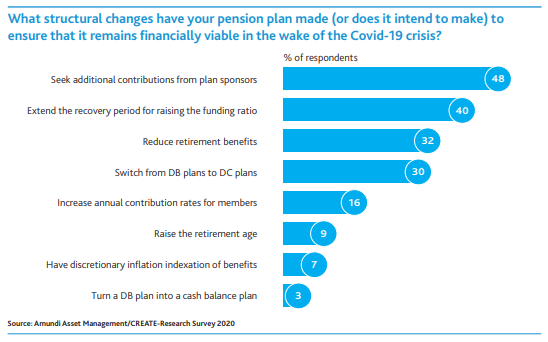
Every silver lining has a cloud. Stock markets’ recovery since March has been prodigious. Now the notion of a reflationary 2021 is turning into a new orthodoxy. But the combination of events in the last few months has been toxic for some of the crucial building blocks of the financial system that was already in trouble — pensions.
© 2015 Mutual Fund Observer. All rights reserved.
© 2015 Mutual Fund Observer. All rights reserved. Powered by Vanilla


