[also posted at Bogleheads.org, and maybe a few more to come, but I've gotten good value here at MFO and wanted to post it to give back.]
Here at the end of the 3rd quarter, the statement has become true, period, with no qualifier other than “as regards investment grade bond markets in the US and Britain.”
The statement can be evaluated over four time frames, in all cases treating the first nine months of 2022 as if these were 12 month returns. Tickers used to determine 2022 returns are in parentheses. All are nominal total returns and year-to-date as of 9/30/2022.
1. Since December 1972 (total bond, BND)
2. Since December 1925 (intermediate Treasuries, VGIT, and long Treasuries, VGLT)
3. From January 1793 to January 1926 (long investment grade bonds, mostly governments, BLV)
4. August 1753 to December 1918 (British Consols, EDV as the comparison)
Charts and brief discussion follow,. Red dashed line shows 2022 return, bars show historical returns over rolling twelve-month periods.
[b]Total Bond[/b]
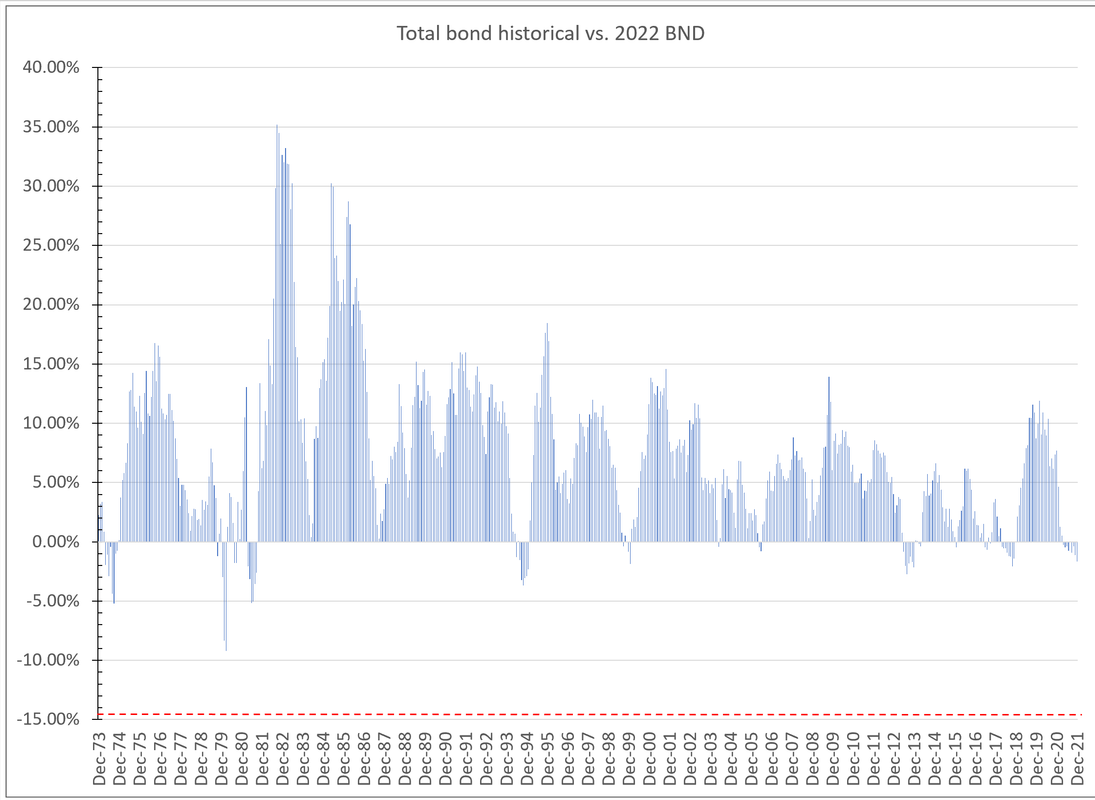
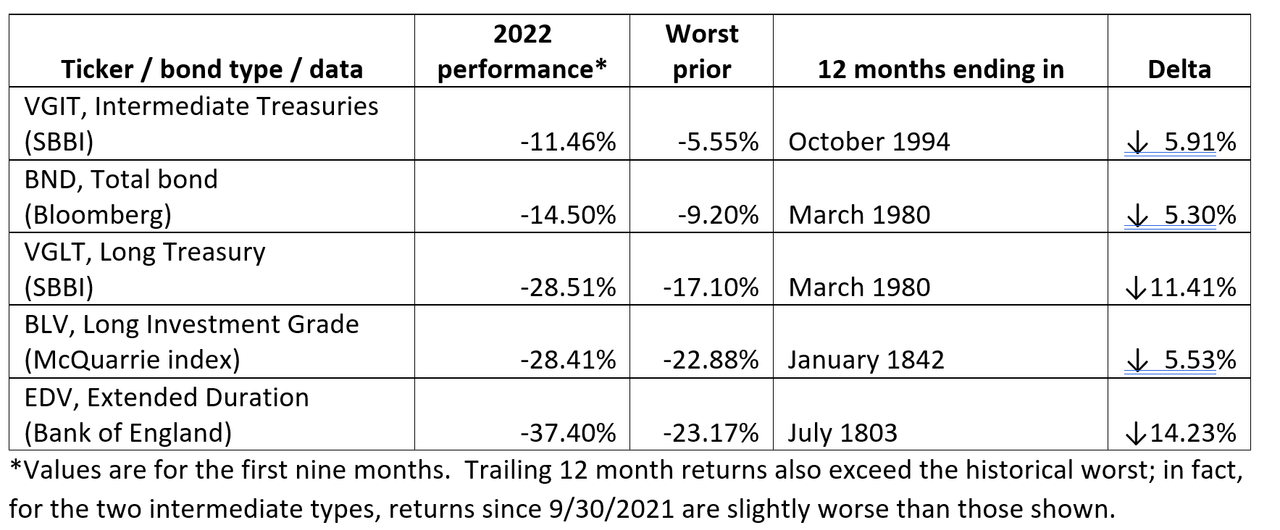
This one is a staple of 3-fund portfolios and Vanguard Target Date funds. It’s probably the most shocking outcome within the Boglehead universe. As of 9/30, BND was down 14.50%. The worst previous 12 month return on the Bloomberg-Barclays Aggregate was the 12-month roll through March 1980 at minus 9.20%.
I think it fair to say that few 3-funders had any conception that BND could decline by double-digits in the space of a year.
But then again, a fifty-year record is not a lot to support a claim like “ever.”
[b]Intermediate Treasuries[/b]
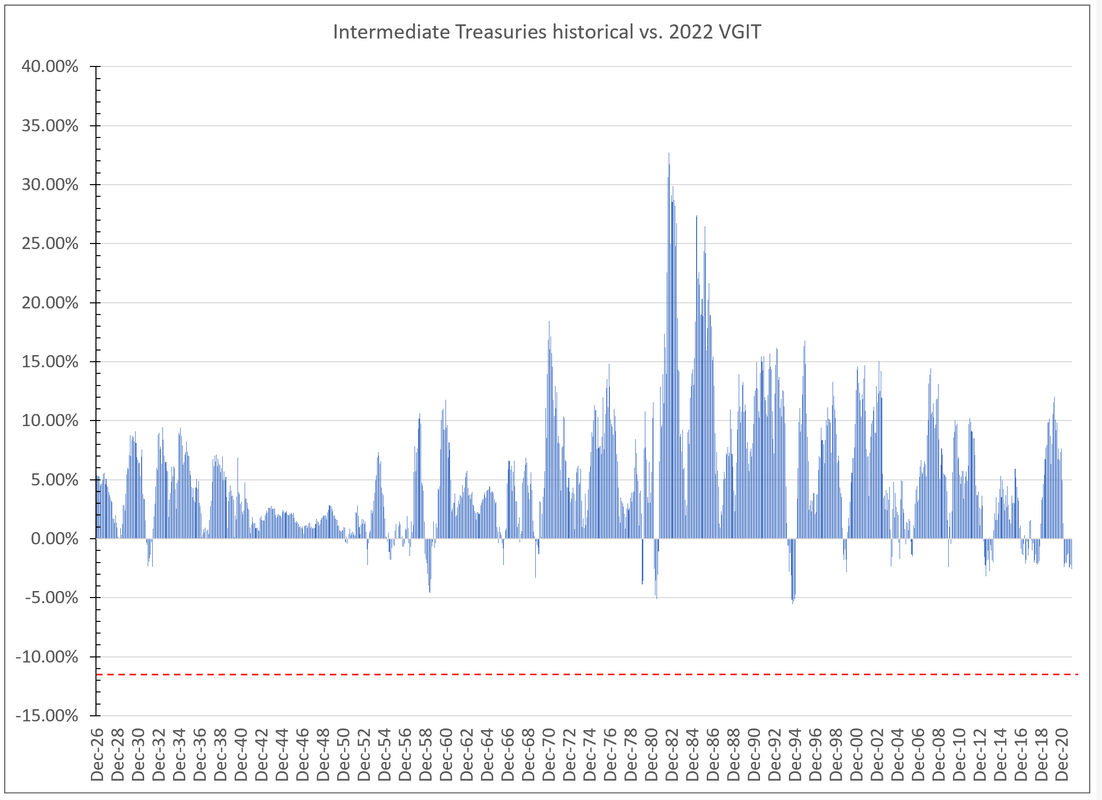
This is where investors go if they find BND holds too much risk for comfort, whether duration risk or credit risk. VCIT is down 11.46% in 2022. That’s head and shoulders below the worst previous 12-month return of minus 5.55% ending in October 1994. So much for “safe.”
And 96 years maybe does qualify for “ever.”
[b]Long Treasuries[/b]
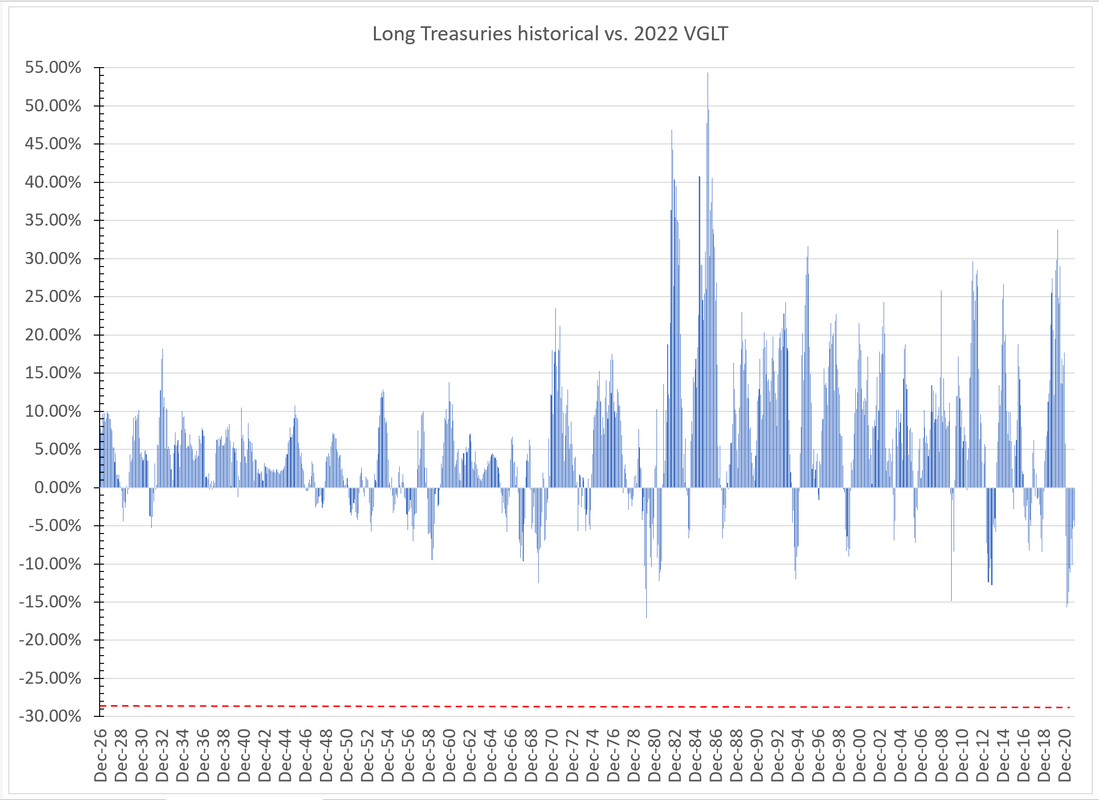
VGLT really took it on the chin in 2022, down 28.51% thus far. It’s a reminder of why long bonds have a bad reputation in the eyes of some. Maximum duration, maximum price decline in an adverse environment. Turns out, the bad times in the 1960s and 1970s don’t really hold a candle to 2022. The worst previous 12-month return on the SBBI long bond was minus 17.10% for the period ending March 1980. That’s in nominal terms, as are all these comparisons. I’ll look at real returns at the end of the year, since most of the older inflation data (pre-1913) are only available on an annual basis.
Again, 2022 produced the worst return on long Treasuries seen over any 12-month period in the past 96 years. By far.
[b]Long bonds[/b]
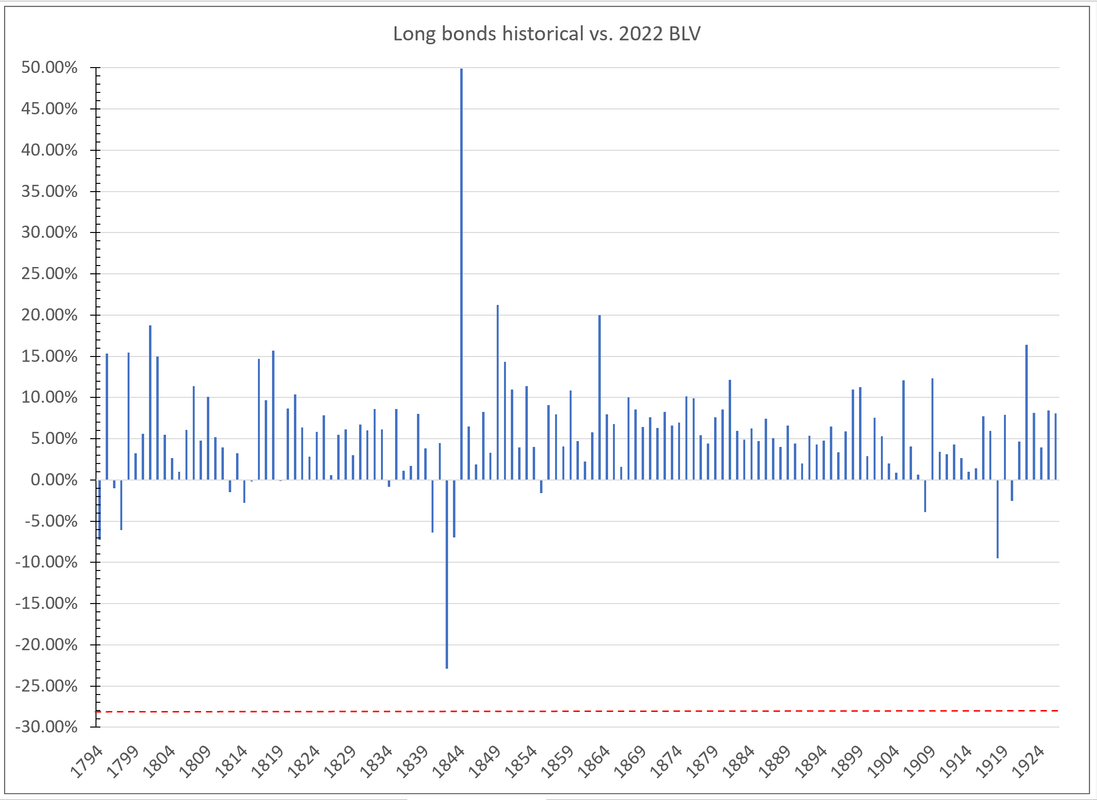
This is a spliced series:
1. My index of long corporates from 1925 back to 1897;
https://papers.ssrn.com/sol3/papers.cfm?abstract_id=38059272. My aggregate of corporate, municipal and Treasuries to 1842;
3. Municipals to 1835; Treasuries and municipals to 1825; Treasuries to 1793.
You have to go back over 150 years, to the 1840s, when states defaulted on their debts, to get a result that even comes close to the 2022 results for BLV (which pegs toward the midpoint of VGLT and VCLT). BLV saw a decline of 28.41% in 2022; the worst previous decline was the minus 22.88% decline for the period ending in January 1842. In April, 2022 was only a contender for worst ever in this bond category; it took bad returns in June and again in September to push 2022 returns below even those seen in 1842.
I’d say 228 years is a good approximation of “ever.”
[b]Really long bonds: British Consols[/b]
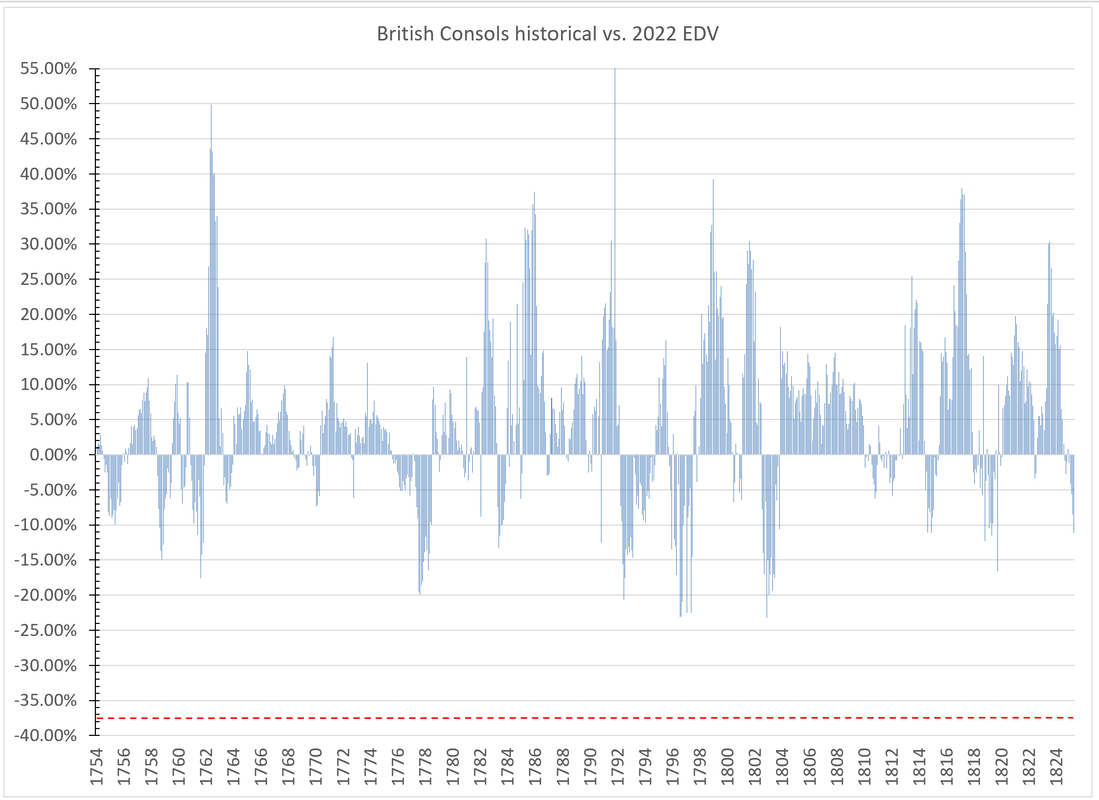
These were perpetuities, so the proper comparison would appear to be the Extended Duration Treasury fund. EDV got slaughtered in 2022, down 37.40%. That would be a mighty bear market even in stocks, much less safe government bonds.
Nothing in the British Consol record comes close, not even the worst months of the Napoleonic Wars. The chart shows 12-month rolls from 1753 to 1823. An earlier examination December on December annual returns had shown all the worst returns to fall within in this stretch. Later years, in the heyday of the British empire, were mostly fine. WW I returns, nominal, in particular did not plumb the depths of Napoleonic returns.
Consols down 20% plus? Happened more than once in the Napoleonic Wars (and before, in the American Revolution, and almost, in the Seven Years War). The worst case was minus 23.17% for the period ending July 1803. A Consol total return worse than minus 25%? Never happened. Return worse than 30%? Never approached, not even close.
2022 EDV returns stand alone at the bottom of a chasm.
And if 269 years isn’t a good proxy for “ever,” I don’t know what qualifies.
[b]Summary[/b]
Unprecedented, across the board.
[b]Why has 2022 been so bad?[/b]
One word: duration, my boy, duration!
Technically, modified duration, or the price sensitivity of a bond to a change in interest rates.
Duration is a function of maturity (as everyone knows) and of coupon/yield (which most people forgot or never knew).
1. Long bonds fall more when rates go up.
2. Low coupon bonds fall more when rates go up.
3. Low coupon, long bonds plunge when rates go up.
[b]What that means in practice[/b]
The last big bond bear market occurred at the dim horizon of memory for most investors active today, i.e., in the late 1970s. Rates on the 20-year Treasury rose from about 6% in 1972 to over 14% at one point in 1981.
The 2022 bear market (so far) has seen a much smaller rise in rates, a little more than 200 bp since the beginning of the year. Why then has 2022 clocked in as historically awful?
First, note the pacing: it took nine years for rates to rise 800 bp in that hazily remembered bear market, an average rise of less than 100 bp per year. 2022 saw more than twice that rise in just nine months.
And the real kicker: in that long ago bear market, rates were already higher at the start than almost any observer expects to see in the current cycle. High rate equals more coupon income to defray price drops, and a more favorable total return, since duration is also less at high coupons.
Back to 2022: an achingly low rate to start, less than 2.0%, and a rapid price drop, combine to produce a potent, toxic brew for bond total return.
Next, the last time long Treasury rates were as low as in 2020-2021 falls outside the lived memory of most investors. It was just under 2.0% in early 1946. And it took 12 years of drip-drip declines before that yield rose as high as the current 4.0%.
Now you have some sense of why 2022 has been so much worse for bonds than ever before.

Comments
Ostensibly, I could keep adding a bit each month to my junk bond fund TUHYX. (It's my only bond holding by now.) Doing that simple thing, pretty much forever--- until Fortune's wheel turns positive for bonds--- would continue to give me gradually higher monthly dividends. Current TTM yield as per Morningstar: 7.18%. and SEC yield = 10.29%. ... And I can get that without resorting to EM bonds. I can stay domestic. And TUHYX is not even very good. I choose it because it's in TRP, which I'm pretty much married to. Actually, I think the fund came under their umbrella after the acquisition of an outfit by the name of Oak Hill. Works for me.