This is not an example of technical analysis:
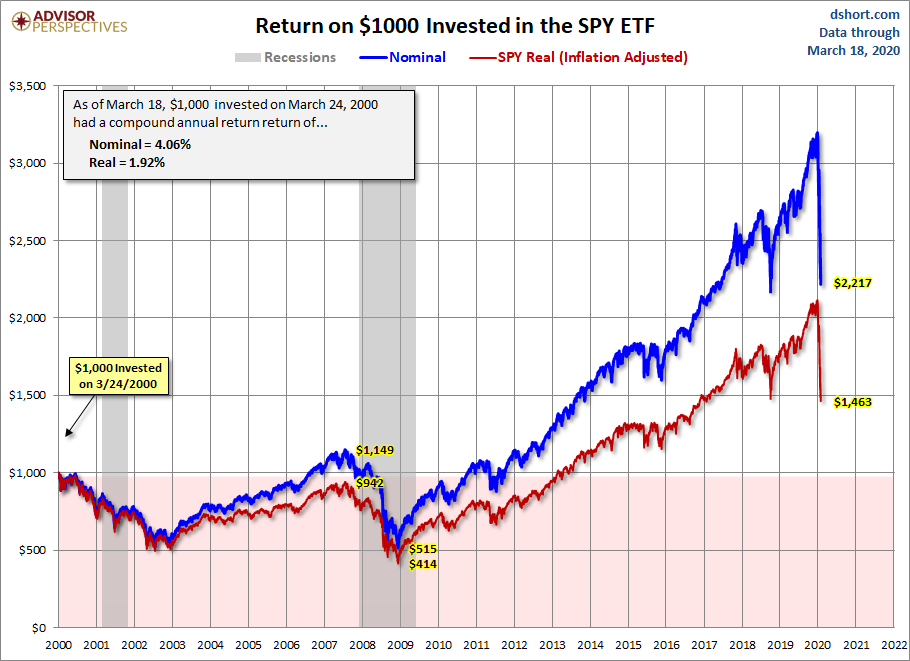 From DShort.com, AKA Advisor Perspectives -- as the graphic clearly states.
 .
I'm not sure this chart is anything more than an interesting look back in time. But if you have one of those friends who is always pestering you about buying the index . . . send him the link. But only if you have done better.

I used to follow the old dshort.com for his interesting charts through the thick of 2008 bust. Back in 2011 he sold to an outfit called Advisor Perspectives.
But
the charts continue to paint a picture of what is happening, courtesy of Jill Mislinski. And they publish a calendar of charts to come.
There is a variety of interesting articles and commentaries on the rest of the site if you poke around. You won't be assaulted by obvious advertising. But somebody is paying the bills. Here is their
about.

