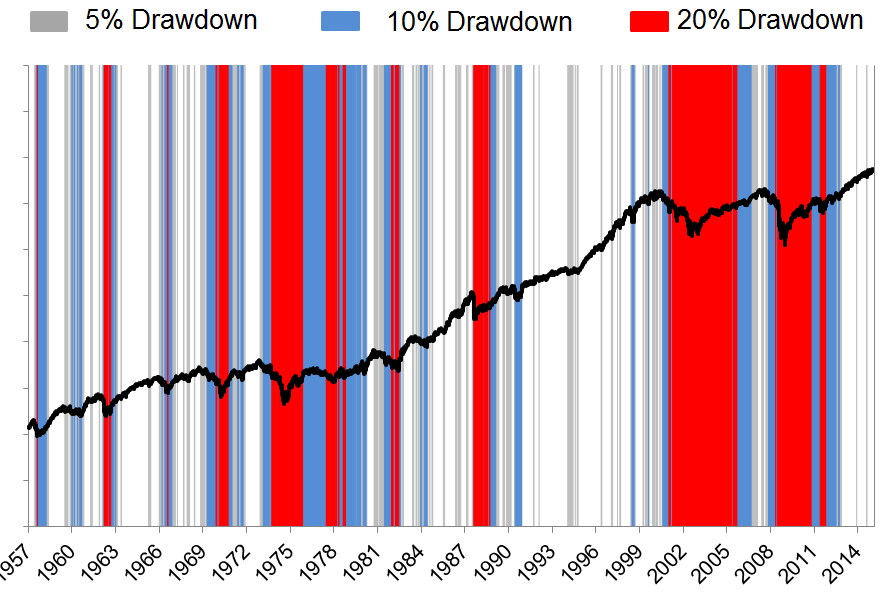
Sometimes its useful to take a step back and look at the big picture.
Joshu Brown writes: "In the chart below, I’m showing you how often the S&P 500 is in drawdowns of greater than 5, 10 and 20% from all-time highs. The white space is when the S&P 500 is at or within 5% of all-time highs (my god, look at the 1990’s!)." To his comment I would just add "My god, look at the 21st century!".
Here is the chart:

Here is the post:
thereformedbroker.com/2015/04/24/how-we-do-tactical/

Comments
Regards,
Ted
Most investors are terrible at trading — that is, they're not good at predicting short-term swings in the market.
More often than not, investors find themselves buying high and selling low. And when the market starts selling off sharply, investors will panic, sell their own shares, and sit on the sidelines.
Unfortunately, some of the biggest one-day upswings in the market occur during these volatile periods.
http://www.businessinsider.com/cost-of-missing-10-best-days-in-sp-500-2014-3