Howdy, Stranger!

It looks like you're new here. If you want to get involved, click one of these buttons!

Here's a statement of the obvious: The opinions expressed here are those of the participants, not those of the Mutual Fund Observer. We cannot vouch for the accuracy or appropriateness of any of it, though we do encourage civility and good humor.
  • 5% CD at Fido (Jonesboro State Bank)
    Navy Federal FCU. "Our members are the mission." Bushwah. Restrictive now, with deposits by check, and the best available CD rate is still just 3.45%.
  • 5% CD at Fido (Jonesboro State Bank)
    Jonesboro State Bank CDs are all gone? Yields of both CD and treasury are going up.
    Still available - looks like 3,325 left.
  • Worst. Bond. Market. Ever.
    [also posted at Bogleheads.org, and maybe a few more to come, but I've gotten good value here at MFO and wanted to post it to give back.]
    Here at the end of the 3rd quarter, the statement has become true, period, with no qualifier other than “as regards investment grade bond markets in the US and Britain.”
    The statement can be evaluated over four time frames, in all cases treating the first nine months of 2022 as if these were 12 month returns. Tickers used to determine 2022 returns are in parentheses. All are nominal total returns and year-to-date as of 9/30/2022.
    1. Since December 1972 (total bond, BND)
    2. Since December 1925 (intermediate Treasuries, VGIT, and long Treasuries, VGLT)
    3. From January 1793 to January 1926 (long investment grade bonds, mostly governments, BLV)
    4. August 1753 to December 1918 (British Consols, EDV as the comparison)
    Charts and brief discussion follow,. Red dashed line shows 2022 return, bars show historical returns over rolling twelve-month periods.

    [b]Total Bond[/b]
    image
    This one is a staple of 3-fund portfolios and Vanguard Target Date funds. It’s probably the most shocking outcome within the Boglehead universe. As of 9/30, BND was down 14.50%. The worst previous 12 month return on the Bloomberg-Barclays Aggregate was the 12-month roll through March 1980 at minus 9.20%.
    I think it fair to say that few 3-funders had any conception that BND could decline by double-digits in the space of a year.
    But then again, a fifty-year record is not a lot to support a claim like “ever.”

    [b]Intermediate Treasuries[/b]
    image
    This is where investors go if they find BND holds too much risk for comfort, whether duration risk or credit risk. VCIT is down 11.46% in 2022. That’s head and shoulders below the worst previous 12-month return of minus 5.55% ending in October 1994. So much for “safe.”
    And 96 years maybe does qualify for “ever.”

    [b]Long Treasuries[/b]
    image
    VGLT really took it on the chin in 2022, down 28.51% thus far. It’s a reminder of why long bonds have a bad reputation in the eyes of some. Maximum duration, maximum price decline in an adverse environment. Turns out, the bad times in the 1960s and 1970s don’t really hold a candle to 2022. The worst previous 12-month return on the SBBI long bond was minus 17.10% for the period ending March 1980. That’s in nominal terms, as are all these comparisons. I’ll look at real returns at the end of the year, since most of the older inflation data (pre-1913) are only available on an annual basis.
    Again, 2022 produced the worst return on long Treasuries seen over any 12-month period in the past 96 years. By far.

    [b]Long bonds[/b]
    image
    This is a spliced series:
    1. My index of long corporates from 1925 back to 1897; https://papers.ssrn.com/sol3/papers.cfm?abstract_id=3805927
    2. My aggregate of corporate, municipal and Treasuries to 1842;
    3. Municipals to 1835; Treasuries and municipals to 1825; Treasuries to 1793.
    You have to go back over 150 years, to the 1840s, when states defaulted on their debts, to get a result that even comes close to the 2022 results for BLV (which pegs toward the midpoint of VGLT and VCLT). BLV saw a decline of 28.41% in 2022; the worst previous decline was the minus 22.88% decline for the period ending in January 1842. In April, 2022 was only a contender for worst ever in this bond category; it took bad returns in June and again in September to push 2022 returns below even those seen in 1842.
    I’d say 228 years is a good approximation of “ever.”

    [b]Really long bonds: British Consols[/b]
    image
    These were perpetuities, so the proper comparison would appear to be the Extended Duration Treasury fund. EDV got slaughtered in 2022, down 37.40%. That would be a mighty bear market even in stocks, much less safe government bonds.
    Nothing in the British Consol record comes close, not even the worst months of the Napoleonic Wars. The chart shows 12-month rolls from 1753 to 1823. An earlier examination December on December annual returns had shown all the worst returns to fall within in this stretch. Later years, in the heyday of the British empire, were mostly fine. WW I returns, nominal, in particular did not plumb the depths of Napoleonic returns.
    Consols down 20% plus? Happened more than once in the Napoleonic Wars (and before, in the American Revolution, and almost, in the Seven Years War). The worst case was minus 23.17% for the period ending July 1803. A Consol total return worse than minus 25%? Never happened. Return worse than 30%? Never approached, not even close.
    2022 EDV returns stand alone at the bottom of a chasm.
    And if 269 years isn’t a good proxy for “ever,” I don’t know what qualifies.
    [b]Summary[/b]
    image
    Unprecedented, across the board.
    [b]Why has 2022 been so bad?[/b]
    One word: duration, my boy, duration!
    Technically, modified duration, or the price sensitivity of a bond to a change in interest rates.
    Duration is a function of maturity (as everyone knows) and of coupon/yield (which most people forgot or never knew).
    1. Long bonds fall more when rates go up.
    2. Low coupon bonds fall more when rates go up.
    3. Low coupon, long bonds plunge when rates go up.
    [b]What that means in practice[/b]
    The last big bond bear market occurred at the dim horizon of memory for most investors active today, i.e., in the late 1970s. Rates on the 20-year Treasury rose from about 6% in 1972 to over 14% at one point in 1981.
    The 2022 bear market (so far) has seen a much smaller rise in rates, a little more than 200 bp since the beginning of the year. Why then has 2022 clocked in as historically awful?
    First, note the pacing: it took nine years for rates to rise 800 bp in that hazily remembered bear market, an average rise of less than 100 bp per year. 2022 saw more than twice that rise in just nine months.
    And the real kicker: in that long ago bear market, rates were already higher at the start than almost any observer expects to see in the current cycle. High rate equals more coupon income to defray price drops, and a more favorable total return, since duration is also less at high coupons.
    Back to 2022: an achingly low rate to start, less than 2.0%, and a rapid price drop, combine to produce a potent, toxic brew for bond total return.
    Next, the last time long Treasury rates were as low as in 2020-2021 falls outside the lived memory of most investors. It was just under 2.0% in early 1946. And it took 12 years of drip-drip declines before that yield rose as high as the current 4.0%.
    Now you have some sense of why 2022 has been so much worse for bonds than ever before.
  • Buy Sell Why: ad infinitum.
    Waiting a little while to buy anything more. Look at CM. $42.56 USD. Bargain basement. Smells delicious...... Small dividend arrived today from NHYDY.
    Salivating over RY. BMO. ABB. ENGIY.
    Carnage wherever you look. As I have said many times before: the Market always overreacts, both to the downside and the upside.
  • Nowhere near as bad as ‘07-‘09 - Yet
    Some incredible destruction of wealth taking place. TROW @$106 is off over 45% YTD as well as for 1 year. ISTM not long ago that one was thought a “safe” long term hold suitable for Grandma. (Grandma may need to get a job.)
    Fed’s plan appears to be - Make us all poorer so we can’t buy as much. Than everyone will be better off.
  • World’s largest crypto exchange hacked with possible losses of $500m
    Following is an unedited news article from The Guardian:
    Binance, the world’s largest cryptocurrency exchange, may have lost half a billion dollars after a hack of its network.
    The company temporarily suspended transactions and the transfer of funds after detecting an exploit between two blockchains, a method of digital theft that has been used recently in at least one other major hack.
    “The issue is contained now. Your funds are safe. We apologize for the inconvenience and will provide further updates accordingly,” Binance’s CEO, Changpeng Zhao, said in a tweet.
    Binance originally said that $100m to $110m in funds were taken. Since then, CNBC has reported the crypto company has lost $570m.
    In a blogpost on Friday, Binance said it was working on locking down any areas of vulnerability. “First, we want to apologize to the community for the exploit that occurred. We own this,” the company wrote. “Thanks to the assistance of all the security experts, projects, and validators, the vast majority of the funds remain under control.”
    Last year Binance said that it was time for global regulators to establish rules for crypto markets. The company acknowledged at the time that crypto platforms have an obligation to protect users and to implement processes to prevent financial crimes, along with the responsibility to work with regulators and policymakers to set standards to keep users safe.
    Binance is just the latest crypto company to experience a targeted hack. In August Nomad, a service that allows users to send crypto tokens between different blockchains, was struck, with media reports saying it was taken for nearly $200m. Harmony, another transfer service, lost about $100m in a hack in June.
    Associated Press contributed to this article
  • Fed to deliver another big rate hike as job market fails to cool
    Brace yourself that a 75 bps rate hike is coming next month. Labor cost (service cost) is unlikely to come with lower employment rate reported today.
    https://fidelity.com/news/article/top-news/202210070938RTRSNEWSCOMBINED_KBN2R21CN-OUSBS_1
  • Nowhere near as bad as ‘07-‘09 - Yet
    Wait....is 'covenant-lite' loans essentially a modified version of NINJA loans? Yikes, they never learn, do they.
  • TBO Capital
    I guess I`m not the only one tempted by their promise of higher than possible returns. I actually saw that they disappeared a little more than a week ago & figured that others would find out also, since they used to make payments on the 5th of each month. For what it`s worth, I located the actual person behind this fraud: Darius Karpavicius who also hides behind his shill company called HMC trading, LLC. He uses a fake mailing address. Also, all the LinkedIn profiles were fabricated and the image photos were stock photos. I felt it in my gut, but went with it anyway.
    Anybody heard of or done business with? It's a private Healthcare fund. I can't seem to find anything on them...except from them..ha! Claims good returns but? Any experiences? Thanks
  • 2% swr
    Some of these comments make me wonder if the poster read the MW article (Hulbert is a smart and prudent cookie, in my long experience of reading him) , much less the original paper, downloadable here: https://papers.ssrn.com/sol3/papers.cfm?abstract_id=4227132 , and hugely sobering if the case.
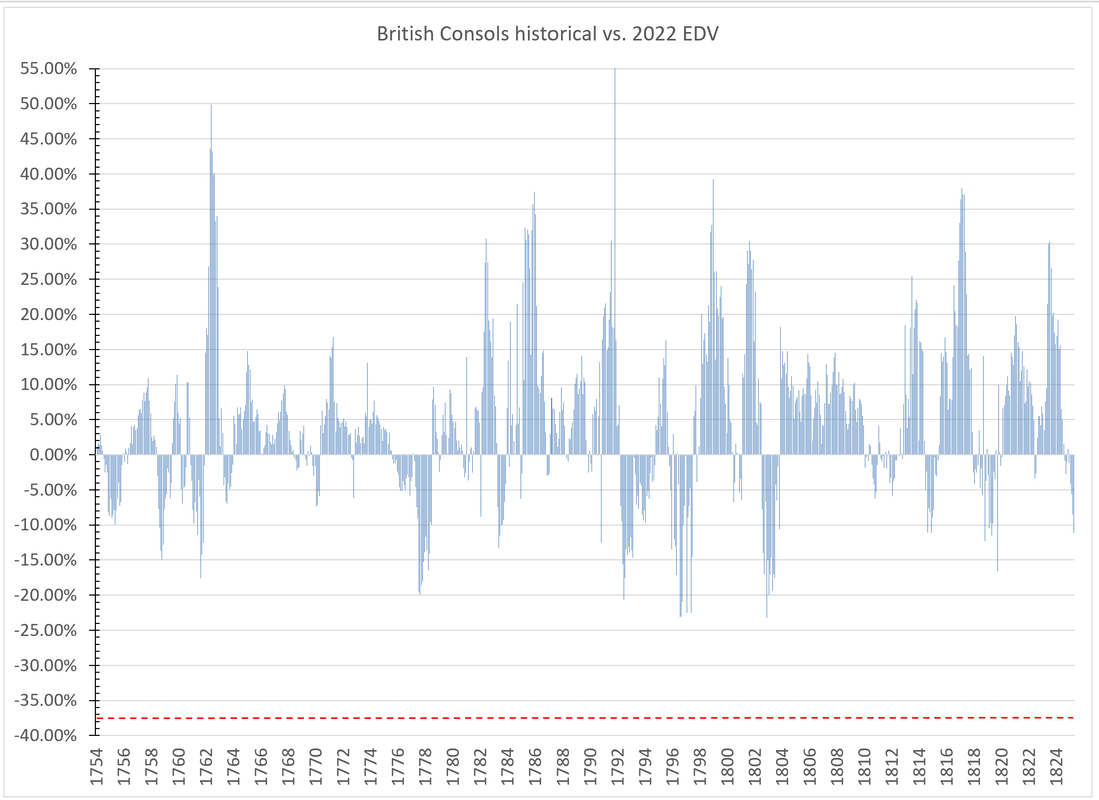
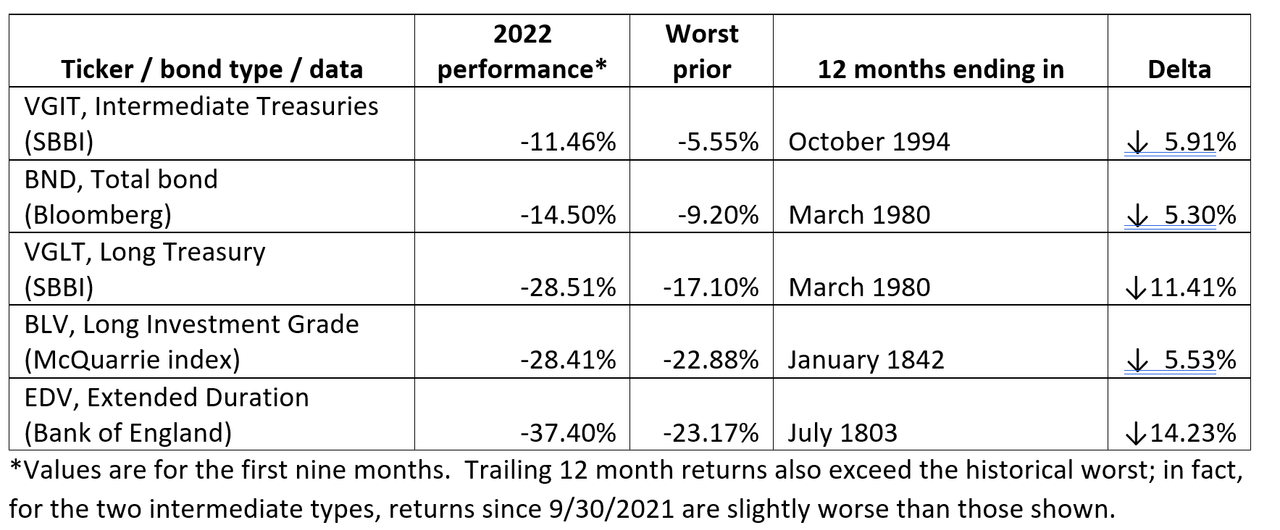
    Still a rank newbie here at MutualFundObserver and I will take instruction as to whether it is appropriate to point to related discussions on another forum.
    Hoping that it is, I started a discussion on this paper over at Bogleheads.org: https://www.bogleheads.org/forum/viewtopic.php?t=387165
    Although some posters defaulted to a thumbs up/ thumbs down stance, there are also some quite searching criticisms of the paper. I would say on balance that good reasons were given for not accepting the headline withdrawal rates in the study. Much depends on how to treat war loss years.
    I'll monitor any responses here in this thread and respond here if I can.
  • 2% swr
    It turns out that deferred accounts are deadly for some widows. The following is an estimate I have made of the federal tax and Medicare B consequences of my husband's death.
    Although my income including RMDs from both accounts goes down 19.12%, my taxable income only goes down 8.79% which makes my taxes go up 33.53% landing me in a higher tax bracket.
    I'm not sure yet what exactly will happen with Medicare B or when it will happen. As far as I can tell I will, at a minimum, triple my Medicare B premium. It may quadruple if I read the latest table correctly.
    Dear Anna: you may find this paper reassuring (or not): https://papers.ssrn.com/sol3/papers.cfm?abstract_id=3896672
    I took a behavioral finance approach in the paper: yes, single tax rates are higher, and yes, unlucky singles can pay more in IRMAA than the couple had.
    But rates are one thing, net dollars paid / saved are another. The paper argues that if you focus on whether you can fund the same lifestyle, as a widowed survivor, that you had as a member of the couple, you are probably going to be okay. Financially, that is; emotionally is another thing.
    I would welcome your comments and those of anyone else on the board.
    PS: the paper should be free to access, as all ssrn.com papers
  • Krugman: Tracking the Coming Economic Storm
    Interesting: https://nytimes.com/2022/10/06/opinion/fed-inflation-interest-rates.html
    Part of the problem is that the Fed hasn’t done what it’s doing now — drastically tightening money to fight inflation — for a long time, indeed since the early 1980s. And some analysts, perhaps including people at the Fed, may have forgotten one important lesson from monetary policy in the bad old days. Namely, it takes a significant amount of time before higher interest rates translate into either an economic slowdown or a drop in the inflation rate.
    Consider how Fed policy affects the real economy. One of the main channels is through housing. Higher interest rates lead to reduced demand for houses, which leads to a fall in construction; as incomes earned in housing construction slide, this leads to reduced demand for other goods, and the effects spill over to the economy at large.
    But all of this takes a while. The Fed’s rate hikes have indeed led to a sharp fall in applications for building permits. However, construction employment hasn’t yet even begun to decline, presumably because many workers are still busy finishing houses started when rates were lower. And the wider economic effects of the coming housing slump are still many months away.
    The other major channel through which the Fed affects the economy is via the value of the dollar. A strong dollar makes U.S. products less competitive on world markets; falling exports and rising imports will eventually be a major economic drag. But it takes time to shift to new suppliers, so this effect won’t really happen until next year.....
    ....For example, a new report shows that unfilled job offerings fell sharply in August. Why is this important? Many economists — especially economists who have been warning about persistent inflation — argue that the tightness of the labor market is better measured by the ratio of job vacancies to unemployment than by the unemployment rate itself. But this ratio, while still elevated, has already dropped substantially; as Goldman Sachs puts it, almost half of the gap between jobs and workers has been eliminated over the past few months.
    Another new report shows that demand for apartments has stalled, which will eventually translate into a decline in rent growth — which basically drives official estimates of the cost of shelter, a key component of most measures of underlying inflation.
    Oh, and remember all those supply-chain problems that disrupted the economy and raised inflation some months back? Well, the cost of shipping a container across the Pacific, which was $20,586 in September 2021, is now $2,265.
    I’d argue that these indicators tell us that the Fed has already done enough to ensure a big decline in inflation — but also, all too possibly, a recession.
  • Nowhere near as bad as ‘07-‘09 - Yet
    Interesting WSJ article from a couple days ago (October 5): “Markets Are Stuck in Overreaction Mode” by James Mackintosh. I won’t attempt to quote any of it. But maybe some have access to the WSJ or might find another accessible source.
    I think Mackintosh is correct as far as he goes with this short article. His premise is that relatively insignificant bits and pieces of financial news (earnings reports, FedSpeak, payroll numbers, etc.) are eliciting outsized reactions by investors. This accounts for the massive daily swings in the major indexes of the past few weeks. I’d take it a step further. I glean from various reports (mostly Bloomberg) that a lot of folks are doubling down on their bets and piling into one side or the other. Large amounts have poured into inverse funds (like SPDN) in recent months and some are even using inverse 3X funds! So when markets move / adjust to new reports, the swings can be enormous.
    Where does this all come down? Likely a goodly overshoot on the downside before it’s over. By the same token, there should be some very attractive valuations at some point for those with the patience and long enough time horizons. In the meantime - Buckle Up.
  • Nowhere near as bad as ‘07-‘09 - Yet
    According to Bloomberg the S&P is now down 21.44% YTD. The NASDAQ is off a bit over 29% over that period. According to Wikipedia, from late 2007 until March 2009 the S&P lost about 50% of its value. In truth, the ‘07-‘09 bear market was much longer than the current one. Precious metals miners bucked the down trend today. Not sure if this is the start of a p/m bull market, but quite interesting. By all accounts, Friday’s Payrolls numbers release is a major mover to keep an eye on.
    Wikipedia 2007-09 Bear Market
  • 2% swr
    Just got this little booger via email from TRP. Their findings show that 7 of 10 in retirement are still possessed of a saver's mentality----- willing to adjust their withdrawals if needed in order to be prudent. (I suppose what's unstated here is that most retirees are not wealthy. If they were rich, they'd not worry about this stuff at all, eh?) TRP offers a little test. Where do YOU fall on the continuum?
    https://www.troweprice.com/personal-investing/resources/insights/spenders-vs-savers-how-to-determine-your-retirement-spending-personality.html?cid=PI_Single_Topic_NonSubscriber_RET_EM_202210&bid=1099700455&PlacementGUID=em_PI_PI_Single_Topic_EM_NonSubscriber_202210-PI_Single_Topic_NonSubscriber_RET_EM_202210_20221006&b2c-uber=u.C70CEE71-16A5-E6FF-FF67-9E86F48AE56B
  • 2% swr
    Hmmmmmm. I have an additional question: The lion's share of our stuff is all in T-IRA. Reported income (SS and Defined Benefit pension) puts us in a "no tax due" status in terms of our 1040. My annual withdrawals from the T-IRA are small enough so that we still owe no tax due. And in a declining market, I will simply not take my customary annual withdrawals. But RMDs will surely have to be paid. (starting at age 72 now, right? 4 years from now, for me.) Does a conversion to Roth make any sense at all for us? Wife is 19 years younger. Her T-IRA is just 5% of our combined total. And after I'm gone, her plan is to move back to her home country. We have a house there already. Expenses will be ridiculously low---- except for the constant begging from the extended family.
  • 5% CD at Fido (Jonesboro State Bank)
    A milestone of sorts....the first time I've seen a 5% CD in a few decades. Fido offers a new 13 year CD from Jonesboro State Bank with a 5% coupon, but it's callable (not protected). Pays interest MONTHLY.
  • JPMorgan Small Cap Equity Fund re-opening to all investors
    https://www.sec.gov/Archives/edgar/data/1217286/000119312522258615/d252223d497.htm
    497 1 d252223d497.htm JPMORGAN TRUST I
    J.P. MORGAN U.S. EQUITY FUNDS
    JPMorgan Small Cap Equity Fund
    (the “Fund”)
    (a series of JPMorgan Trust I)
    (All Share Classes)
    Supplement dated October 6, 2022
    to the current Summary Prospectuses, Prospectuses and Statement of Additional Information, as supplemented
    Effective October 28, 2022, the Fund will no longer be subject to a limited offering, and all limited offering disclosure relating to the Fund will be deleted.
    INVESTORS SHOULD RETAIN THIS SUPPLEMENT WITH THE
    SUMMARY PROSPECTUSES, PROSPECTUSES AND STATEMENT OF ADDITIONAL
    INFORMATION FOR FUTURE REFERENCE
    SUP-SCE-1022
    The fund has been closed to most new investors since December 30, 2016.
  • Commentary
    https://www.ft.com/content/5b4bd18f-cc40-4542-a025-6190f898a406
    "Wall Street finds a tax silver lining in down market
    Banks are helping wealthy clients to sell investments at a loss to lighten their bills
    "
    In the MFO, on Sunday.
    In The FT today.
    You are welcome :)