Howdy, Stranger!

It looks like you're new here. If you want to get involved, click one of these buttons!
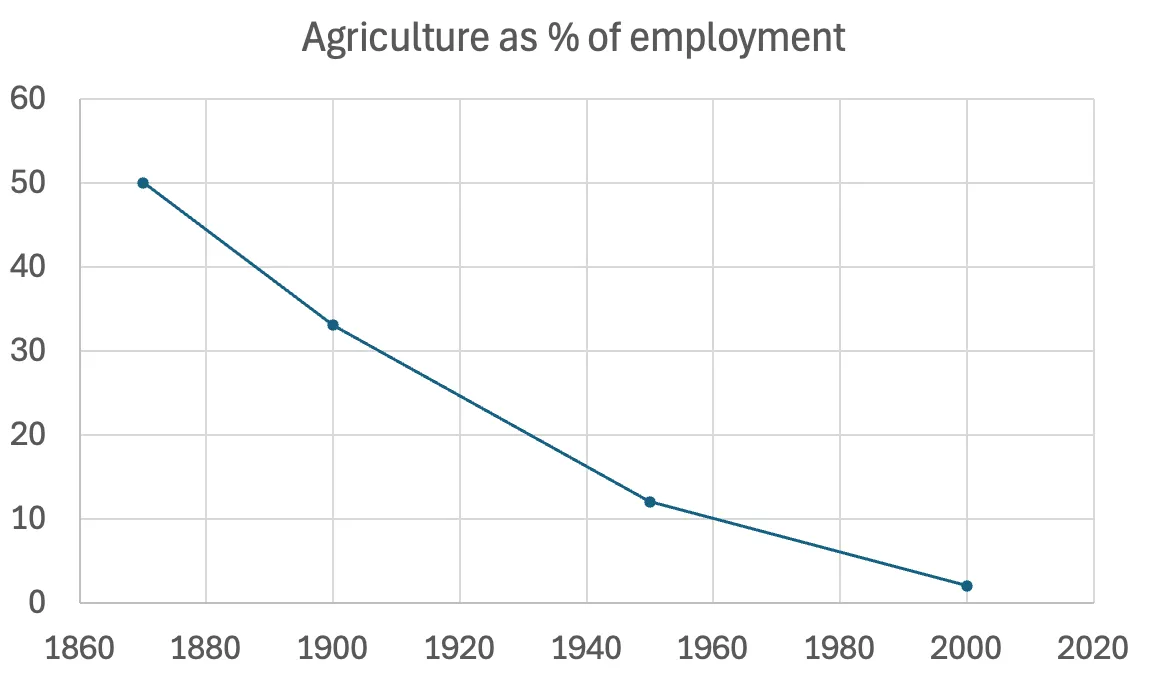
Here's a statement of the obvious: The opinions expressed here are those of the participants, not those of the Mutual Fund Observer. We cannot vouch for the accuracy or appropriateness of any of it, though we do encourage civility and good humor.
  • on the failure of focus
    @david_snowball I have tried to figure out how to capture concentration risk better for portfolios. I have not succeeded given the tools at hand. I am convinced however that most investors have few good ideas. All the money comes from those ideas and everything else is a go along waste of time. I would rather have managers focus than not focus. If they can't make money, then get out. But going with the non-focused is a waste of fees and money. It also doesnt taste a manager's level of conviction or investing skills. No person can have 75 good ideas for stocks and holding 1-1.5% per position is just blah.
  • on the failure of focus
    Interesting. If it was not a matter of choosing / strategy, and was in other words more random, you might expect that fewer (notionally 'best of the best') would invariably be better.
    Same as when you compare TR for XLG, VOO, and VONE 10-5-3-1y. Diworsification and all that.
  • on the failure of focus
    Long ago I developed a curiosity about whether focused / non-diversified / concentrated portfolios offered some distinctive advantage. The purest test I could imagine was finding paired sets of funds run by the same manager using the same strategy, one of which was a focused fund. Found five, one of which (ICAP / ICAP Select) is now dead.
    Purely in total return, not risk-adjusted return, terms:
    Ariel / Ariel Focus - Focus wins the 3-year race, loses the 5-year
    Marsico / Marsico Focus - Focus wins 3-year and 5-year
    Oakmark / Oakmark Select - Select loses 3-year and 5-year
    Yacktman / Yacktman Focused - virtual tie for 3-year and 5-year, with Focus trailing by 15 bps
    My interim conclusion: concentration is not a reliable tool for adding alpha. Am I missing fund pairs or an insight?
  • T. Rowe debuts first tax-free municipal bond ETF

    T. Rowe Price debuts its first tax-free municipal bond ETF (TAXE)
    BALTIMORE, July 10, 2024 /PRNewswire/ -- T. Rowe Price (NASDAQ-GS: TROW), a global investment management firm, announced today the addition of its first federally tax-free fixed income exchange-traded fund (ETF) to its active ETF roster. T. Rowe Price Intermediate Municipal Income ETF (Ticker: TAXE) began trading today on the NASDAQ exchange.
    The Intermediate Municipal Income strategy focuses on investment-grade intermediate-term municipal bonds with a weighted average effective maturity of four to 12 years. T. Rowe Price Intermediate Municipal Income ETF is co-managed by James Lynch and Charlie Hill, who collectively have 53 years of investment experience, and have served in portfolio management roles for other T. Rowe Price intermediate-term municipal bond strategies. This ETF is a new strategy, the first of the firm's fixed income active ETFs that is distinct from existing T. Rowe Price mutual funds.
    T. Rowe Price Intermediate Municipal Income ETF (Ticker: TAXE)
    Seeks the highest level of income exempt from federal income taxes consistent with moderate price fluctuation
    Net expense ratio is 0.24%
    < - >
    https://www.prnewswire.com/news-releases/t-rowe-price-launches-its-first-active-tax-free-bond-exchange-traded-fund-302193635.html
  • Earnings Recession over for the 493
    Good news for the rest of the S&P index. It's free at Yahoo. Dinky linky.
    Details:
    According to data from BofA's US equity strategy team, earnings for the S&P 493 haven't registered year-over-year growth since the fourth quarter of 2022.
    [snip]
    The upcoming second quarter earnings period, however, should mark the end of what's been a stealth earnings recession for the vast majority of companies in the S&P 500. For the 493 non-Mag 7 stocks, earnings growth is forecast to clock in at 6%, 7%, and 13% annually over the second, third, and fourth quarters of 2024.
    Punchline:
    Yet, as often happens in the investing world, this peak of frustration with a market environment that has come to resemble celebrity culture, in which just a few stars draw the headlines, appears set to crescendo. At which point stocks that comprise "anything else" will meet an investor community eager to think about just that.
    I better check my seatbelt.
  • Updated MFO Ratings and Flows: March ... MTD Thru 11 April
    Gentle reminder ... Mid-Year Review is now today, 10 July, at 11 a.m. Pacific. Please join in by registering here.
  • Where did they all go
    I redid 2024/YTD/Daily View this AM and they are back to the high levels.
    So, @jptak's explanation makes sense that yesterday's data were snapshots from the times that all of the daily data didn't report. And if so, someone can monitor these numbers from 6:00 PM (Eastern) onwards, and they should change frequently until they they stabilize.
    @msf's point is also valid - that the total numbers probably include all classes of funds. It makes sense because M* now treats each fund class separately (due to differences in ERs) and it has different Star- and Analyst- Ratings and performance data for them.
    Interesting that, yesterday, @Mark's OP was at 2:20 PM when nothing should have been going on fund data-wise, and mine was at 6:29 PM when fund daily data reporting had started. I assume that MFO timestamps are for local times, and I am in the Central time.
    2024/YTD/Daily View

    1,112 1,391 1,176
    495 423 305
    548 587 480
  • Buy Sell Why: ad infinitum.
    @WABAC,
    I did not know about BDAFX. Re its financial allocation, I see Visa, Moody's, SPG, MA, etc. in the top 10. I learned growth is a very broad term and as you implied, one must know where one wants to source or is sourcing growth from. E.g., one could have invested in MRFOX for growth and wondered why it did not work since April.
    BTW, I like FMILX too.
    If you are open to ETFs, Fidelity has a bunch of growth style box ETFs of their own.
    Good luck.
  • Where did they all go
    The number of "funds" in 2023 looks more like share classes than actual funds.
    The nine style boxes of broad based domestic equity funds add up to 6,918. ICI reports a total of 8.578 domestic equity share classes (including all domestic categories but excluding funds of funds), but only 2,880 unique domestic equity funds. In fact, in total ICI reports just 7,222 funds including equity, bond, hybrid, and money market funds.
    The 2024 figure (totaling 3,454) still exceeds the ICI fund figure (YE 2023) of 2,880, but at least it's in the right ballpark.
    2024 ICI Investment Company Fact Book - list of tables
    ICI table of number of funds by type and year
    ICI table of number of share classes by type and year
    It would have been so much easier to examine M* figures with its premium fund screener. That had a "distinct funds only" filter. But alas, M* now offers only a crude tool on its "Investor" site. FWIW, that screener reports a total of 6,033 domestic "funds" in the nine style boxes. Well less than the 6,918 total of the nine boxes.
    This suggests that M* is including in its "number of funds" counts some esoteric classes or types of funds that neither ICI nor M* itself (in its screeners) is counting. That in turn lends credibility to the idea that M* switched from share classes to funds in its reporting of total funds in category.
    From the M* glossary (UK version):
    Number of Funds in Category
    The number of funds classified in the same category as this fund.
    https://www.morningstar.co.uk/uk/glossary/98231/number-of-funds-in-category.aspx
  • Where did they all go
    It seems that number of funds have gone down significantly for all 9-box categories.
    2023

    1,200 1,430 1,217
    553 420 397
    597 615 489
    2024/YTD/Daily View

    603 705 610
    277 201 211
    298 298 251
    These correspond to:

    IVW IVV IVE
    IJK IJH IJJ
    IJT IJR IJS
  • Where did they all go
    M* was going to make changes to its 9-box styles in August without much fanfare. But this is only early-July. I will check if M* jumped the gun.
    https://www.mutualfundobserver.com/discuss/discussion/62403/m-equity-style-box-changes-august-2024#latest
    Edit/Add. I couldn't find anything. But I see that total market VTI has been 71% LC, 20% MC, 8% SC in July. If someone is tracking M* style boxes, please post if this is significantly different from that in June or earlier.
  • Where did they all go
    So I tend to look at the Buy-Sell-Why thread often and just today focused on the Large Cap Growth category. Scrolling down to the Growth of $10K graph I saw that over a 10-yr time span the number of funds so categorized by M* dropped by nearly 66% if I'm reading or interpreting the data correctly. Is this true? Is it because of the explosion in ETF's or other?
    From the FSCVX data page (from 2014 - 2024):
    # of Invest. in Cat. 1,710- 1,681- 1,463- 1,363- 1,405- 1,360- 1,289- 1,237- 1,235- 1,200- 603
  • Buy Sell Why: ad infinitum.
    Results since 20220101 ("Normalization") dinky linky.
    Results since 20200101 ("Covid") dinky linky.
    I added the covid period because I will look at the Martin ratios for the funds.
    It's down to FDSVX or PRWAX. Tip of the cap to @stillers for drawing my attention to funds I had missed.
  • Buy Sell Why: ad infinitum.
    @Stillers, the money was previously invested in tech funds, so moving to growth seems appropriate. Good point about the inflation news, OTOH, if it's good news . . .
    I look at the last three years to see how the funds have behaved since the end of ZIRP. And when I run them through Portfolio Visualizer I'll start the clock at January 2022 for an even tougher challenge. I think the issues of inflation and interest rates are likely to be with us for a while.
    I did have to look at five and ten year returns to insure that the funds I am testing have performed at least as well a AMAGX over those time periods. I then looked for funds with an active share over 50. That left me with FDSVX, PRWAX, and FTRNX which I am examining now.
    I am at 30% bonds, 10% cash. Most of the bonds are low duration floaters. But I'll leave that for another day. That's about as high as it will get for me given what I have in IYK, FSUTX, and GLIFX.
  • Buy Sell Why: ad infinitum.
    Tough choice for us between FDSVX and FBGRX but settled on the former. PRWAX is one of the most underrated LCG funds. We would own any of them over AMAGX.
    Other thoughts:
    Not sure of your situation, but if this is new money, might not be the best time to plow into Growth after its epic, current bull run. FWIW, we have recently reduced overall stock exposure including Growth and may go to all Cash if things start getting ugly en route to Nov. Also, if plowing money in this week, we would at least do some before/after Thu/Fri CPI/PPI announcements. They've been market movers this year.
    We always look beyond 3 years of performance and think that everyone should. If its the same manager(s), not sure why anyone wouldn't.
    Baron's Growth funds can run very hot/cold. We're likely done with that family of funds because of it.
    ERs are important but TR is obviously far more important (to us at least). A great, managed LCG fund will run ~.50-.80, as do the ones I listed. Coupled with a LCG index fund at ~.02 and you're at half that. FWIW, our weighted portfolio ER is .46. If ERs though are a primary driver for you, looks like AMAGX's ER of .91 is the highest of the bunch here and almost double FBGRX's .48.
  • Investing in CEFs - Tips & views from 3 different sources
    FWIW: My 30/70 retirement portfolio has 4 CEFs which are 31.9% of the total PF. They run from 7 to 9% each.
  • Property Fraud Allegations Snowball as Commercial Real-Estate Values Fall
    Yet it is legal and acceptable for banks to carry CREs at their book values, i.e. the CREs don't have to be marked-to-market promptly. That was one of the issues that shook up the regional banks in early-2023. There are other problems too - e.g. HTM and AFS classifications of Treasurues and bonds held.
    Those issues are just no longer in the news, but those problems didn't disappear.
    BTW, originators of securitized debt (MBS, ABS, CLO) are now required to keep some on their books and there are also stricter clawback provisions for bad/defective debt found in the pool. These reforms came after the GFC.
    Regional Bank ETF KRE https://stockcharts.com/h-sc/ui?s=KRE&p=D&yr=2&mn=0&dy=0&id=p19878069220
  • Property Fraud Allegations Snowball as Commercial Real-Estate Values Fall
    This looks like the variation of the housing disaster we had only 15 years ago. That was not too long ago and how the mechanics are already in rinse and repeat cycle. I guess greed never sleeps.
    As a society, we admire / glorify people that commit white color crimes. The more blatant ones get elected to public offices.
    (A easier fix would be to require the originators and underwriters to hold a percentage of the loans that they originate / bring to the market.)
  • The Week in Charts | Charlie Bilello
    The Week in Charts (07/08/24)
    The most important charts and themes in markets, including...
    00:00 Intro
    00:21 Topics
    01:30 Betting on a Rate Cut
    06:07 The All-Time High Party Continues
    12:25 Investors Getting Greedy
    14:18 Apple's Highest Valuation Ever
    16:37 Tesla's Incredible Comeback
    18:28 A Coordinated Contraction
    21:11 More Listings = More Price Drops
    23:17 Cheaper Rents
    Video
  • Property Fraud Allegations Snowball as Commercial Real-Estate Values Fall
    "U.S. prosecutors are cracking down on commercial mortgage fraud, a growing push that is sending shudders through the $4.7 trillion industry by raising questions about the numbers underpinning major property loans."
    "At the heart of the problem is the way lenders underwrite commercial mortgages. Borrowers typically submit financial statements called T-12 that show building income and expenses for the past year. Lenders use these documents to estimate the building’s value and calculate how much they are willing to lend. But in most cases they don’t audit these statements to verify that the sums listed in the spreadsheets actually flowed in and out of the landlord’s accounts."
    "Landlords have an incentive to come up with inflated building profits so that they can land bigger loans. But lenders also often have an incentive to accept these inflated numbers, especially if they plan to repackage the loan and sell it off to investors, Griffin said. That is because bigger loans mean bigger fees."
    https://www.wsj.com/real-estate/property-fraud-allegations-snowball-as-commercial-real-estate-values-fall-492d964c?st=5b6slrn9dyyq3u9&reflink=desktopwebshare_permalink