For you younger people hoping to retire comfortably - give up the dream. Here is '15's budget. Not very extravagant and I really just buy what I want. I'm not constricting myself in any way. The total is what is important - it is close in the end.
Basic Living
House
1,981 RE Tax
2,556 HOA - includes outside mtc - painting etc, water, trash, lawn care.
489 Electric
928 Insurance
300 Misc Purchases
133 Mail Box
6,386 Subtotal House
Car
138 AAA
744 Routine Mtc.
1,164 Insurance
147 Registration
1,800 Gas
3,993 Subtotal Car
Personal Expenses
327 Income Taxes
1,200 Cash
360 Medical
340 Cell Phone
3,300 Food
600 Wine
133 Mail Box
396 Internet Access
300 Dining Out/Entertainment
4,230 Health Ins.
300 Clothes
- Driving Lic
-
11,485 Subtotal Personal Expenses
21,865 Total Basic Living
Incremental Living -1
- Travel Trailer Reg
492 Storage
- Good Sam
492
Incremental Living - 2
6,643 Travel/Education/Etc
Misc Hobbies
6,643
7,135 Total Discretionary
29,000 Total Basic + Incremental
For you younger people hoping to retire comfortably - give up the dream. First this is for the younger people. Not the first half of the baby boomers ('14-55) or those older.
Give up the idea of retiring comfortably. You don't have a defined pension plan, little in 401K, social security will be pushed out further, a VAT will be instituted to help with the debt (and Obamacare).
I own my home (no mortgage), truck and travel trailer, single (no debt). I retired in '07 at 51 and since then I averaged $27,000 in spending - that includes health ins and taxes. I'm estimating I will spend an average of $38,000 (includes $30,000 for a new truck) from '16-25.
I did a line item budget for this period. After '25 I grow expenses at 4%
Even with a small pension (13,000) and social security I estimate that only 6 years will be cash flow positive (from pension & SS I'm starting it at 63) starting in '19. I do use conservative estimates for capital growth 5%.
Now the younger people will not have a defined pension and will have to take full SS later or early at a reduced rate. I doubt the workforce will have many 65 y.o. in int or even 62.
The small pension and a good amount of savings that allowed the numbers to work.
So, abandon all hope and enjoy life while you are young. It will suck when you 55+.
Active share measure is misleading My individual investments in actively managed mutual funds almost exclusively involve individual funds that focus on one market segment or one investment style. So, it makes sense that my comparisons of active share numbers between funds would be restricted to the group of funds that share the same benchmark or style.
The AQR paper linked above includes a chart (Exhibit 1, page 6) that displays the fund data used by Petajisto. It displays the average active share percentage for the funds included in each of the benchmarks. It also looks more broadly at how average active share varies between the Large Cap, All Cap, Mid Cap, and Small Cap fund categories. It shows the average active share at about 7
5% for the funds included in the Large Cap benchmarks, 80% for the All Cap benchmarks, 88% for the Mid Cap benchmarks, and 92% for the Small Cap benchmarks. This supports the conclusion that sorting according to active share simultaneously sorts according to market cap.
I leave it to other to determine whether the data supports the proposition that high active share increases the odds that a fund will have superior fund performance. My point is that the data does appear to indicate it is most useful to compare active shares numbers only between funds that share the same benchmark...or at least that share the same broad categories. Both Exhibit 1 of AQR's paper and the response Cremers and Petajisto made to that paper in the link
@David_Snowball provided above appear to support this conslusion.
The Week Ahead: Healthcare Earnings Hi Ted!
With so much in healthcare, one really hopes things go well. I have added a 5th healthcare fund to the mix a while back, TMFSX, mainly for its short positions.
the Pudd
The Week Ahead: Healthcare Earnings FYI: Healthcare companies on a seven-year tear have been top performers so far in 201
5, helping to push broad stock indexes to record levels, but traders are now looking to protect themselves from a selloff as they await major earnings reports in the sector.
Companies reporting first-quarter earnings next week include Bristol-Meyers Squibb Co, Boston Scientific Corp , Merck & Co, Pfizer Inc, Gilead Sciences Inc and Celgene Corp.
Regards,
Ted
http://www.reuters.com/article/2015/04/26/markets-stocks-usa-weekahead-idUSL1N0XL1U520150426
SEC's Stock Market Reform Club Locks Out Retail Brokers Soft Dollar Brokerage: At the “Sunshine Meeting” on July 12, 2006 statements made by the Chairman, Commissioners,and staff of the SEC left the public with the common impression that a proposal for a “second wing” of Commission Guidance on disclosure and transparency of all institutional brokerage commission arrangements would be forthcoming before the end of 2006. [SEC Proposed Guidance S7-22-08 Comment C
http://www.scribd.com/doc/5578021/SEC-Proposed-Guidance-S7-22-08-Comment-C]The "second wing" of SEC guidance was never published. On May 27, 2007 SEC Chairman Christopher Cox sent letters to Senator Christopher Dodd and Congressman Barney Frank requesting that Section 28(e) be revised or repealed. [
http://www.scribd.com/doc/13752510/Cox-Requests-Legislative-Action]
The History of the Stock Market Since 1957 in One Picture @davfor: When I grow up I want to be just like you. Nice link !
Regards,
Ted
Most investors are terrible at trading — that is, they're not good at predicting short-term swings in the market.
More often than not, investors find themselves buying high and selling low. And when the market starts selling off sharply, investors will panic, sell their own shares, and sit on the sidelines.
Unfortunately, some of the biggest one-day upswings in the market occur during these volatile periods.
http://www.businessinsider.com/cost-of-missing-10-best-days-in-sp-500-2014-3
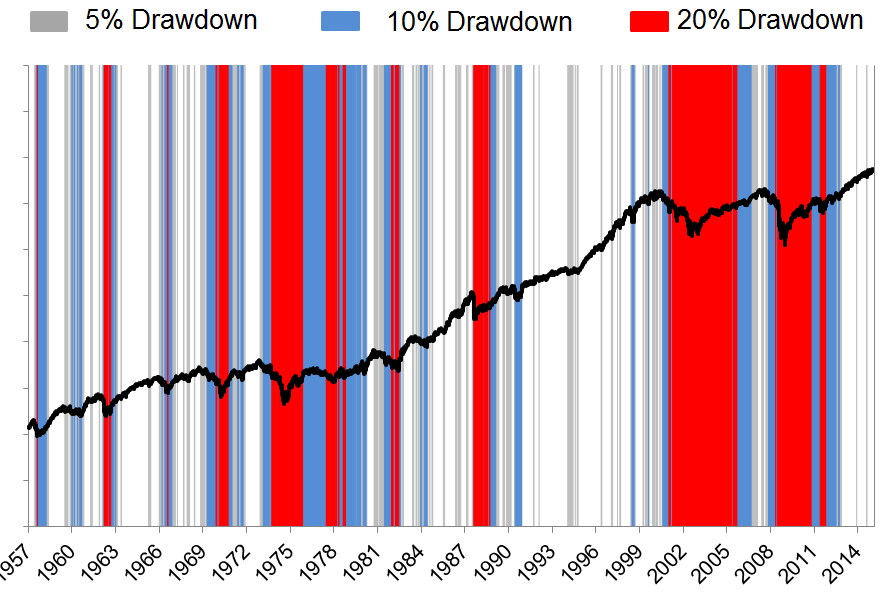
The History of the Stock Market Since 1957 in One Picture Sometimes its useful to take a step back and look at the big picture.
Joshu Brown writes: "In the chart below, I’m showing you how often the S&P
500 is in drawdowns of greater than
5, 10 and 20% from all-time highs. The white space is when the S&P
500 is at or within
5% of all-time highs (my god, look at the 1990’s!)." To his comment I would just add "My god, look at the 21st century!".
Here is the chart:
Here is the post:
thereformedbroker.com/2015/04/24/how-we-do-tactical/


