Category Archives: Funds

AQR Style Premia Alternative I (QSPIX), AQR Style Premia Alternative LV I (QSLIX), September 2015

By Samuel Lee

Objective and strategy

AQR’s Style Premia Alternative, or SPA, strategy offers leveraged, market-neutral exposure to the four major investing “styles” AQR has identified:

Value, the tendency for fundamentally cheap assets to beat expensive assets.

Momentum, the tendency for relative performance in assets to persist over the short run (about one to twelve months).

Carry, the tendency for high-yield assets to beat low-yield assets.

Defensive, the tendency for low-volatility assets to offer higher volatility-adjusted returns than high-volatility assets.

To make the cut as a bona fide style, a strategy has to be persistent, pervasive, dynamic, liquid, transparent and systematic.

SPA offers pure exposure to these styles across virtually all major markets, including stocks, bonds, currencies, and commodities. It removes big, intentional directional bets by going long and short and hedging residual market exposure. As with all alternative investments, the goal is to create returns uncorrelated with conventional portfolio returns.

SPA sizes its positions by volatility, not nominal dollars. In quant-speak, risk is often used as short-hand for volatility, a convention I will adopt. Of course, volatility is not risk (though they are awfully correlated in many situations).

SPA’s strategic risk allocations to each style are as follows: 34% each to value and momentum, 18% to defensive, and 14% to carry. Its strategic risk allocations to each asset class are as follows: 30% to global stock selection, 20% each to equity markets and fixed income, and 15% each to currencies and commodities. There is a bias to the value and momentum styles, perhaps reflecting AQR’s greater confidence in and longer history with them.

Risk allocations drift based on momentum and “style agreement,” where high-conviction positions are leveraged up relative to low-conviction positions. The strategy’s overall risk target falls in steps in the event of a drawdown and rises as losses are recouped. These overlays embody some of the hard-knock knowledge speculators have acquired over the decades: bet on your best ideas, cut losers and ride winners, and cut capital at risk when one is trading poorly.

SPA targets a Sharpe ratio of 0.7 over a market cycle. AQR offers two flavors to the public: the 10% volatility-targeted QSPIX and the 5%-vol QSLIX.

Adviser

AQR Capital Management, LLC, was founded in 1998 by a team of ex-Goldman Sachs quant investors led by Clifford S. Asness, David G. Kabiller, Robert J. Krail, and John M. Liew. AQR stands for Applied Quantitative Research. The firm’s bread and butter has long been trading value and momentum together, an idea Asness studied in his PhD dissertation at the University of Chicago. (Asness’s PhD advisor was none other than Eugene Fama, father of modern finance and one of the co-formulators of the efficient market hypothesis.)

When the firm started up, it was hot. It had one of the biggest launches of any hedge-fund up to that point. Then the dot-com bubble inflated. The widening gap in valuations between value and growth stocks almost sunk AQR. According to Asness, the firm was six months away from going out of business. When the bubble burst, the firm’s returns soared and so did its assets. The good times rolled until the financial crisis shredded its returns. Firm-wide assets from peak-to-trough went from $39.1 billion to $17.2 billion. The good times are back: As of June-end, AQR has $136.2 billion under management.

The two near-death experiences have instilled in AQR a fear of concentrated business risks. In 2009, AQR began to diversify away from its flighty institutional clientele by launching mutual funds to entice stickier retail investors. The firm has also launched new strategies at a steady clip, including managed futures, risk parity, and global macro.

AQR has a strong academic bent. Its leadership is sprinkled with economics and finance PhDs from top universities, particularly the University of Chicago. The firm has poached academics with strong publishing records, including Andrea Frazzini, Lasse Pedersen, and Tobias Moskowitz. Its researchers and leaders are still active in publishing papers.

The firm’s principals are critical of hedge funds that charge high fees on strategies that are largely replicable. AQR’s business model is to offer up simplified quant versions of these strategies and charge relatively low fees.

Managers

Andrea Frazzini, Jacques A. Friedman, Ronen Israel, and Michael Katz. Frazzini was a finance professor at University of Chicago and rising star before he joined AQR. He is now a principal on AQR’s Global Stock Selection team. Friedman is head of the Global Stock Selection team and worked at Goldman Sachs with the original founders prior to joining AQR. Israel is head of Global Alternative Premia and prior to AQR was a senior analyst at Quantitative Financial Strategies Inc. Katz leads AQR’s macro and fixed-income team.

Frazzini is the most recognizable, as he has the fortune of having a last name that’s first in alphabetical order and publishing several influential studies in top finance journals, including “Betting Against Beta” with his colleague Lasse Pedersen.

Unlisted is the intellectual godfather of SPA, Antti Ilmanen, a University of Chicago finance PhD who authored Expected Returns, an imposing but plainly-written tome that synthesizes the academic literature as it relates to money management. Though written years before SPA was conceived, Expected Returns can be read as an extended argument for an SPA-like strategy.

Strategy capacity and closure

AQR has a history of closing funds and ensuring its assets don’t overwhelm the capacity of its strategies. When the firm launched in 1998, it could have started with $2 billion but chose to manage only half that, according to founding partner David Kabiller.

Of its mutual funds, AQR has already closed its Multi-Strategy Alternative, Diversified Arbitrage and Risk Parity mutual funds. However, AQR will meet additional demand by launching additional funds that are tweaked to have more capacity. As of the end of 2014, AQR reported a little over $3 billion in its SPA composite return record. Given the strategy’s strong recent returns, assets have almost certainly grown through capital appreciation and inflows.

Because AQR uses many of the same models or signals in different formats and even in different strategies, the effective amount of capital dedicated to at least some components of SPA’s strategy is higher than the amount reported by AQR.

Management’s stake in the fund

As of Dec. 31, 2014, the strategy’s managers had no assets in the low-volatility SPA fund and little in the standard-volatility SPA fund. One trustee had less than $50,000 in QSPIX. Collectively, the managers had $170,004 to $700,000 in the SPA mutual funds.

Although these are piddling amounts compared to the millions the managers make every year, the SPA strategy is tax-inefficient. If the managers wanted significant exposure to the strategies, they would probably do so through the partnerships AQR offers to high-net-worth investors. But would they do that? AQR, like most quant shops, attempts to scarf down as much as possible the “free lunch” of diversification. The managers are well aware that their human capital is tied to AQR’s success and so they would probably not want to concentrate too heavily in its potent leveraged strategies.

Opening date

QSPIX opened on October 30, 2013. QSLIX opened on September 17, 2014. The live performance composite began on September 1, 2012.

Minimum investment

The minimum investment varies depending share class, broker-dealer and channel. For individual investors, a Fidelity IRA offers the lowest hurdle: a mere $2,500 for the I share class of the normal and low-volatility flavors of SPA. Or you can get access through an advisor. Otherwise, the hurdles are steep: $5 million for the I class, $1 million for the N class, and $50 million for the R6 class.

Expense ratio

The I shares cost 1.66%, the N shares cost 1.91%, and the R6 shares cost 1.56%, as of June 2023.

AUM is $825 million, as of June 2023.  

The per-unit price of exposure to SPA is lower the higher the volatility of the strategy. QSPIX targets 10% vol and costs 1.5%. QSLIX targets 5% vol and costs 0.85%. Anyone can replicate a position in QSLIX by simply halving the amount invested in QSPIX and putting the rest in cash. The effective expense ratio of a half QSPIX, half cash clone strategy is 0.75%.

Comments

QSLIX has been liquidated (June 2023). 

Among right-thinking passive investors who count fees by the basis point, AQR’s SPA strategy elicits revulsion. It’s expensive, leveraged, complicated, hard to understand, and did I mention expensive?

To make the strategy easier to swallow, some passive-investing advocates argue SPA is “passive” because it’s a transparent, systematic, and involves no discretionary stock-selection or market forecasting. This definition is not universally accepted by academics, or even by AQR. The purer, technical definition of passive investing is a strategy that replicates market weightings, and indeed this definition is used by the venerable William Sharpe in his famous essay, “The Arithmetic of Active Management.”

I do not think SPA is passive in any widely understood sense of the word. In fact, I think it’s about as active as you can get within a mutual fund. And I also happen to think SPA is a great fund. Regardless of my warm feelings for the strategy, I consider SPA suitable only for a rare kind of nerd, not the investing public.

Though SPA is aggressively active, its intellectual roots dig deep into the foundations of financial theory that underpin what are commonly thought to be “passive” strategies, particularly value- and size-tilted stock portfolios (DFA has made a big business selling them).

The nerds among you will have quickly caught on that what AQR calls a style is nothing more than a factor, a decades-old idea that sprung from academic finance.

For the non-nerds: A factor, loosely speaking, is a fundamental building block that explains asset returns. Most stocks move together, as if their crescendos and diminuendos were orchestrated by the hand of some invisible conductor. This co-movement is attributed to the equity market factor. According to factor theory, a factor generates a positive excess return called a premium as reward for the distinct risk it represents.

It is now widely agreed that two factors pervade virtually all markets: value and momentum (size has long been criticized as weak). AQR’s researchers—including some of the leading lights in finance—argue there are two more: carry and defensive. They’ve marshalled data and theoretical arguments that share an uncanny family resemblance with the data and arguments marshalled to justify the size and value factors.

The SPA strategy is a potent distillation of the factor-theoretical approach to investing. If you believe the methods that produced the research demonstrating the value and size effects are sound, then you have to admit that those same tools applied to different data sets may yield more factors that can be harvested.

OK, I’ve blasted you with theory. On to more practical matters.

Who should invest in this fund?

Investors who believe active management can produce market-beating results and are willing to run some unusual but controllable risks.

How much capital should one dedicate to it?

Depends on how much you trust the strategy, the managers, and so on. I personally would invest up to 30% of my personal money in the fund (and may do so soon!), but that’s only because I have a high taste for unconventionality, decades of earnings ahead of me, high conviction in the strategy and people, and a pessimistic view of competing options (other alternatives as well as conventional stocks and bonds). Swedroe, on the other hand, says he has 3% of his portfolio in it.

How should it be assessed?

At a minimum, an alternative has to produce positive excess returns that are uncorrelated to the returns of conventional portfolios to be worthwhile.

However, AQR is making a rather bold claim: It has identified four distinct strategies that produce decent returns on a standalone basis and are both largely uncorrelated with each other and conventional portfolios. When combined and leveraged, the resulting portfolio is expected to produce a much steadier stream of positive returns, also uncorrelated with conventional portfolios.

So far, the strategy is working as advertised. Returns have been good and uncorrelated. In back-tests, the strategy only really suffered during the dot-com bubble and the financial crisis. Even then, returns weren’t horrendous.

Is AQR’s 0.7 Sharpe ratio target reasonable?

I think so, but I would be ecstatic with 0.5.

What are its major risks?

Aside from leverage, counterparty, operational, credit, etc., I worry about a repeat of the quant meltdown of August 2007. It’s thought that a long-short hedge fund suddenly liquidated its positions then. Because many hedge funds dynamically adjust their positions based on recent volatility and returns, the sudden price movements induced by the liquidation set off a self-reinforcing cycle where more and more hedge funds cut the same positions. The stampede to the exits resulted in huge and sudden losses. However, the terror was short-lived. The funds that sold out lost a lot of money; the funds that held onto their positions looked fine by month-end.

AQR is cognizant of this risk and so keeps its holdings liquid and doesn’t go overboard with the leverage. However, it is hard for outsiders to assess whether AQR is doing enough to mitigate this risk. I think they are, because I trust AQR’s people, but I’m well aware that I could be wrong.

Bottom line

One of the best alternative funds available to mutual-fund investors.

Fund website

AQR Style Premia Alternative Fund 

aqrfunds.com

aqr.com

© Mutual Fund Observer, 2015. All rights reserved. The information here reflects publicly available information current at the time of publication. For reprint/e-rights contact us.

TCW/Gargoyle Hedged Value (TFHVX/TFHIX), September 2015

By David Snowball

This fund has been liquidated.

Objective and strategy

TCW/Gargoyle Hedged Value seeks long-term capital appreciation while exposing investors to less risk than broad stock market indices. The strategy is to hold a diversified portfolio mid- to large-cap value stocks, mostly domestic, and to hedge part of the stock market risk by selling a blend of index call options. In theory, the mix will allow investors to enjoy most of the market’s upside while being buffered for a fair chunk of its downside.

Adviser

TCW. TCW, based in Los Angeles, was founded in 1971 as Trust Company of the West. About $140 billion of that are in fixed income assets. The Carlyle Group owns about 60% of the adviser while TCW’s employees own the remainder. They advise 22 TCW funds, as well as nine Metropolitan West funds with a new series of TCW Alternative funds in registration. As of June 30, 2015, the firm had about $180 billion in AUM; of that, $18 billion resides in TCW funds and $76 billion in the mostly fixed-income MetWest funds.

Manager

Joshua B. Parker and Alan Salzbank. Messrs. Parker and Salzbank are the Managing Partners of Gargoyle Investment Advisor, LLC. They were the architects of the combined strategy and managed the hedge fund which became RiverPark/Gargoyle, and now TCW/Gargoyle, and also oversee about a half billion in separate accounts. Mr. Parker, a securities lawyer by training is also an internationally competitive bridge player (Gates, Buffett, Parker…) and there’s some reason to believe that the habits of mind that make for successful bridge play also makes for successful options trading. They both have over three decades of experience and all of the investment folks who support them at Gargoyle have at least 20 years of experience in the industry.

Strategy capacity and closure

The managers estimate that they could manage about $2 billion in the stock portion of the portfolio and a vastly greater sum in the large, liquid options market. TCW appears not to have any clear standards controlling fund closures.

Active share

“Active share” measures the degree to which a fund’s portfolio differs from the holdings of its benchmark portfolio. High active share indicates management which is providing a portfolio that is substantially different from, and independent of, the index. An active share of zero indicates perfect overlap with the index, 100 indicates perfect independence. Gargoyle has calculated the active share of the equity portion of the portfolio but is legally constrained from making that information public. Given the portfolio’s distinctive construction, it’s apt to be reasonably high.

Management’s stake in the fund

As of January 2014, the managers had $5 million invested in the strategy (including $500,000 in this fund). Gargoyle Partners and employees have over $10 million invested in the strategy.

Opening date

The strategy was originally embodied in a hedge fund which launched December 31, 1999. The hedge fund converted to a mutual fund on April 30, 2012. TCW adopted the RiverPark fund on June 26, 2015.

Minimum investment

$5000, reduced to $1000 for retirement accounts. There’s also an institutional share class (TFHIX) with a $1 million minimum and 1.25% expense ratio.

Expense ratio

1.50%, after waivers, on assets of $74.5 million, as of July, 2015.

Comments

Shakespeare was right. Juliet, the world’s most famously confused 13-year-old, decries the harm that a name can do:

‘Tis but thy name that is my enemy;
Thou art thyself, though not a Montague.
What’s Montague? it is nor hand, nor foot,
Nor arm, nor face, nor any other part
Belonging to a man. O, be some other name!
What’s in a name? that which we call a rose
By any other name would smell as sweet;
So Romeo would, were he not Romeo call’d,
Retain that dear perfection which he owes
Without that title.

Her point is clear: people react to the name, no matter how little sense that makes. In many ways, they make the same mistake with this fund. The word “hedged” as the first significant term of the name leads many people to think “low volatility,” “mild-mannered,” “market neutral” or something comparable. Those who understand the fund’s strategy recognize that it isn’t any of those things.

The Gargoyle fund has two components. The fund combines an unleveraged long portfolio and a 50% short portfolio, for a steady market exposure of 50%. The portfolio rebalances between those strategies monthly, but monitors and trades its options portfolio “in real time” throughout the month.

The long portfolio is 80-120 stocks, and stock selection is algorithmic. They screen the 1000 largest US stocks on four valuation criteria (price to book, earnings, cash flow and sales) and then assign a “J score” to each stock based on how its current valuation compares with (1) its historic valuation and (2) its industry peers’ valuation. They then buy the hundred most undervalued stocks, but maintain sector weightings that are close to the S&P 500’s.

The options portfolio is index call options. At base, they’re selling insurance policies to nervous investors. Those policies pay an average premium of 2% per month and rise in value as the market falls. That 2% is a long-term average, during the market panic in the fall of 2008, their options were generating 8% per month in premiums.

Why index calls? Two reasons: (1) they are systematically mispriced, and so they generate more profit (or suffer less of a loss) than they theoretically should. Apparently anxious investors are not as price-sensitive as they should be. In particular, these options are overpriced by about 35 basis points per month 88% of the time. For sellers such as Gargoyle, that means something like a 35 bps free lunch. Moreover, (2) selling calls on their individual stocks – that is, betting that the stocks in their long portfolio will fall – would reduce returns. They believe that their long portfolio is a collection of stocks superior to any index and so they don’t want to hedge away any of their stock-specific upside. By managing their options overlay, the team can react to changes in the extent to which their investors are exposed to the stock markets movements. At base, as they sell more index options, they reduce the degree to which the fund is exposed to the market. Their plan is to keep net market exposure somewhere in the range of 35-65%, with a 50% average and a healthy amount of income.

On whole, the strategy works.

The entire strategy has outperformed the S&P. Since inception, its returns have roughly doubled those of the S&P 500. It’s done so with modestly less volatility.

Throughout, it has sort of clubbed its actively-managed long-short peers. More significantly, it has substantially outperformed the gargantuan Gateway Fund (GATEX). At $7.8 billion, Gateway is – for many institutions and advisors – the automatic go-to fund for an options-hedged portfolio. It’s not clear to me that it should be. Here’s the long-term performance of Gateway (green) versus Gargoyle (blue):

GATEX

Two things stand out: an initial investment in Gargoyle fifteen years ago would have returned more than twice as much as the same investment at the same time in Gateway (or the S&P 500). That outperformance is neither a fluke nor a one-time occurrence: Gargoyle leads Gateway over the past one, three, five, seven and ten-year periods as well.

The second thing that stands out is Gargoyle’s weak performance in the 2008 crash. The fund’s maximum drawdown was 48%, between 10/07 and 03/09. The managers attribute that loss to the nature of the fund’s long portfolio: it buys stocks in badly dented companies when the price of the stock is even lower than the company’s dents would warrant. Unfortunately in the meltdown, those were the stocks people least wanted to own so they got killed. The fund’s discipline kept them from wavering: they stayed 100% invested and rebalanced monthly to buy more of the stocks that were cratering. The payback come in 2009 when they posted a 42% return against the S&P’s 26% and again in 2010 when they made 18% to the index’s 15%.

The managers believe that ’08 was exceptional, and note that the strategy actually made money from 2000-02 when the market suffered from the bursting of the dot-com bubble. Morty Schaja, president of River Park Funds, notes that “We are going to have meltdowns in the future, but it is unlikely that they will play out the same way as it did 2008 . . . a market decline that is substantial but lasts a long time, would play better for Gargoyle that sells 1-2% option premium and therefore has that as a cushion every month as compared to a sudden drop in one quarter where they are more exposed. Similarly, a market decline that experiences movement from growth stocks to value stocks would benefit a Gargoyle, as compared to a 2008.” I concur. Just as the French obsession with avoiding a repeat of WW1 led to the disastrous decision to build the Maginot Line in the 1930s, so an investor’s obsession with avoiding “another ‘08” will lead him badly astray.

What about the ETF option? Josh and Alan anticipate clubbing the emerging bevy of buy-write ETFs. The guys identify two structural advantages they have over an ETF: (1) they buy stocks superior to those in broad indexes, and (2) they manage their options portfolio moment by moment, while the ETF just sits and takes hits for 29 out of 30 days each month.

There’s evidence that they’re right. The ETFs are largely based on the CBOE S&P Buy-Write Index (BXM). Between 2000 and 2012, the S&P 500 returned 24% and the BXM returned 52%; the options portion of the Gargoyle portfolio returned 110% while the long portfolio crushed the S&P.

Nonetheless, investors need to know that returns are lumpy; it’s quite capable of beating the S&P 500 for three or four years in a row, and then trailing it for the next three or four. The fund’s returns are not highly correlated with the returns of the S&P 500; the fund may lose money when the index makes money, and vice versa. That’s true in the short term – it beat the S&P 500 during August’s turbulence but substantially trailed during the quieter July – as well as the long-term. All of that is driven by the fact that this is a fairly aggressive value portfolio. In years when value investing is out of favor and momentum rules the day, the fund will lag.

Bottom line

On average and over time, a value-oriented portfolio works. It outperforms growth-oriented portfolios and generally does so with lower volatility. On average and over time, an options overlay works and an actively-managed one works better. It generates substantial income and effectively buffers market volatility with modest loss of upside potential. There will always be periods, such as the rapidly rising market of the past several years, where their performance is merely solid rather than spectacular. That said, Messrs. Parker and Salzbank have been doing this and doing this well for decades. What’s the role of the fund in a portfolio? For the guys, it’s virtually 100% of their US equity exposure. In talking with investors, they discuss it as a substitute for a large-cap value investment; so if your asset allocation plan is 20% LCV, then you could profitably invest up to 20% of your portfolio in Gargoyle. Indeed, the record suggests “very profitably.”

Fund website

TCW/Gargoyle Hedged Value homepage. If you’re a fan of web video, there’s even a sort of infomercial for Gargoyle on Vimeo but relatively little additional information on the Gargoyle Group website.

Fact Sheet

© Mutual Fund Observer, 2015. All rights reserved. The information here reflects publicly available information current at the time of publication. For reprint/e-rights contact us.

Manning & Napier Pro-Blend Conservative (EXDAX), September 2015

By David Snowball

Objective and strategy

The fund’s first objective is to provide preservation of capital. Its secondary concerns are to provide income and long-term growth of capital. The fund invests primarily in fixed-income securities. It tilts toward shorter-term, investment grade issues while having the ability to go elsewhere when the opportunities are compelling. It also invests in foreign and domestic stocks, with a preference for dividend-paying equities. Finally, it may invest a bit in a managed futures strategy as a hedge. In general, though, bonds are 55-85% of the portfolio. In the past five years, stocks have accounted for 25-35% of the portfolio though they might be about 10% higher or lower if conditions warrant.

Adviser

Manning & Napier. Manning & Napier was founded in 1970 by Bill Manning and Bill Napier. They’re headquartered near Rochester, NY, with offices in Columbus, OH, Chicago and St. Petersburg. They serve a diversified client base of high-net-worth individuals and institutions, including 401(k) plans, pension plans, Taft-Hartley plans, endowments and foundations. It’s a publicly-traded company (symbol: MN) with $43 billion in assets under management. Of that, about $18 billion are in their team-managed mutual funds and the remainder in a series of separately-managed accounts.

Manager

The fund is managed by a seven-person team, headed by Jeffrey Herrmann and Marc Tommasi. Both of them have been with the fund since its launch. The same team manages all of Manning & Napier’s Pro-Blend and Target Date funds.

Management’s stake in the fund

We generally look for funds where the managers have placed a lot of their own money to work beside yours.  The managers work as a team on about 10 funds. While few of them have any investment in this particular fund, virtually all have large investments between the various Pro-Blend and Lifestyle funds.

Opening date

November 1, 1995.

Minimum investment

$2,000. That is reduced to $25 if you sign up for an automatic monthly investing plan.

Expense ratio

0.88% on $384.1 million in assets, as of July 2023.

Comments

Pro-Blend Conservative offers many of the same attractions as Vanguard STAR (VGSTX) but does so with a more conservative asset allocation. Here are three arguments on its behalf.

First, the fund invests in a way that is broadly diversified and pretty conservative. The portfolio holds something like 200 stocks and 500 bonds, plus a few dozen other holdings. Collectively those represent perhaps 25 different asset classes. No stock position occupies as much as 1% of the portfolio and it currently has much less direct foreign investment than its peers.

Second, Manning & Napier is very good. The firm does lots of things right, and they’ve been doing it right for a long while. Their funds are all team-managed, which tends to produce more consistent, risk-conscious decisions. Their staff’s bonuses are tied to the firm’s goal of absolute returns, so if investors lose money, the analysts suffer, too. The management teams are long-tenured – as with this fund, 20 year stints are not uncommon – and most managers have substantial investments alongside yours.

Third, Pro-Blend Conservative works. Their strategy is to make money by not losing money. That helps explain a paradoxical finding: they might make only half as much as the stock market in a good year but they managed to outperform the stock market over the past 15. Why? Because they haven’t had to dig themselves out of deep holes first. The longer a bull market goes on, the less obvious that advantage is. But once the market turns choppy, it reasserts itself.

At the same time, the fund has the ability to become more aggressive when conditions warrant.  It just does so carefully. Chris Petrosino, one of the Managing Directors at Manning, explained it this way:

We have the ability to be more aggressive. For us, that’s based on current market conditions, fundamentals, pricing and valuations. It may appear contrarian, but valuations dictate our actions. We use those valuations that we see in various asset classes (not only in equities), as our road map. We use our flexibility to invest where we see opportunities, which means that our portfolio often looks very different than the benchmark.

Bottom Line

Pro-Blend Conservative has been a fine performer since launch. It has returned over 6% since launch and 5.4% annually over the past 15 years. That’s about 1% per year better than either the Total Stock Market or its conservative peers. In general, the fund has managed to make between 4-5% each year; more importantly, it has made money for its investors in 19 of the past 20 years. It is an outstanding first choice for cautious investors.

Fund website

Manning & Napier Pro-Blend Conservative homepage. 

Fact Sheet

© Mutual Fund Observer, 2015. All rights reserved. The information here reflects publicly available information current at the time of publication. For reprint/e-rights contact us.

September 2015, Funds in Registration

By David Snowball

American Beacon Bridgeway Large Cap Growth Fund

American Beacon Bridgeway Large Cap Growth Fund will seek long-term total return on capital, primarily through capital appreciation.  Bridgeway is selling their LCG fund to American Beacon, pending shareholder approval. The fund will still be managed by John Montgomery and the Bridgeway team. The initial expense ratio will be 1.20%, rather above the current Bridgeway charge. The minimum initial investment is $2500. 

Aristotle Small Cap Equity Fund

Aristotle Small Cap Equity Fund will seek long-term capital appreciation by investing in high quality, small cap businesses that are undervalued. The fund will be managed by David Adams and Jack McPherson. The initial expense ratio will be 1.15%. The minimum initial investment is $2,500.

Aristotle Value Equity Fund

Aristotle Value Equity Fund will seek long-term capital appreciation by investing mostly in undervalued mid- and large-cap stocks. The fund will be managed by Howard Gleicher, Aristotle’s CIO. The initial expense ratio will be 0.68%. The minimum initial investment is $2,500.

Aston/River Road Focused Absolute Value Fund

Aston/River Road Focused Absolute Value Fund will seek long-term capital appreciation. The plan is to deploy that “proprietary Absolute Value® approach,” in hopes of providing “attractive, sustainable, low volatility returns over the long term.”  The fund will be managed by Andrew Beck, River Road’s CEO, and Thomas Forsha, their co-CIO. The initial expense ratio will be 1.26%. The minimum initial investment is $2,500, reduced to $500 for various sorts of tax-advantaged accounts..

Brown Advisory Equity Long/Short Fund

Brown Advisory Equity Long/Short Fund will seek to provide long-term capital appreciation by combining both “long” and “short” equity strategies. The plan is pretty straight forward: go long on securities with “few or no undesirable traits” and short the ugly ones. They have the option of using a wide variety of instruments (direct purchase, ETFs, futures and so on) to achieve that exposure. The fund will be managed by Paul Chew, Brown Advisory’s CIO and former manager of the Growth Equity fund. The initial expense ratio will be 2.24% for Investor shares and 2.49% for Advisor shares. The minimum initial investment is $5,000 for Investor shares and $2000 for Advisor shares, which are designed to be purchased through places like Scottrade. .

Dana Small Cap Equity Fund

Dana Small Cap Equity Fund will seek long-term growth. The plan is to create a risk-managed portfolio by using a sector-neutral, relative-value, equal-weight discipline. The large cap version of the strategy has been around for five years and has been perfectly respectable if not particularly distinguished for good or ill. The fund will be managed by a team from Dana Investment Advisers. The initial expense ratio will be 1.20%. The minimum initial investment is $1,000.

Driehaus Turnaround Opportunities Fund

Driehaus Turnaround Opportunities Fund will seek to maximize capital appreciation, while minimizing the risk of permanent capital impairment, over full-economic cycles.. The plan is to invest in the equity and debt securities of “distressed, stressed and leveraged companies,” on the popular premise that they’re widely misunderstood and their securities are often incorrectly priced. The fund will be managed by Elizabeth Cassidy and Thomas McCauley of Driehaus. The initial expense ratio has not been released. The minimum initial investment is $10,000 for retail accounts, reduced to $2000 for retirement accounts.

Ensemble Fund

Ensemble Fund will seek long term capital appreciation. The plan is to identify 15-25 high quality companies with undervalued stock, then buy some. The fund will be managed by Sean Stannard-Stockton, Ensemble’s president and CIO. The initial expense ratio will be 2.0%. The minimum initial investment is $5,000, reduced to $1000 for IRAs and accounts established with an automatic investment plan.

FFI Diversified US Equity Fund

FFI Diversified US Equity Fund will seek long-term capital growth. The plan is to invest in 40-50 U.S. stocks, with a target portfolio market cap of $20 billion. The fund will be managed by a team from FormulaFolio Investments, led by CIO James Wenk. The initial expense ratio will be a stout 2.25%. The prospectus doesn’t offer any immediate evidence that the guys will overcome a high expense ratio in such a competitive slice of the market. The minimum initial investment is $2,000, reduced to $1,000 for retirement accounts and those established with an automatic investing plan.

Gripman Absolute Value Balanced Fund

Gripman Absolute Value Balanced Fund will seek long-term total return and income. The plan is to pursue a conservative asset allocation on the order of 30% equity/70% intermediate-term fixed income. A sliver might be in junk bonds. The fund will be managed by Timothy W. Bond. The initial expense ratio hasn’t been announced. The minimum initial investment is $2,000.

Harbor Diversified International All Cap Fund

Harbor Diversified International All Cap Fund  will seek long-term growth of capital. The plan is to invest mostly in cyclical companies, which you typically buy when they look absolutely ghastly and sell as soon as they start looking decent. The fund will be managed by a very large team led by William J. Arah from Marathon Asset Management, a London-based adviser. Mr. Arah founded Marathon, which also serves as sub-advisor to Vanguard Global Equity. The initial expense ratio will be 1.22%. The minimum initial investment is $2,500.

Iron Equity Premium Income Fund

Iron Equity Premium Income Fund will seek to provide superior risk-adjusted total returns relative to the CBOE S&P 500 BuyWrite Index (BXM). The plan is to buy ETFs which track the S&P 500 while writing call options to generate income. The fund will be managed by a team from IRON Financial. The initial expense ratio will be 1.45%. The minimum initial investment is $10,000.

Preserver Alternative Opportunities Fund

Preserver Alternative Opportunities Fund will seek high total returns with low volatility. The plan is to hire sub-advisers to do pretty typical liquid alts stuff in the portfolio. The subs have not yet been named, though. The initial expense ratio will be 2.43%. The minimum initial investment is $2,000.

Quantified Self-Adjusting Trend Following Fund

Quantified Self-Adjusting Trend Following Fund (really? It feels like they consulted with Willy Wonka to select their name.)  will seek “high appreciation on an annual basis consistent with a high tolerance for risk.” Do you suppose it’s really seeking a high tolerance for risk, or merely requires that prospective investors have a high tolerance?  The plan is to determine the market’s trend, then invest in ETFs, leveraged ETFs or inverse ETFs. If there’s no discernible trend, they’ll invest in bonds. The fund will be managed by Jerry Wagner, President of the Flexible Plan Investments, and Dr. Z. George Yang, their director of research. The initial expense ratio will be 1.75%. The minimum initial investment is $10,000.

T. Rowe Price Mid-Cap Index Fund

T. Rowe Price Mid-Cap Index Fund will seek to match the performance of the Russell Select Midcap Completion Index, with a correlation of at least 0.95. The fund will be managed by Ken D. Uematsu. The initial expense ratio will be 0.32%.

T. Rowe Price Small-Cap Index Fund

T. Rowe Price Small-Cap Index Fund will seek to match the performance of the Russell 2000®Index with a correlation of at least 0.95. The fund will be managed by Ken D. Uematsu. The initial expense ratio will be 0.34%.

Vanguard STAR (VGSTX), August 2015

By David Snowball

Objective and strategy

This fund of funds seeks to provide long-term capital appreciation and income. As a fund of funds, Vanguard STAR invests in other Vanguard mutual funds.  It places 60% to 70% of its assets in common stocks through eight stock funds; 20% to 30% of its assets in bonds through two bond funds; and 10% to 20% of its assets in short-term investments through a short-term bond fund. The stock funds emphasize larger, well-established companies and the bond funds focus on securities issued by highly-rated borrowers. Vanguard calls it their “one fund option for investors looking for broad diversification across asset classes who can tolerate moderate market risk that comes from the volatility of the stock and bond markets.”

Adviser

The Vanguard Group, Inc. The Japanese bestow the designation “Living National Treasure” on individuals of incomparable skill who work to preserve precious elements of the culture. If the US had such as designation, Vanguard founder Jack Bogle would certainly qualify for it. He founded Vanguard in May, 1975 as the industry’s only non-profit, investor-owned fund complex; in the succeeding decades he has been consistently, successfully critical of marketing-driven investing fads and high expenses. Vanguard advertises “at cost” investing and their investor expenses are consistently the industry’s lowest. They advise 160 U.S. funds (including variable annuity portfolios) and about 120 funds for non-U.S. investors. In total they have 20 million investors and are responsible for more than $3 trillion in assets.

Managers

Michael Buek, William Coleman and Walter Nejman. The guys are mostly responsible for which of the portfolio’s funds get a bit more money and which get a bit less. The list of which funds they use hasn’t changed since 2001 and the fund’s asset allocation wobbles just a little. Their responsibilities are so administrative that from 1985 to 2009, the fund listed itself as having “no manager.”

Management’s stake in the fund

In general, you should look for funds whose managers invest a lot of their own money alongside your money. In this case, the managers have almost no investment in the fund but that’s not very important since their responsibilities are so limited.

Opening date

March 29, 1985

Minimum investment

$1,000. While Vanguard offers an automatic investing plan option, they don’t reduce the minimum for such accounts. That said, the STAR minimum is one-third of what Vanguard normally expects and the monthly minimum once you’ve opened an account is $1.

Expense ratio

0.34% on assets of $22.7 billion, as of July 2023.

Comments

Why invest in Vanguard STAR? There are three reasons to consider it.

First, the fund invests in a way that is broadly diversified and reasonably cautious. 60-70% of its money is invested in stocks, 20-30% in bonds and 10-20% in conservative short-term investments. Its stock portfolio mostly focuses on large, well-established companies and it gives you more exposure to the world beyond the U.S. than most of its peers do. International stocks constitute 21% of the portfolio but are only 13% for its average peer. That means investors are being given access to some additional sources of gain that most comparable funds skip.

Second, Vanguard is very good. There are two sorts of funds, those which simply buy all of the stocks or bonds in a particular index without trying to judge whether they’re good or bad (these are called “passive” funds) and those whose managers try to invest in only the best stocks or bonds (called “active” funds). Vanguard typically hires outside firms to manage their active funds and they do a very good job of finding and overseeing good managers. Vanguard and its funds operate with far lower expenses than its peers, on average, 0.19% per year for funds investing primarily in U.S. stocks. Even Vanguard’s most expensive funds charge less than half as much as their industry peers. Every dollar not spent on running the fund is a dollar that remains in your account.

Third, STAR is the most accessible way to build a Vanguard portfolio. STAR builds its portfolio around 11 actively-managed Vanguard funds.  They are:

  Which invests primarily in …
Windsor II Large U.S. companies whose stock is temporarily out of favor
Windsor The same sorts of stocks as Windsor II, but somewhat more aggressively
U.S. Growth well-known blue-chip stocks
Morgan Growth large- and mid-sized U.S. companies
PRIMECAP large- and mid-sized fast growing U.S. companies
International Growth non-U.S. companies with high growth potential
International Value non-U.S. companies from developed and emerging markets around the world that are temporarily undervalued
Explorer small U.S. companies with growth potential
Long-Term Investment-Grade medium-and high-quality investment-grade corporate bonds
GNMA GNMA is a government-owned corporation that backs mortgage loans made by the Veterans Administration and Federal Housing Authority; this fund invests in government mortgage-backed securities issued by GNMA.
Short-Term Investment-Grade Bond high- and medium-quality, investment-grade bonds with short-term maturities.

If you wanted to buy that same collection of funds one-by-one, you’d need to have $33,000 to invest. Dan Wiener, publisher of the well-respected Independent Advisor for Vanguard Investors newsletter, suggests eight funds in a model portfolio akin to STAR. That would require $24,000 upfront and you’d have to deal with the fact that PRIMECAP is no longer accepting new investors.

Bottom Line

STAR has been around for 30 years and has been a quiet, reliable performer. Its portfolio represents a cautious approach to some investment types (for example, stocks in the emerging markets) that its peers mostly avoid. Coupled with its substantial cost advantage over its peers, STAR has been able to outperform three-quarters of its peers. It has returned about 7% per year over the past decade, about 1% per year above the competition, but has been a little less risky. It’s a great all-around fund designed to do well year after year rather than post eye-popping returns over the short term.

Fund website

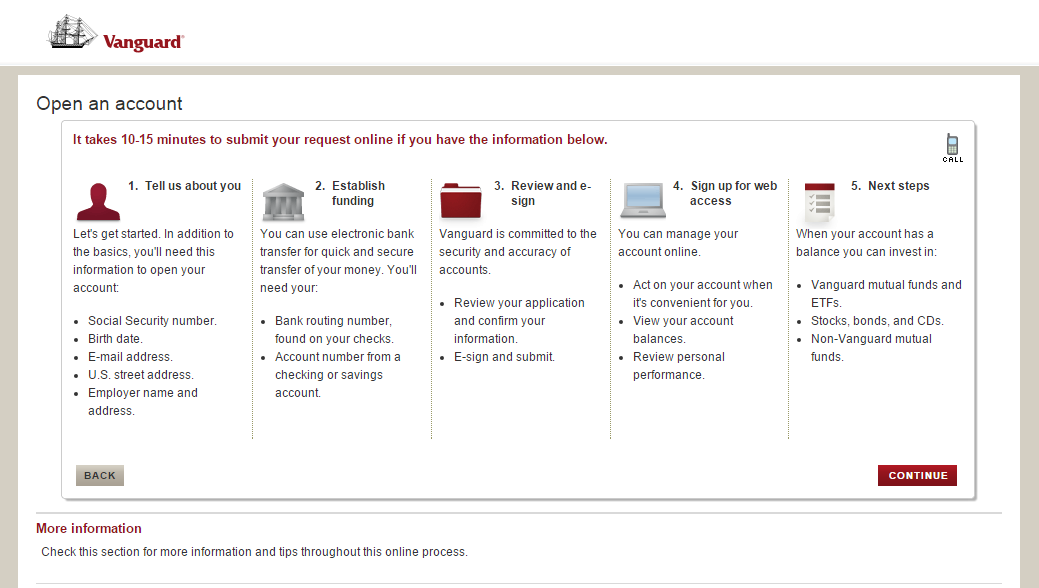
Vanguard STAR profile. You can keep track of your account by downloading the Vanguard app which works with iPhones, Android and Kindle. When you go to Vanguard’s “invest with us” page, here’s what you’ll see:

vanguard account

So you’ll need just seven pieces of information (eight if you include “your name”) to get started. When you’re asked what you’d like done with your dividends and capital gains, choose “reinvest them” so that the money stays in your account and keeps growing. Otherwise you’ll get them deducted from your account and mailed to you as a check.

© Mutual Fund Observer, 2015. All rights reserved. The information here reflects publicly available information current at the time of publication. For reprint/e-rights contact us.

TIAA-CREF Lifestyle Conservative (TSCLX), August 2015

By David Snowball

Objective and strategy

The fund seeks long-term total return, consisting of both current income and capital appreciation. It is a “fund of funds” that invests in the low-cost Institutional Class shares of other TIAA-CREF funds. It is designed for investors targeting a conservative risk-return profile. In general, 40% of the fund’s assets are invested in stocks and 60% in bonds. The managers can change those allocations by as much as 10% up or down depending upon current market conditions and outlook.

Adviser

TIAA-CREF. It stands for “Teachers Insurance and Annuity Association – College Retirement Equities Fund,” which tells you a lot about them. They were founded in 1918 to help secure the retirements of college teachers; their original backers were Andrew Carnegie and his Carnegie Foundation. Their mission eventually broadened to serving people who work in the academic, research, medical and cultural fields. More recently, their funds became available to the general public. TIAA-CREF manages almost $900 billion dollars for its five million investors. Because so much of their business is with highly-educated professionals concerned about their retirement, TIAA-CREF focuses on fundamentally sound strategies with little trendiness or flash and on keeping expenses as lower as possible. 70% of their investment products have earned four- or five-star ratings from Morningstar and the company is consistently rated as one of America’s best employers.

Manager

John Cunniff and Hans Erickson, who have managed the fund since its inception.

Management’s stake in the fund

We generally look for funds where the managers have placed a lot of their own money to work beside yours. Mssrs. Cunniff and Erickson each have $500,001 – $1,000,000 invested in the fund, which qualifies as “a lot.”

Opening date

December 9, 2011. Many of the funds in which the managers invest are much older than that.

Minimum investment

$2,500. That is reduced to $100 if you sign up for an automatic investing plan.

Expense ratio

0.76% on $310 million in assets, as of July 2023. 

Comments

Lifestyle Conservative offers many of the same attractions as Vanguard STAR (VGSTX) but does so with a more conservative asset allocation. Here are three arguments on its behalf.

First, the fund invests in a way that is broadly diversified and pretty conservative. 40% of its money is invested in stocks, 40% in high-quality bonds and the last 20% in short-term bonds. That’s admirably cautious. They then take measured risks within their various investments (for example, their stock portfolio is more tilted toward international stocks and emerging markets stocks than are their peers) to help boost returns.

Second, TIAA-CREF is very good. There are two sorts of funds, those which simply buy all of the stocks or bonds in a particular index without trying to judge whether they’re good or bad (these are called “passive” funds) and those whose managers try to invest in only the best stocks or bonds (called “active” funds). TSCLX invests in a mix of the two with active funds receiving about 90% of the cash. CREF’s management teams tend to be pretty stable (the average tenure is close to nine years); most managers handle just one or two funds and most invest heavily (north of $100,000 per manager per fund) in their funds. CREF and its funds operate with far lower expenses than its peers, on average, 0.43% per year for funds investing primarily in U.S. stocks. Even their most expensive fund charges 40% less than their industry peers. Every dollar not spent on running the fund is a dollar that remains in your account.

Third, Lifestyle Conservative is a very easy way to build a very well-diversified portfolio.  Lifestyle Conservative builds its portfolio around 15 actively-managed and three passively-managed TIAA-CREF funds.  They are:

  Which invests in
Large-Cap Growth   large companies in new and emerging areas of the economy that appear poised for growth
Large-Cap Value   Large companies, mostly in the US, whose stock is undervalued based on an evaluation of their potential worth
Enhanced Large-Cap Growth Index   Quantitative models try to help it put extra money into the most attractive stocks in the US Large Cap Growth index; it tries to sort of “tilt” a traditional index
Enhanced Large-Cap Value Index   Quantitative models try to help it put extra money into the most attractive stocks in the US Large Cap Value index
Mid-Cap Growth   Medium-sized US companies with strong earnings growth
Mid-Cap Value   Temporarily undervalued mid-sized companies
Growth & Income   Large US companies which are paying healthy dividends or buying back their stock
Small-Cap Equity   smaller domestic companies across a wide range of sectors, growth rates and valuations
International Equity   Stocks of stable and growing non-US companies
International Opportunities   Stocks of foreign firms that might have great potential but a limited track record
Emerging Markets Equity   Stocks of firms located in emerging markets such as India and China
Enhanced International Equity Index Quantitative models try to help it put extra money into the most attractive stocks in the International Equity index
Global Natural Resources   Firms around the world involved in energy, metals, agriculture and other commodities
Bond   High quality US bonds
Bond Plus   70% investment grade bonds and 30% spicier fare, such as emerging markets bonds or high-yield debt
High-Yield   Mostly somewhat riskier, higher-yielding bonds for US and foreign corporations
Short-Term Bond   Short-term, investment grade US government and corporate bonds
Money Market   Ultra-safe, lower-returning CDs and such

Bottom Line

Lifestyle Conservative has been a fine performer since launch. It has returned 7.5% annually over the past three years. That’s about 2% per year better than average, which places it in the top 20% of all conservative hybrid funds. While it trails more venturesome funds such as Vanguard STAR in good markets, it holds up substantially better than they do in falling markets.  That combination led Morningstar to award it four stars, their second-highest rating.

Fund website

TIAA-CREF Lifestyle Conservative homepage there is also another website from which you can download the fact sheet which gives you updated information on what the fund has been investing in and how it’s doing. From there it’s easy to open a mutual fund account and set up your AIP.

If you’ve got an iPhone, you can manage your account with their TIAA-CREF Savings Simplifier app. If instead, you sport an Android device (all the cool kids do!), head over to the Play store and check out the TIAA-CREF app there. It doesn’t offer all the functionality of the iOS app, but it does come with much higher customer ratings.

© Mutual Fund Observer, 2015. All rights reserved. The information here reflects publicly available information current at the time of publication. For reprint/e-rights contact us.

Eventide Healthcare & Life Sciences Fund (ETNHX), August 2015

By David Snowball

Objective and strategy

The Eventide Healthcare & Life Sciences Fund seeks to provide long-term capital appreciation. The manager selects equity and equity-related securities of firms in the healthcare and life sciences sectors. The manager’s valuation standards aren’t spelled out, except to say that he’s looking for “attractively valued securities.” The advisor imposes a set of ESG screens so that it limits itself to firms that “operate with integrity and create value for customers, employees, and other stakeholders,” which includes its immediate community and the broader society. Some of the firms in which it invests, especially in the biotech sector, are “development stage companies,” which implies that their stock is illiquid and potentially very volatile. Up to 15% of the portfolio might be invested in such securities. At the same time, up to 10% can be invested in derivatives that help hedge the portfolio.

Adviser

Eventide Asset Management, LLC. Founded in 2008, Eventide is a Boston-based adviser that specializes in faith-based and socially responsible investing. They manage more than $2 billion in assets through their two (and soon to be three) mutual funds.

Manager

Finny Kuruvilla. Dr. Kuruvilla has been a busy bee. In addition to managing the Eventide funds, he’s a Principal with Clarus Ventures, a health care venture capital firm with $1.7 billion in assets. In that role, he sits on several corporate boards. He has earned an MD from Harvard Medical School, a PhD in Chemistry and Chemical Biology from Harvard, a master’s in Electrical Engineering and Computer Science from MIT, and a bachelor’s degree from Caltech in Chemistry. Somewhere in there he completed medical residencies at two major Boston hospitals and served as a research fellow at MIT. He completed his residency and fellowship at the Brigham & Women’s Hospital and Children’s Hospital Boston where he cared for adult and pediatric patients suffering from a variety of hematologic, oncologic, and autoimmune disorders. Subsequently, he was a research fellow at MIT where he did incredibly complicated statistical stuff. He’s coauthored 15 peer-reviewed articles in science journals and also manages Eventide Gilead Fund.

Strategy capacity and closure

“Strategy capacity” refers to the amount of money that a manager believes he or she can handle without compromising the strategy’s prospects. Sometimes the limitation is imposed by the nature of the strategy (microcap strategies can handle less money than megacap ones) and sometimes by the limits of the investment team’s time and attention. In general, managers who can articulate the limits of their strategy and have thought through how they’ll handle excess inflows do better in the long run than those you make it up as they go. The Eventide managers report that “Eventide has not discussed closing the fund and is not expecting capacity issues until the fund gets to about $2 billion in AUM.”

Active share

Unknown.  “Active share” measures the degree to which a fund’s portfolio differs from the holdings of its benchmark portfolio. High active share indicates management which is providing a portfolio that is substantially different from, and independent of, the index. An active share of zero indicates perfect overlap with the index, 100 indicates perfect independence.  The fund’s active share hasn’t been calculated, though its low correlation with its benchmark suggests a fairly active approach.

Management’s stake in the fund

Dr. Kuruvilla has invested under $100,000 in this fund and between $100,001-$500,000 across his two funds. None of the fund’s independent trustees have any investment in the Eventide funds. As of October 1, 2014, the officers and Trustees collectively owned less than 1% of the fund shares; that translates to less than $200,000.

Opening date

December 27, 2012

Minimum investment

$1,000 for a regular account, $1,000 for an IRA account, or $100 for an automatic investment plan account.

Expense ratio

For class A shares: 1.56%, class C shares: 2.31%, class I shares: 1.31%, and class N shares: 1.51% on assets of $1.8 Billion, as of July 2023. There is a 1% redemption fee for shares held fewer than 180 days.

Comments

The argument for Eventide Healthcare is pretty straightforward: it’s the hottest fund in the hottest sector of the U.S. economy and it’s led by a manager with an unparalleled breadth of training and experience.

The Wall Street Journal’s mid-year report on the mutual funds with the best 10-year performance offered the following list of specialties:

  1. Biotech
  2. Biotech
  3. Health sciences
  4. Pharmaceuticals
  5. Biotech
  6. Biotech
  7. Biotech
  8. Health sciences
  9. Biotech
  10. 2x leveraged NASDAQ

Those funds earned an average of 19% per year. At the same time, the Total Stock Market Index clocked in at 8% per year.

And so far in its short life, Eventide Healthcare is among the field’s strongest performers. It has, since inception, handily beaten both the field and the field’s two most-respected funds, Vanguard Health Care (VGHCX, the only fund endorsed by Morningstar analysts) and T. Rowe Price Health Sciences (PRHSX).  Here are the returns on a hypothetical $10,000 investment made on the day Eventide launched in December 2012:

Eventide HealthCare 26,990
T. Rowe Price Health Sciences 24,750
Health care peer group 22,750
Vanguard Health Care 21,440

In 2015, through the end of July, Eventide has returned 28.6% – 9% better than the average healthcare fund and 25% above the broad stock market. Despite those soaring returns, Mr. Kuruvilla concludes that the key biotech “sector is significantly less overvalued than the S&P 500 as a whole. While individual biotech companies may indeed be overvalued, we see no reason to believe that overvaluation is endemic in the sector.”

Much of the credit belongs to its manager, Finny Kuruvilla. His academic accomplishments are formidable. As I note above, Dr. Kuruvilla has an MD and a PhD in chemical biology (both from Harvard) and a master’s degree in engineering and computer science (from MIT). His professional investing career includes both the Eventide fund and a venture capital fund. That second tier of experience is important, since VC funds tend both to be far more activist – that is, far more intimately involved in the development of their charges – than mutual funds and to focus on a distinct set of early stage firms whose prospects might explode. About 70% of the Eventide fund is invested in biotech stocks and 40% in microcaps; most of the remainder are small cap firms.

The other investor with a similar range of expertise was Kris Jenner, the now-departed manager of T. Rowe Price Health Sciences. Mr. Jenner managed to leverage his deep academic and professional knowledge of the growing edge of the healthcare universe – biotech firms, among others – into the third best 10-year record among the 7000 funds that Morningstar tracks.

That said, prospective investors need to attend to four red flags:

  1. The manager has two masters. Mr. Kuruvilla is a principal at Clarus Ventures, a healthcare venture capital firm with $1.7 billion in assets. He’s managed investments for both firms since 2008. That might raise two concerns. The first is whether he’s able to juggle both sets of obligations, especially as assets grow. The second is how he handles potential conflicts of interest between his two charges. If, for example, he discovers a fascinating illiquid security, he might need to choose whether to invest for the benefit of his Clarus shareholders or his Eventide ones.

    Eventide’s conflict-of-interest policy addresses his role at Clarus, but mostly concerning how he will deal with non-public information and trading in his personal accouts, not how he would deal with potential conflicts between the needs of the two funds.

  2. Asset growth might impair the strategy. The fund is attracting steadily inflows. It has grown from $40 million at the end of 2013 to $150 million at the end of 2014 to $300 million at the start of July, 2015. By the end of July, they’d reached $350 million. For a fund whose success is driven by its ability to find and fund firms in “the smallcap biotech space,” 40% of which are microcaps and some of whom are privately traded and illiquid, sustained asset growth is a real concern. Sadly that growth has not yet translated into low expenses; it is the third most-expensive of the 31 health care funds.

  3. The question of volatility needs to be addressed. Despite its ability to hedge volatility, the fund declined by almost 20% in the late spring and early summer, 2014. Its peers dropped 7.4% in the same period. Since inception, its downside deviation and Ulcer Index, a measure that combines the magnitude and duration of a drawdown, are two to three times higher than its peers.

    The managers are aware of the issue, but consider it to be part of the price of admission. David Barksdale, co-portfolio manager on the Gilead fund and managing partner of Eventide, writes:  

    A draw-down like that in early 2014 for the Healthcare fund should be considered normal for the fund. There was a pullback in biotech stocks at that time and these are a regular feature of the industry. Although individual biotech companies tend to be uncorrelated on their fundamentals, investors tend to trade their stocks as a group via ETF’s or otherwise and investor sentiment changes can precipitate these kinds of draw-downs.

    He reports that “we generally see these drawdowns at least once a year.” The ability to exploit the market’s excessive reactions are an essential part of generating outsized gains (“We tend to keep some cash on hand in the fund to be able to take advantage of these pullbacks as buying opportunities.”) but they may prove difficult for some investors to ride through.

  4. The quality of shareholder communications is surprisingly low. Communication between the manager and retail shareholders is limited to a three page letter, covering both funds, in the Annual Report. The semi-annual report contains no text and there are no shareholder letters. There are quarterly conference calls but those are limited to financial advisers; copies are password protected. The adviser does maintain a rich archive of the managers’ media appearances.

Bottom Line

Eventide Healthcare and Life Sciences has a fascinating pedigree and a outstanding early record. Mr. Kuruvilla has the breadth of experience at training – both academic and professional – to give him a distinct and sustained competitive advantage over his peers. That said, enough questions persist that investors need to approach the fund cautiously, if at all.

Fund website

Eventide Healthcare and Life Sciences

© Mutual Fund Observer, 2015. All rights reserved. The information here reflects publicly available information current at the time of publication. For reprint/e-rights contact us.

James Balanced Golden Rainbow Fund (GLRBX/GLRIX), August 2015

By Charles Boccadoro

Objective and Strategy

The James Balanced Golden Rainbow Fund (GLRBX/GLRIX) seeks to provide total return through a combination of growth and income and preservation of capital in declining markets.

Under normal circumstances, the diversified James Balanced Golden Rainbow Fund invests primarily in undervalued domestic equities of companies with various market capitalizations and in high-quality (S&P’s rating of BBB or better) fixed income securities of various durations. At end of June 2015, the fund was 55% equity, 42% fixed income, and 3% cash equivalent. Median market cap was $7.6B (mid-cap, but with average about $15B) and average bond duration was 4.3 years.

The fund will normally hold both equity securities and fixed income securities, with at least 25% of its assets in equity and at least 25% of its assets in fixed income. Its broad, go-anywhere (if long only) charter enables it to go to 100% cash equivalents for short periods or even 50% for longer periods, although the adviser usually finds better opportunities than cash. It will hold foreign equities, currently just a couple percent, but probably never more than 10% and usually in form of ETFs or ADRs. Similarly, it can hold sovereign debt.

GLRBX’s allocation closely echoes the simple philosophy championed by Ben Graham in the Intelligent Investor and similarly touted by famed investors Harry Markowitz and John Bogle. Nominally 50/50 equity/fixed allocation, but then tailored based on investor temperament and/or market assessment, but never less than 25% in either. GLRBX targets defensively minded long-term investors.

Here’s a look back at the fund’s allocation since inception, which rarely deviates more than about 10% from the 50/50 split:
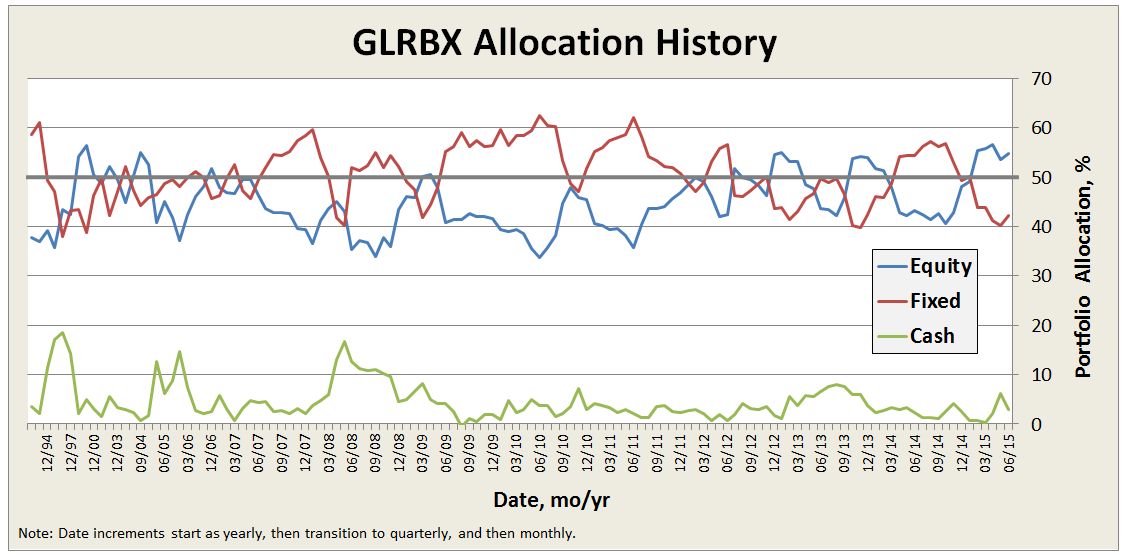
James_1

The fund attempts to provide total return in excess of the rate of inflation over the long term (3 to 5 years).

Adviser

James Investment Research (JIR), Inc. is the fund’s adviser. Dr. Francis E. James is the controlling share-holder. In 1972, he and his wife, Iris, started JIR in the bedroom of their son, David, with only $20K AUM. Their lofty goal was to garner $10M from family, friends and business relationships, which they considered the threshold AUM to enable purchasing a computer.

A spokesman for the firm explains that marketing has never been the main focus: “It has always been doing research, taking care of our clients and managing their funds wisely.” Fortunately, performance of the early fund (a precursor to GLRBX that was a comingled trust fund managed by Dr. James for Citizen’s Federal Savings and Loan) was satisfactory and the conservative nature of the investments attracted investors. It grew to about $100 million in size in 1983. The name “Golden Rainbow” comes from the original S&L’s logo.

Today the firm manages $6.5B for individuals, businesses, and endowments, as shown below. The preponderance is in GLRBX. It is a conservative allocation fund with $4.2B AUM, established formally in 1991. It is the firm’s oldest fund and flagship. JIR advises five other mutual funds “to provide diversification in our James Advantage Funds (aka James Funds) family.” These other funds appear to be offered to more aggressive investors for at least part of their portfolios, as capital preservation in declining markets is a secondary goal.
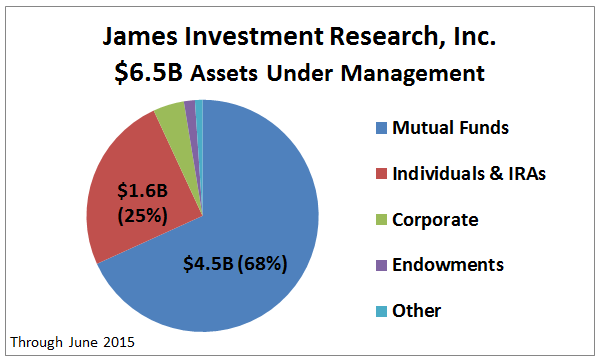
James_2

The firm has 19 full-time employees and two part-time. Since 1978, JIR practices profit sharing with its employees. “Cash profits shared last year were in excess of 45%, not including pension contributions.”

James maintains a PO Box in Alpha, Ohio, but is actually located in nearby Xenia, which is about 10 miles east of Dayton, near Wright Patterson Air Force Base, Wright Brother’s Memorial, and Wright State University. “It is a quiet place to do research and it is far from Wall Street. We don’t tend to follow the herd and we can keep our independent approach a little easier than in a big city. We operate on 35 acres in the woods, and it helps to keep stress levels lower and hopefully helps us make wiser decisions for our clients.”

Managers

GLRBX is managed by a 9 member investment committee.  Average tenure is over 20 years with the firm. Three are James’ family members: founder Dr. Frank James, CEO Barry James, and Head of Research David James. The committee makes the determination of allocation, stocks approved for purchase or sale, and bond duration. Day to day, any member handles implementation of the committee’s guidance. Nominally the fund is managed by a nine-person team, but day-to-day responsibility falls to Brian Culpepper (since 1998), Brian Sheperdson (since 2001), Trent Dysert (since 2014) and Moustapha Mounah (since 2022).

Dr. James is 83 years old. He served in the Air Force for 23 years, achieving the rank of Colonel and headed the Department of Quantitative Studies at the Air Force Institute of Technology. He received his Ph.D. from RPI where his thesis was “The Implications of Trend Persistency in Portfolio Management,” which challenged the idea that stocks move at random and formed the basis for technical analysis still employed by the firm today. Basically, he observed that stock price movements are not random and trends persist. He remains engaged with the firm, does research, and provides mentoring to the team on a regular basis.

Barry James also served as a pilot in the Air Force, receiving degrees from both Air Force Academy and Boston University, returning full time to James in 1986. All other members of the investment team have at least one degree from colleges or universities located in Ohio, except David James who holds no formal degree, but is a CFA.

Strategy capacity and closure

GLRBX has never closed. The firm believes capacity is $10-15B, based on its studies of expected performance and trading limitations. So, plenty of capacity remaining. That said: “We think having controlled growth is the key to being able to sustain performance. We aren’t trying to become the biggest because we don’t want to sacrifice the current client and their results just to add another dollar to the fund. At the same time, we believe we have something that many folks want and need and we don’t want to turn them away if we can help them.”

James admits that it focuses on advisers versus retail investors because it wants long-term relationships and it wants to avoid maintaining a large marketing staff.

To put GLRBX in perspective, its AUM is just 1% of Vanguard Wellington Wellesley (VWINX) fund, which maintains an average market cap of about $90B in its equity portfolio.

Active share

GLRBX reports against a blended index comprising 25% S&P 500, 25% Russell 2000, and 50% Barclays Capital Intermediate Government/Credit Bond indices. In practice, however, it does not follow a benchmark and does not compute the “active share” metric, which measures the degree to which a fund’s portfolio differs from the holdings of its benchmark portfolio. So, the metric is not particularly applicable here.

JIR’s David James, Director of Research, explains: “The fund deviates greatly and on purpose from the sector weightings of both these indexes. Typically this leads us to be better diversified than the benchmark which often overweights technology and finance sectors. Similarly, the fund would show up with a high “active share” as we presently have 141 individual equity holdings compared to close to 2,500 for the combined S&P 500 / Russell 2000 Indexes.”

We asked our friends at Alpha Architect to assess the GLRBX portfolio with their on-line Active Share Calculator (coming soon) and sure enough, they calculated 94.2%.

Management’s Stake in the Fund

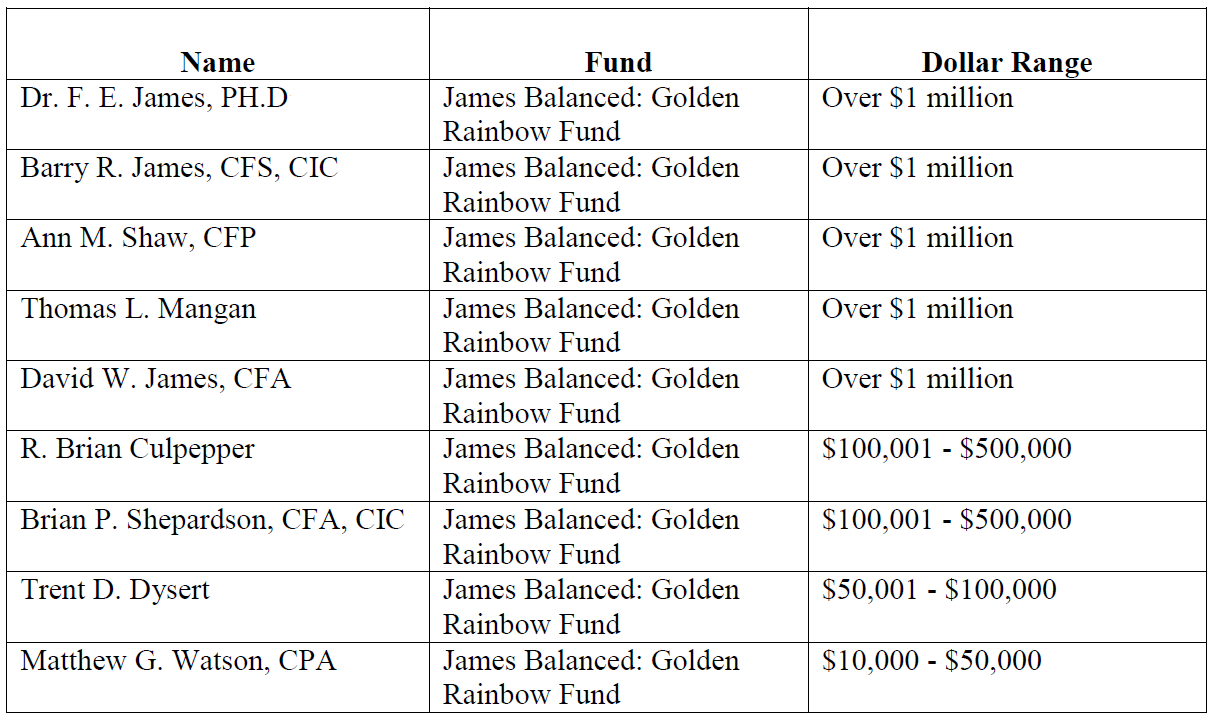
GLRBX represents the model for how fund management should maintain significant “skin in the game” and align its interests with those of shareholders. All long-time trustees and the entire team of 9 portfolio managers (the fund’s investment committee) are invested in the fund, plus the adviser’s retirement plan is invested in the fund. Per the latest SAI, dated November 14, 2014, the four trustees have more the $100K in the fund (two others just elected are expected to hold similar amounts). The table below represents holdings by the investment committee members:
James_3

Opening date

July 1, 1991 for investor share class (GLRBX) and March 2, 2009 for institutional share class (GLRIX).

Minimum investment

When investing directly with James, just $2K for a GLRBX individual account, just $500 for a retirement account, and just $50 with an automatic investment plan. Institutional shares also have a friendly $50K minimum by industry standards.

Just as a sample, Schwab offers GLRBX as a No Load/No Fee fund, with slightly higher minimums ($2.5K individual/$1K retirement) but imposes a short-term redemption fee. Similarly, Schwab offers GLRIX but with transaction fee and $100K minimum, but no short-term redemption fee.

Expense ratio

The retail shares are 1.21% and the Institutional shares are 0.96% on assets of $432.6 million, as of July 2023. 

——————————————————————————————————————————————

GLRBX charges a 1.01% expense fee annually, per its latest prospectus dated 11/01/2014, which is about 0.25% below industry average for the conservative allocation category. Its fee for active management is 0.66%.

Unfortunately like most of the industry, James still imposes 0.25% 12b-1 distribution and/or shareholder servicing fee and still maintains two share classes. Most of the 12b-1 fees are paid to the broker-dealers, like Schwab, who sell fund shares. Multiple share classes mean shareholders pay different expenses for the same fund, typically due to initial investment amount, transaction fee, or association of some form.

Institution shares (GLRIX) do not include the 12b-1 fee, resulting in a low 0.76% expense fee annually.

James imposes no loads.

On practice of soft dollars, which is essentially a hidden fee that allows advisers to pay higher commissions to broker-dealers to execute trades in exchange for things like research databases, James’ SAI allows it. Its Chief Compliance Officer, Lesley Ott, explains: “The language in our SAI permits soft dollars; however, it is our policy to not use them.  Per advice from counsel, the language in the SAI is intended to be broad in nature even though we may not engage in specific practices.”

On page 19 of the firm’s public disclosure of qualifications and practices (the so-called Part 2A of Form ADV: Firm Brochure) it states: “JIR does not have any soft-dollar arrangements and does not receive any soft-dollar benefits.” In fact, it is James’ practice to not pay for outside research; rather it conducts most of its research in-house.

Comments

The track record since inception for GLRBX is enviable by any measure and across any time frame.

Through June 2015, it is an MFO 20-year Great Owl, which means its shareholders have enjoyed top quintile risk adjusted returns based on Martin Ratio for the past 20, 10, 5, and 3 year periods. It is the only 20-year Great Owl in the conservative allocation category. It is also on the MFO Honor Roll, which means that it has delivered top quintile absolute returns in its category over the past 5, 3, and 1 year periods.

Though it is a Morningstar 5 star fund based on quantitative past performance, the fund is not covered by Morningstar analysts.

Here are its risk/return metrics across various evaluation periods through June 2015:

James_4a

James_4b

James_4c

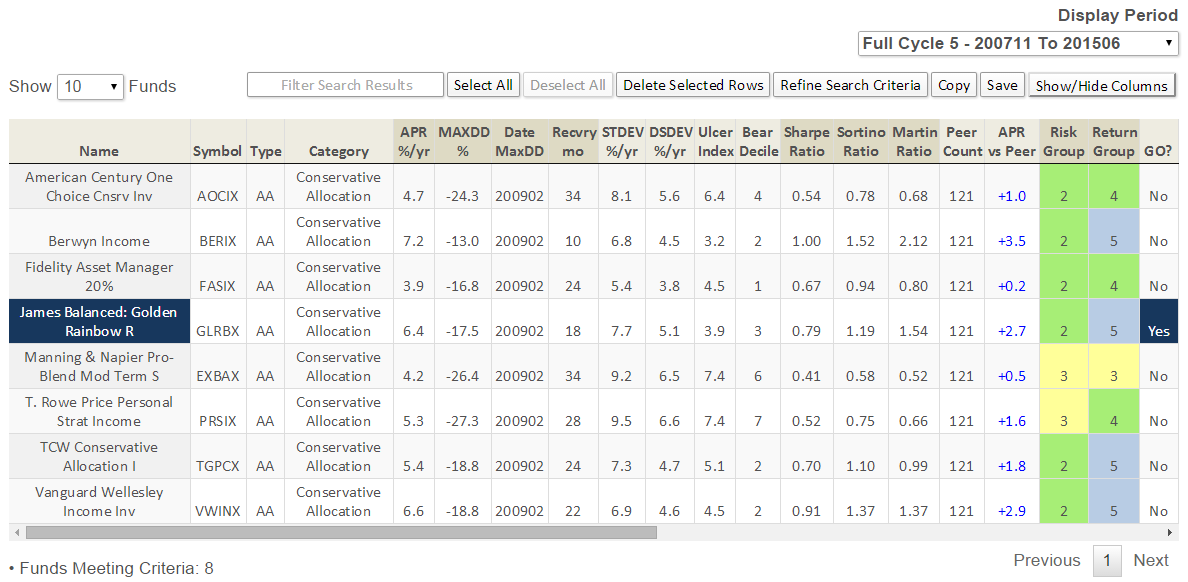
Here’s how it compares with notable peers during the current market cycle (Cycle 5 in table above), beginning November 2007, which includes the housing bubble:
James_5

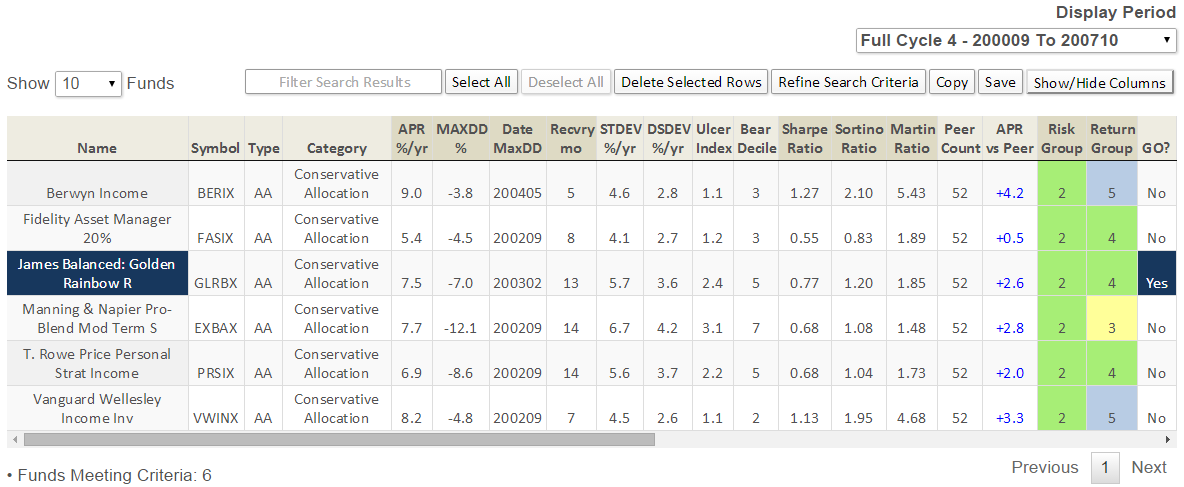
Here’s how it compares with during the market in cycle from September 2000 through October 2007 (Cycle 4 in table above), which includes the tech bubble:
James_6

True to its objective across all these evaluation periods, the fund has delivered very satisfactory total returns while minimizing volatility and drawdown.

How does it do it?

James believes it is better to try and anticipate rather than react to the market. In doing so, it has developed a set of risk indicators and stock selection factors to set allocation and portfolio construction. James has quantified these indicators every week since 1972 in disciplined fashion to help reduce 1) emotional moves, and 2) base actions on facts and current data.

When change to the portfolio does occur, it is done gradually. “We don’t jump from one extreme to the other in terms of allocation, we use the salami approach, taking a slice into or out of the market and then watching our indicators and continuing the process if they keep the same level of bullishness or bearishness.”

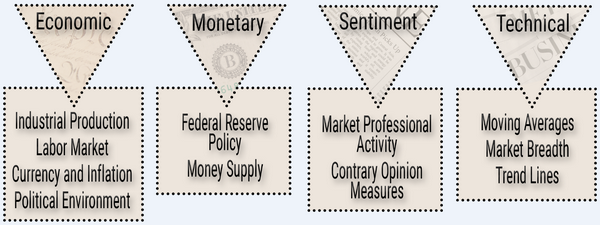
The risk measures and stock selection factors include a combination of macro-economic, sector analysis, company fundamental, and even market and stock technical analysis, like moving averages, as depicted below.
James_7small

Once the investment committee establishes allocation, capitalization, and sector weightings, the universe of about 8500 stocks tracked in Zack’s database, including those on Russell 2000 and S&P 500, are ranked based on three categories: relative valuation/sentiment (50%), positive and growing earnings (35%), and relative price strength (15%). The top ranked stocks then get reviewed more qualitatively by a team of 3 before being debated and voted on for inclusion by the investment committee. “A simple majority rules, with committee members voting in reverse order of seniority, to avoid undue influence by senior management.”

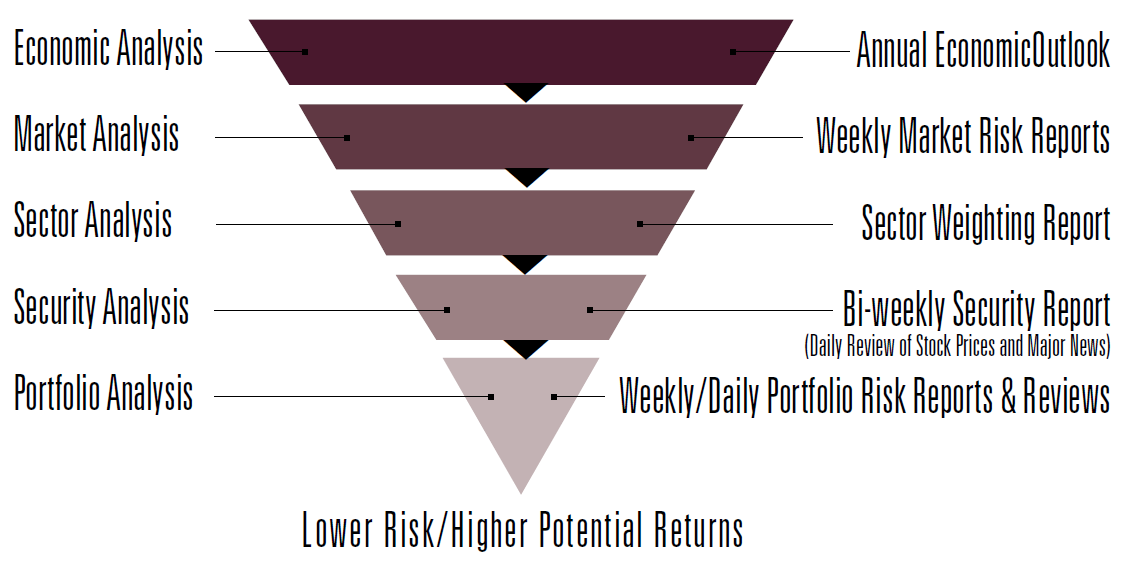
The disciplined risk management process is further depicted here:
James_8

In his book, 7 Timeless Principles of Investing, Barry James discusses how the decision to sell is more important than the decision to buy. James never enters a position without having the conviction to hold a stock a minimum of six month. But, more importantly and distinct than say deep-value investors, like Bruce Berkowitz or even Dodge & Cox, James will exit a position based on technical analysis alone. Not drawdown limits per se but technicals none the less.

Barry James explains: “We will sell a stock when it no longer offers good risk/reward return, which could be a change in fundamentals, but also weak price strength. While individual investors may often hang-on to poor performing stocks in hopes of a come-back, we see hanging-on to losers as an opportunity cost … we’ve developed the discipline to simply not do that.” Basically, fundamentals being equal, James would rather dump the losing stock for a stock with stronger price strength.

On share-holder friendliness, the company does a lot right: skin-in-the-game through substantial investment in the fund by all managing principals and directors of the trust, the firm’s employee retirement plan is in the fund, weekly email with updates on allocation decisions, quarterly commentary newsletters, frequent special reports including an annual financial outlook, no loads, relatively low fees, and a published Guiding Principles document.

The Guiding Principles document covers the firm’s mission, ethical standards, focus, and the importance of following the “Golden Rule” of treating others as one would like others to treat oneself. But the firm goes a step further by aligning these principles as “God Honoring” and applies the biblical reference of “Seek First the Kingdom of God.”

The firm’s vision articulated by James Barry, in fact, is “…best investment firm in US by striving to follow God Honoring Principles…we will spearhead a dramatic improvement in reputation of our industry.”

Mr. James’s religious faith clearly informs his investment practice. When asked if the association ever caused potential investors to feel awkward or even alienated, he states, “People will tell me that I don’t believe what you believe but I’m glad you do.”

Unlike socially responsible or so-called ESG funds, James applies no screen to restrict investments to firms practicing similar principles or of any religious association.

(James does act as a sub-adviser for the Timothy Plan Growth & Income Fund TGIAX, which is part of The Timothy Plan family of mutual funds for “biblically responsible investing”. These funds avoid “investing in companies that are involved in practices contrary to Judeo-Christian principles.” This family ranks in the bottom quintile on MFO’s Fund Family Score Card due in part at least to indefensible front-loads and high expense ratios.)

James is a family business and succession planning is clear and present from Dr. James to Barry and David. Beyond that, a grandson-in-law and a grandson are getting experience at the firm and in the brokerage business. A spokesman explains: “Our intent is for the firm to remain independent in the years ahead and estate planning has been done to keep the business in the family’s hands.”

Bottom Line

At some level, all actively managed funds try to anticipate the future and position accordingly. By studying past results and identifying persistent premiums, like value or small cap stocks. By studying company fundamentals to find under-appreciated stocks of high quality companies. By finding pricing displacements or inefficiencies in the market and attempting to capitalize with say value arbitrage trades. By anticipating macro-economic events or recognizing trends in the market.

James combines several of these approaches with its flagship fund for setting allocations, sector weightings, bond duration targets, equity selection, and portfolio construction in a way that mitigates risk, protects against downside, while still delivering very satisfactory returns. Given its track record, relatively small size, and disciplined implementation, there is no reason to believe it will not keep meeting its investment objective. It definitely deserves to be on the short list of easy mutual funds to own for defensive minded investors.

Fund website

James Advantage Funds maintains a decent website, which includes fund regulatory documentation, past performance, market outlooks, quarterly and special reports. Similarly, more information about the adviser can be found at James Investment Research.

August 2015, Funds in Registration

By David Snowball

361 Long/Short Credit Fund

361 Long/Short Credit Fund will seek to provide positive absolute total returns over a complete market cycle. It’s pretty much an unconstrained global long/short bond fund. The fund will be managed by an as-yet unnamed outside sub-advisor. The initial expense ratio also has not yet been released. The minimum initial investment is $2,500.

Absolute Capital Asset Allocator Fund

Absolute Capital Asset Allocator Fund will seek long-term capital appreciation. The plan is to churn a portfolio of stocks, bonds, funds, CEFs, ETFs and ETNs between various asset classes. The fund will be managed by Phillip Brenden Gebben, cofounder of Absolute Capital. The initial expense ratio has not yet been announced. The minimum initial investment is $2,500.

Absolute Capital Defender Fund

Absolute Capital Defender Fund will seek long-term capital appreciation. The plan is to defensively churn a portfolio of stocks, bonds, funds, CEFs, ETFs and ETNs between various asset classes. The fund might go substantially to cash. The fund will be managed by Phillip Brenden Gebben, cofounder of Absolute Capital. The initial expense ratio has not yet been announced. The minimum initial investment is $2,500.

Champlain Emerging Markets Fund

Champlain Emerging Markets Fund will seek long-term capital appreciation. The plan is to invest in “growing but stable companies trading at attractive valuations” using a scoring metric that tries to control for behavioral bias.  Champlain Advisors acquired New Sheridan Developing World Fund which, not to be cruel, had no assets, high expenses and mediocre performance. The fund will be managed by Russell and Richard Hoss, who managed New Sheridan for the last year of its existence. Both are Air Force Academy grads. The initial expense ratio, after expense waivers, will be 1.86% for Advisor shares. The minimum initial investment is $10,000, reduced to $3,000 for various tax-advantaged accounts.

Deutsche Limited Maturity Quality Income Fund

Deutsche Limited Maturity Quality Income Fund will seek current income consistent with the preservation of capital and liquidity. The plan is invest in both domestic and international high quality, short-term fixed-income instruments which are dollar denominated. They expect to maintain a duration of 90 days or less and will invest only in securities rating in one of the top two quality categories (AA and AAA). The fund will be managed by Geoffrey Gibbs, who is head of Deutsche’s Liquidity Management Group, and Lee Rodon and Glenn Koenig, both of whom work in the group. The initial expense ratio hasn’t been released. The minimum initial investment is $1,000. They expect to launch September 28.

Deutsche Ultra-Short Quality Income Fund

Deutsche Ultra-Short Quality Income Fund will seek a high level of current income consistent with the preservation of capital and liquidity.  The plan is to invest at least 65% of the portfolio in securities rated in the top three quality categories. The remainder can be rated one tier lower. The fund will be managed by Geoffrey Gibbs, who is head of Deutsche’s Liquidity Management Group, and Lee Rodon and Glenn Koenig, both of whom work in the group. The initial expense ratio hasn’t been released. The minimum initial investment is $1,000. They expect to launch September 28.

Ivy Apollo Strategic Income Fund

Ivy Apollo Strategic Income Fund will seek a combination of current income and capital appreciation.  The plan is to allocate 20% of the portfolio to Apollo Credit Management’s Total Return Strategy (a global value strategy encompassing U.S. corporate credit, global corporate credit, structured credit, and real estate) and flexibly allocate the remainder between Ivy’s Global Bond and High Income Strategies. The managers will be Mark Beischel and Chad Gunther from Ivy and James Zelter, President of Apollo. The initial expense ratio on “A” shares is 1.15%. The minimum initial investment is $750, which is waived for accounts set up with an automatic investment plan.

Ivy Apollo Multi-Asset Income Fund

Ivy Apollo Multi-Asset Income Fund will seek a combination of current income and capital appreciation.  The plan is to allocate 20% of the portfolio to Apollo Credit Management’s Total Return Strategy (a global value strategy encompassing U.S. corporate credit, global corporate credit, structured credit, and real estate), 30% to Ivy High Income, 40% to Ivy Global Equity Income and 10% to LaSalle US’s Global Real Estate Strategy. The managers will be Mark Beischel and Chad Gunther from Ivy and James Zelter, President of Apollo. The initial expense ratio on “A” shares is 1.15%. The minimum initial investment is $750, which is waived for accounts set up with an automatic investment plan.

TCW/Gargoyle Hedged Value Fund

TCW/Gargoyle Hedged Value Fund (TFHIX/TFHVX) will seek long-term capital appreciation with lower volatility than a stand-alone stock portfolio. The plan is to buy undervalued mid- to large-cap stocks and sell index call options. The fund was previously RiverPark/Gargoyle Hedged Value (2012-15) and was a hedge fund before that (2005-2012). The fund will continue to be managed by Joshua B. Parker and Alan L. Salzbank of Gargoyle Investment Advisor. The initial expense ratio will be 1.50% for retail shares. The minimum initial investment is $5,000, reduced to $1,000 for IRAs.

TCW/Gargoyle Dynamic 500 Fund

TCW/Gargoyle Dynamic 500 Fund will seek long-term capital appreciation with reduced risk and lower volatility than the S&P 500 Index. The plan is to buy the S&P 500 portfolio but hedge it by selling “short-term slightly out-of-the-money SPX call options.” They’ll actively manage the options portfolio. The fund might have a net stock market exposure of 35-65%, with a neutral target of 50%. The fund will be managed by Joshua B. Parker and Alan L. Salzbank of Gargoyle Investment Advisor. The initial expense ratio has not been released. The minimum initial investment is $5,000, reduced to $1,000 for IRAs.

TCW/Gargoyle Systematic Value Fund

TCW/Gargoyle Systematic Value Fund will seek long-term capital appreciation. The plan is to buy, mostly, US mid- to large-cap stocks that the managers believe are undervalued. This is, at base, the long portfolio from the Hedged Value Fund and it has a very good long-term record. The fund will be managed by Joshua B. Parker and Alan L. Salzbank of Gargoyle Investment Advisor. The initial expense ratio has not been released. The minimum initial investment is $5,000, reduced to $1,000 for IRAs.

TCW High Dividend Equities Long/Short Fund

TCW High Dividend Equities Long/Short Fund will seek long-term capital appreciation. The plan is to invest, long and short, in high dividend securities. These might include everything from common stocks to MLPs, REITs, business development companies and ETFs. The fund will be managed by Iman H. Brivanlou of TCW. The initial expense ratio has not been released. The minimum initial investment is $5,000, reduced to $1,000 for IRAs.

TCW/Carlyle Liquid Tactical Fund

TCW/Carlyle Liquid Tactical Fund will seek “risk-adjusted long-term total return.”‘ The plan is to trade “liquid instruments” which invest equities, fixed income, credit, commodities, currencies and alternatives markets. The fund will be managed by a team from Carlyle Liquid Market Solutions. The initial expense ratio has not been released. The minimum initial investment is $5,000, reduced to $1,000 for IRAs.

TCW/Carlyle Trend Following Fund

TCW/Carlyle Trend Following Fund will also seek risk-adjusted long-term total return. At base, it’s a managed futures fund which will invest, long or short, in various asset classes based on whether they underlying price trend is positive or negative. In general, managed futures funds have performed poorly, averaging about 1.7% per year over the past five years while the best of them have made about 5%. The fund will be managed by a team from Carlyle Liquid Market Solutions.  The initial expense ratio has not been released. The minimum initial investment is $5,000, reduced to $1,000 for IRAs.

TCW/Carlyle Absolute Return Fund

TCW/Carlyle Absolute Return Fund will seek (surprise!) risk-adjusted long-term total return.  The plan is to allocate the portfolio between the other two TCW/Carlyle funds. The fund will be managed by a team from Carlyle Liquid Market Solutions. The initial expense ratio has not been released. The minimum initial investment is $5,000, reduced to $1,000 for IRAs.

USA Mutuals/WaveFront Hedged Emerging Markets Fund

USA Mutuals/WaveFront Hedged Emerging Markets Fund will seek consistent long-term capital appreciation with significantly less volatility compared to traditional emerging markets indices. The plan is to combine a frequently-traded long portfolio with an options overlay and the possibility of holding 20% in high quality, short-term debt. The fund is a converted version of a hedge fund run by Mark Adam from WaveFront Capital Management, L.P.  The hedge fund made less than 0.8% in 2013 while the benchmark lost 0.1%, but in 2014 pocketed a 4.4% gain as the index dropped 3.0%.The initial expense ratio will be 1.75% for Investor class shares. The minimum initial investment is $2,000, reduced to $100 for various tax-advantaged accounts.

Van Eck Long/Short Equity Fund

Van Eck Long/Short Equity Fund will seek “consistent total returns while experiencing lower volatility” than most other long/short funds. The adviser has identified the investment characteristics of all long/short hedge funds that focus on North American stocks. They plan to invest, long and short, in ETFs and similar vehicles in order to replicate that universe. They will not use leverage. In an interesting twist, the fund “has not yet commenced operations” but Marc Freed and Ben McMillan have been managing it since 2013. The initial expense ratio has not been disclosed. The minimum initial investment for the loaded “A” shares is $1000 and is waived for accounts established with an automatic investment plan.

July 2015, Funds in Registration

By David Snowball

First Western Short Duration High Yield Credit Fund 

First Western Short Duration High Yield Credit Fund will seek a high level of current income and capital growth. The plan is to invest in a global portfolio of junk bonds and floating rate senior secured loans. The fund will be managed by Steven S. Michaels. The minimum initial investment is $1,000. The opening expense ratio for retail shares will be 1.2%.

RiverNorth Marketplace Lending Fund

RiverNorth Marketplace Lending Fund will seek “a high level of total return, with an emphasis on current income.” The plan is to invest in “loans to consumers, small- and mid-sized companies and other borrowers originated through online platforms.” That is, they’ll subscribe to loans through peer-to-peer lenders such as Lending Tree and Prosper.com. They urge you to think of this as a fund that might fit into the “high yield / speculative income” slot in your portfolio. They also, rightly, raise two red flags: (1) no one has ever done this before and so there’s no established market for trading these shares, which might well make them illiquid for rather longer than you like and (2) this is structured as a closed-end fund but will likely function as an interval fund; that is, you might have to request redemption of your shares then wait for a redemption window. That’s akin to the practice in hedge funds, since they also make money from the mispricing of illiquid investments. The fund will be managed by Philip K. Bartow and Patrick W. Galley. Mr. Bartow just joined RiverNorth after serving as “Principal at Spring Hill Capital, where he focused on analyzing and trading structured credit, commercial mortgage and asset-backed fixed income investments.” Mr. Galley is RiverNorth’s Alpha male. Details like purchase requirements and expenses have yet to be worked out.

RQSI Small Cap Hedged Equity Fund

RQSI Small Cap Hedged Equity Fund will seek total return with lower volatility than the overall equity market. The plan is to invest in a diversified portfolio of U.S. small cap stocks and ADRs, when they need exposure to a foreign stock, which will be selected using the Ramsey Quantitative Systems, Inc. quantitative system. The manager will use options, futures and ETFs to hedge the portfolio. The fund will be managed by Benjamin McMillan, formerly a manager for Van Eck Global’s Long/Short Equity Index Fund. The minimum initial investment is $2,500. The opening expense ratio will be 1.56% for retail shares.

T. Rowe Price Emerging Markets Value Stock Fund

T. Rowe Price Emerging Markets Value Stock Fund will pursue long term growth of capital. The fund will invest in “stocks of larger companies that are undervalued in the view of the portfolio manager using various measures.” The fund will be managed by Ernest Yeung. Mr. Yeung joined T. Rowe in 2003. Price describes him as having “joined the Firm in 2003 and his investment experience dates from 2001. He has served as a portfolio manager with the Firm throughout the past five years.” He’s also described as a “sector expert” on Asian media and telecomm stocks. I can, however, only find a four month fill-in stint as manager of New Asia (PRASX). Presumably he’s been managing something other than mutual funds and has done it well enough to satisfy Price. The opening expense ratio, after waivers, will be 1.5%. The minimum initial investment will be $2,500, reduced to $1,000 for tax-advantaged accounts. The prospectus is dated August 24, 2015 which suggests the launch date.

Thornburg Better World Fund

Thornburg Better World Fund will seek long-term capital growth. The plan is to invest in international “companies that demonstrate one or more positive environmental, social and governance characteristics.” They can also hold fixed income securities, but that’s clearly secondary. The fund will be managed by Rolf Kelly, who has been with Thornburg since 2007. Before that, he was a “reservoir engineer” for an oil company. The minimum initial investment is $5,000, reduced to $2,000 for various tax-advantaged accounts. The opening expense ratio is 1.83% for “A” shares, which also carry an avoidable 4.5% load.

United Income and Art Fund

United Income and Art Fund will seek income with long-term capital appreciation as a secondary objective. The plan is to invest in equity and fixed-income mutual funds (based on “performance, risk, draw downs, portfolio holdings, turnover, and potential concentration risk – easy peasy!) and up to 15% in potentially illiquid “art companies,” plus long and short ETFs for hedging. The fund will be managed by Doran Adhami and Itay Vinik of United Global Advisors. Mr. Adhami was a Vice President of Investments for UBS from 2005-13; Mr. Vinik was an intern there and is now, with “approximately three years” of industry experience, United Global’s CIO. He also helps manage the Ace of Swords Fund. The minimum initial investment is $500. The opening expense ratio has not been released; the existence of a 2% redemption fee and a 0.25% 12(b)1 fee have been established.

Zevenbergen Genea Fund

Zevenbergen Genea Fund will seek long-term capital appreciation. The plan is to invest in the stocks of 15-40 firms which are “benefitting from advancements in technology.” I’m certain that’s not nearly as dumb as it sounds. International exposure would come mostly through ADRs. The fund will be managed by Nancy Zevenbergen, Brooke de Boutray, and Leslie Tubbs. The adviser has about $2.4 billion in assets under management and all of the managers have experience as portfolio managers at regional banks. The minimum initial investment is $2,500. The opening expense ratio is 1.40%.

Zevenbergen Growth Fund

Zevenbergen Growth Fund will seek long-term capital appreciation. The plan is to invest in 30-60 industry leaders, described as firms which seek to invest in industry leaders with “strong competitive positioning.” International exposure would come mostly through ADRs. The fund will be managed by Nancy Zevenbergen, Brooke de Boutray, and Leslie Tubbs. The adviser has about $2.4 billion in assets under management and all of the managers have experience as portfolio managers at regional banks. The minimum initial investment is $2,500. The opening expense ratio is 1.3%.

June 2015, Funds in Registration

By David Snowball

Catalyst/Auctos Managed Futures Multi-Strategy Fund

Catalyst/Auctos Managed Futures Multi-Strategy Fund will pursue capital appreciation uncorrelated to global equity markets. The plan is to “employ nine unique trading models, which are applied to the four investment sub-strategies” in order to gain absolute returns through both rising and falling price cycles. The fund will be managed by Kevin Jamali. Catalyst is an alternatives manager whose other two managed futures funds have done quite well. The initial expense ratio capped at 1.99%, though with a management fee of 1.75%, it’s hard to see how that’s going to be sustainable. The minimum initial investment is $2,500, reduced to for $100 for account established with an AIP.

Fulcrum Diversified Absolute Return Fund

Fulcrum Diversified Absolute Return Fund will seek long-term absolute returns. I have no idea of what they’re actually going to do. The prospectus specifies that they’ll invest in a mix of asset classes, apparently through derivatives, with a target portfolio volatility of 12%. There’s no clear explanation of why that’s a good thing or how it might play out in terms of returns. The fund will be managed by a mostly-British team from Fulcrum Asset Management. The advisor has a European UCITS using this strategy; it’s returned 5.6% annually over its first three years. The initial expense ratio will be 1.45% for Advisor shares. The minimum initial investment for Advisor shares is $1,000.

Intrepid Select Fund

Intrepid Select Fund will seek long-term capital appreciation. The plan is to invest in a global, non-diversified portfolio of common stocks, preferred stocks, convertible preferred stocks, warrants, options and foreign securities. The fund will be managed by  a team of investment professionals led by Mark Travis, Intrepid’s president. The same team manages Intrepid’s other funds which are substantially better than Morningstar’s ratings would lead you to believe. They have an aversion to losing money, which means they have exceptional cash reserves in the range of 50-75%, and at least one of the funds (Income ICMUX) is noticeably misclassified. The initial expense ratio will be 1.40%. The minimum initial investment is $2,500.

TIAA-CREF Social Choice International Equity Fund

TIAA-CREF Social Choice International Equity Fund will seek a favorable long-term total return, reflected in the performance of ESG-screened international stocks. MSCI will provide the ESG screens and the fund will target developed international markets. The fund will be managed by Philip James (Jim) Campagna and Lei Liao. The managers’ previous experience seems mostly to be in index funds. The initial expense ratio will be 0.79%. The minimum initial investment is $2,500, reduced to $2,000 for various tax-advantaged products.

TIAA-CREF Social Choice Low Carbon Equity Fund

TIAA-CREF Social Choice Low Carbon Equity Fund will seek a favorable long-term total return, reflected in the performance of ESG-screened US stocks. MSCI will provide the ESG screens, which will be supplemented by screens looking for firms who “demonstrate leadership in managing and mitigating their current carbon emissions and (2) have limited exposure to oil, gas, and coal reserves.” I understand the moral imperative and the appeal to CREF’s core constituency (university and non-profit employees), though I’m not aware of the merits of the investment case for this strategy. The fund will be managed by Philip James (Jim) Campagna and Lei Liao. The managers’ previous experience seems mostly to be in index funds. The initial expense ratio will be 0.71%. The minimum initial investment is $2,500, reduced to $2,000 for various tax-advantaged products.

TIAA-CREF Short-Term Bond Index Fund

TIAA-CREF Short-Term Bond Index Fund will seek favorable long-term total return, mainly from current income, by investing in domestic, investment-grade short term bonds. The fund will be managed by Lijun (Kevin) Chen and James Tsang. The initial expense ratio will be 0.47%. The minimum initial investment is $2,500, reduced to $2,000 for various tax-advantaged products.

Trillium All Cap Fund

Trillium All Cap Fund will seek long term capital appreciation by investing in an all-cap portfolio of “stocks with high quality characteristics and strong environmental, social, and governance records.” Up to 20% of the portfolio might be overseas. The fund will be managed by Elizabeth Levy and Stephanie Leighton of Trillium Asset Management. Levy managed Winslow Green Large Cap from 2009-11, Leighton managed ESG money at SunLife of Canada and Pioneer. The initial expense ratio is capped at 1.25% for retail shares. The minimum initial investment is $5000. It appears that the advisor will first launch Institutional ($100,000/0.90%) shares in July. It’s not clear when the Retail shares will debut.

Trillium Small/Mid Cap Fund

Trillium Small/Mid Cap Fund will seek long term capital appreciation by investing in a portfolio of small- to mid-cap “stocks with high quality characteristics and strong environmental, social, and governance records.” Small- to mid- is defined as stocks comparable in size to those in the S&P 1000, a composite of the S&P’s small and mid-cap indexes. Up to 20% of the portfolio might be overseas. The fund will be managed by Laura McGonagle and Matthew Patsky of Trillium Asset Management. Trillium oversees about $2.2 billion in assets. McGonagle was previously a research analyst at Adams, Harkness and Hill and is distantly related to Professor Minerva McGonagall. Patsky was Director of Equity Research for Adams, Harkness & Hill and a manager of the Winslow Green Solutions Fund. The initial expense ratio is capped at 1.38% for retail shares. The minimum initial investment is $5000. It appears that the advisor will first launch Institutional ($100,000/0.98%) shares in July. It’s not clear when the Retail shares will debut.

JOHCM International Select II Fund (formerly JOHCM International Select Fund), (JOHAX/JOHIX), June 2015

By David Snowball

At the time of publication, this fund was named JOHCM International Select Fund,

Objective and strategy

The fund seeks long-term capital appreciation by investing in a compact portfolio of developed and developing markets stocks. The strategy combines fundamental analysis of individual equities with a top-down overlay which shapes country and sector weights. At the level of individual securities, the managers use a growth-at-a-reasonable-price; they characterize it as “a core investment style with a modest growth tilt.” They target firms with three characteristics:

  • positive earnings surprises
  • sustainably high or increasing return on equity, and
  • attractive valuations.

At the country and sector level, they look for “green lights” in four areas:

  • fundamentals
  • valuations,
  • beta, and
  • price trend.

Those inquiries include questions about currency trends. They do not hedge their currency exposure. The portfolio holds around 30 equally-weighted positions. They are not hesitant “to weed out the losers.”

Adviser

J O Hambro Capital Management (JOHCM) is an investment boutique headquartered in London, but with offices in Singapore, New York and Boston. They were founded in 2001 and entered the U.S. market in 2009. As of March 2015, they managed $27.3 billion of assets for clients worldwide. Their US operations had $6.4 billion in AUM, with $3.1 billion in seven mutual funds.

Manager

Christopher Lees and Nudgem Richyal. Mr. Lees joined JOHCM in 2008 after 20 years with Barings Asset Management where he was, among other things, Lead Global High Alpha Manager. Mr. Richyal also joined JOHCM in 2008 from Barings where he ran large global resources and Latin American equity portfolios. Lees and Richyal have been working together for more than 12 years.  They manage about $15 billion in assets together, including the much younger, smaller and less accessible Global Equity Fund (JOGEX/JOGIX).

Strategy capacity and closure

$8 billion. As of May, 2015, the fund had about $2.8 billion in assets but the strategy, which is also manifested in separate accounts, was about twice that. In response, the advisor slated a “soft close” for July 2015. They would prefer to avoid a “hard close” but haven’t foreclosed that option. They anticipate reopening only if “we experienced significant redemptions, or if market conditions changed dramatically.”

Active share

94.2. “Active share” measures the degree to which a fund’s portfolio differs from the holdings of its benchmark portfolio. High active share indicates management which is providing a portfolio that is substantially different from, and independent of, the index. An active share of zero indicates perfect overlap with the index, 100 indicates perfect independence. An active share of 94.2 is extremely high for a fund with a large cap portfolio.

Management’s stake in the fund

None, which is understandable since the managers are British and the fund’s only open to U.S. investors. The managers do invest in the strategy through a separate vehicle but we do not know the extent of that investment.

Opening date

July 29, 2009 for the institutional class, March 31, 2010 for the retail class.

Minimum investment

$2,000 for Class II retail shares, $25,000 for Class I institutional shares.

Expense ratio

1.21% for investor shares and 0.98% for institutional shares on assets of $5.9 billion, as of July 2023.

Comments

It’s hard to find fault with JOHCM Select International. As of 31 March 2015, the five-year-old fund has the best performance of any international large growth portfolio:

1 year

Top 1% (rank #1 of 339 funds)

3 year

Top 1% (rank #1 of 293 funds)

5 year

Top 1% (rank #1 of 277 funds)

(Morningstar rankings for Class I shares)

Remarkably, those returns have not come at the expense of heightened volatility. Here’s the Observer’s risk-return profile for JOHAX’s performance against its international large-growth peers since inception.

johaxHere’s the interpretation:

  • JOHAX has made rather more than twice as much as its peers; 98% total since inception, which comes to 14.4% per year.
  • Raw volatility is in-line with its peers; the maximum drawdown, peak-back-to-peak recovery time, the Ulcer Index (which measures a combination of the depth and length of a drawdown) and downside deviation are not noticeably higher than its peers.
  • Measures of the risk-return trade-off (the Sharpe, Sortino and Martin ratios) are all uniformly positive.

What about that “bear decile”? On face, it’s bad: the fund has been among the worst 20% of performers during “bear market months.” In reality, it’s somewhere between inconsequential and positive. “Bear markets months” are measured by the movement of the S&P 500, which isn’t the benchmark here, and there have been only eight such months in the fund’s 60 months of existence. So, arguably inconsequential. And it’s potentially positive: JOHAX has such a high degree of independence that it sometimes falls when its benchmark is rising (three months) and rises when its benchmark is falling (3X) and it sometimes falls substantially more (3X) or substantially less (7X) than its benchmark.

JOHAX has thereby earned the highest possible ratings from Morningstar (Five Stars, but no analyst rating because they’re off Morningstar’s radar), Lipper (Lipper Leader, not that anyone really notices, for Total Return and Consistent Returns) and the Observer (it’s a Great Owl, which means it has top-tier risk-adjusted returns than its peers in every trailing measurement period).

How do they do it?

Good question. The portfolio is very distinctive. It currently holds about 30 names, which makes it the most compact international large-growth portfolio on the market and one of the 10 most compact international large cap portfolios overall. The shares are all equally-weighted, which is both rare and useful.

They claim to be benchmark agnostic, and that’s reflected in their sector and country weights. The fund’s most recent portfolio report shows huge divergences from its benchmark in most industry sectors.

weight

Similarly, their regional allocations are distinctive. The average international large cap fund has twice as much in Europe as in Asia; JOHCM weights them equally, at about 42% each. That Asian overweight is likely to become much more pronounced in the near term. When they close out existing positions, they sometimes just add the proceeds to their existing names. As of mid-2015, however, they’re reallocating toward Japan and emerging Asia, where all of their top-down indicators are turning positive.

They describe Japan as “one of the cheapest developed markets in the world, [which] has finally embarked upon significant Western-style corporate restructuring, which is driving some of the fastest-growing earnings revisions and returns on equity in the world.” One spur for the change was the creation of a Nikkei 400 ROE index, which tracks companies “with high appeal for investors, which meet requirements of global investment standards, such as efficient use of capital and investor-focused management perspectives.” They point to tool-maker Amada as emblematic of the dramatic changes, and substantial price appreciation, possible once Japanese corporate leaders decide to reorient their capital policies in ways (the issuance of dividends and stock buybacks) that are shareholder-friendly. Amada failed to be included in the initial index, which led management to rethink and reorient.

They are unwilling to stick with stocks which are deteriorating; they repeated invoke the phrase “weeding out the losers,” which they describe as “selling stocks that were broken fundamentally and technically.” Their process seems to find a fair number of losers, with turnover running between 50-80%. That’s about in-line with comparable funds.

The managers believe they have “an idiosyncratic approach to stock picking that means [they] tend to look in parts of the market largely ignored by more traditional growth investors.” All of the available statistical evidence seems to validate that claim.

Bottom Line

Before you rush to join the party, consider three caveats:

  • Independence comes with a price: when you’re structurally out-of-step with the herd, there are going to be periods when your performance diverges sharply from theirs. There will be periods when the managers look like idiots and when you’ll feel (poorly-timed) pressure to cut and run.
  • Trees don’t grow to the sky: as both Morningstar’s research and ours has demonstrated, it’s exceedingly rare for managers to decisively outperform their peers for extended periods and impossible for them to do so for much more than three consecutive years. Even Buffett’s longest win streak is just three years, which matches his longest losing streak and perpetually fuels the “has Buffett lost it?” debate.
  • Closing is not a panacea: the advisor has determined that it’s in the best interests of current shareholders for the fund to restrict inflows. They’ve made that decision relatively early; they’re closing at about two-thirds of strategy capacity, which is good. Nonetheless, academic and professional research both show that performance at closed funds tends to sag. It’s not universal, but it’s a common pattern.

There are no evident red flags in the fund’s construction, management or performance. There’s an indisputably fine record at hand. Folks interested in an idiosyncratic portfolio of high growth international names should review their options quickly. Investors who are hesitant to act quickly here but can afford a high minimum might consider the team’s other U.S. fund, JOHCM Global Equity (JOGEX). It’s small, comparable to their European global fund and off to a fine start; the downside is that the minimum investment is $25,000.

Fund website

JOHCM International Select. Be patient, the navigation takes a while to get used to. If you click on the “+” in the lower right of each box, new content appears for you. There’s parallel, but slightly different, content on the webpage for the fund’s European version, JOHCM Global Select, which has a bunch US stocks since, for their perspective we are a “foreign” investment.

© Mutual Fund Observer, 2015. All rights reserved. The information here reflects publicly available information current at the time of publication. For reprint/e-rights contact us.

May 2015, Funds in Registration

By David Snowball

American Beacon Grosvenor Long/Short Fund

American Beacon Grosvenor Long/Short Fund will seek long-term capital appreciation.  At this point the strategy for pursuing that objective is entirely hypothetical.  American Beacon hired Grosvenor Capital Management to hire other firms to actually manage the portfolio. So far, the folks actually managing the money haven’t been named, though we do know that one (or more) of them might pursue an equity strategy while one (or more) of them might purse an event-driven strategy, though the fund might not simultaneously pursue both strategies. This might explain the fund’s expense structure. Opening expenses on the Investor share class are 2.49% after waivers with a rich management fee of 1.55%. The minimum initial purchase requirement is $2500.

AMG GW&K Small Cap Growth Fund

AMG GW&K Small Cap Growth Fund will seek to provide investors with long-term capital appreciation. The plan is to build a diversified domestic small cap portfolio.  Nothing fancy, so far as I can tell. The fund will be managed by Daniel L. Miller and Joseph C. Craigen. Mr. Miller already co-manages a very solid small-blend fund for AMG. The initial expense ratio will be 1.45% and the minimum initial investment is $2,000, reduced to $1,000 for IRAs.

Balter Discretionary Global Macro Fund

Balter Discretionary Global Macro Fund (BGMVX) will seek to generate positive absolute returns in most market conditions. The plan is to do predictably complex stuff with derivatives and direct investments in order to build a portfolio of non-correlated assets . The fund will be sub-advised by Philip Yang and Frank C. Marrapodi of Willowbridge Associates. The initial expense ratio will be 2.19% (and that’s after waivers) and the minimum initial investment is $5,000.

Cutler Emerging Markets Fund

Cutler Emerging Markets Fund will seek current income and long-term capital appreciation. The plan is to use the same discipline they apply in their pretty solid Cutler Equity Fund (CALEX) to the emerging markets. They might hedge their currency exposure, but maybe not. Otherwise, no particular twists. The fund will be managed by Matthew Patten, Erich Patten and Xavier Urpi. The initial expense ratio will be 1.55% and the minimum initial investment is $2,500.

Eventide Multi-Asset Income Fund

Eventide Multi-Asset Income Fund will seek current income while maintaining the potential for capital appreciation. The plan is to invest in whatever income-producing assets look most attractive. They might obtain that exposure directly or through derivatives and they might invest up to 10% in short positions. In either case, the fund has substantial positive and negative social screens. The fund, other than noted below, will be managed by Martin Wildy and David Dirk. The fund’s intermediate bond sleeve will be managed by unnamed folks from Boyd Watterson Asset Management. The initial expense ratio will be 1.19% for “N” shares and the minimum initial investment is $1,000.

Grandeur Peak Global Micro Cap Fund

Grandeur Peak Global Micro Cap Fund will seek long-term growth of capital. The method here replicates the strategy in GP’s other funds, but apply it exclusively to global stocks with market caps under $1.5 billion. They warn of substantial emerging and frontier exposure. The fund will be managed by Randy Pearce & Blake Walker with GP’s senior manager, Robert Gardiner, hovering in the background.  The initial expense ratio has not been released and the minimum initial investment is $2,000.

Grandeur Peak Global Stalwarts Fund

Grandeur Peak Global Stalwarts Fund will seek long-term growth of capital. The method here replicates the strategy in GP’s other funds, but apply it exclusively to stocks with market caps over $1.5 billion. GP defines “stalwarts” as “growth companies that are maturing. They are proven success stories that still have headroom to grow, but whose growth is slowing as they mature.” They warn of substantial emerging and frontier exposure.  The fund will be managed by Randy Pearce & Blake Walker with GP’s senior manager, Robert Gardiner, hovering in the background.  The initial expense ratio has not been released and the minimum initial investment is $2,000..

Grandeur Peak International Stalwarts Fund

Grandeur Peak International Stalwarts Fund will seek long-term growth of capital. The method here replicates the strategy in GP’s other funds, but apply it exclusively to non-U.S. stocks with market caps over $1.5 billion. They warn of substantial emerging and frontier exposure.  The fund will be managed by Randy Pearce & Blake Walker with GP’s senior manager, Robert Gardiner, hovering in the background.  The initial expense ratio has not been released and the minimum initial investment is $2,000.

James Aggressive Allocation Fund

James Aggressive Allocation Fund will seeks to provide total return through a combination of growth and income. I don’t see anything particularly aggressive about it: the default is a 60/40 allocation with the proviso that stocks might range from 50-100% of the portfolio. The fund will be managed by nine guys, many of whom are named James. The initial expense ratio hasn’t been disclosed and the minimum initial investment is $10,000, reduced to $5,000 for IRAs.

Janus Adaptive Global Allocation Fund

Janus Adaptive Global Allocation Fund will seek total return through growth of capital and income.  The plan is to invest globally in stocks and bonds but to focus especially on the issue of “tail risk.” That is, relatively unlikely events that might have a major impact should they occur.  The neutral allocation is 70/30 global stocks to bonds. The fund will be managed by Ahhwin Alankar, Ph.D., and Enrique Chang. Opening expenses on the fund’s five share classes have not been revealed. The minimum initial purchase for the various retail shares is $2500.

Meeder Dividend Opportunities Fund

Meeder Dividend Opportunities Fund will seek to provide total return, including capital appreciation and current income. The plan is to invest at least 80% in dividend-paying stocks, either directly or through ETFs and similar creatures. Up to 20% might be in fixed income. They use the same strategies in separate accounts; the composite there shows them leading their benchmark about as often as they trail it. The fund will be managed by a team from Meeder Asset Management. The initial expense ratio will be 1.72% and the minimum initial investment is $2,500, reduced to $500 for IRAs.

TCW Developing Markets Equity Fund

TCW Developing Markets Equity Fund will seek long-term capital appreciation. The fund will invest in stocks and might invest in derivatives either to hedge or achieve their equity exposure. They’ll pick stocks based on the typical combination of quant and fundamental work; they’ll pick country exposure based on a bunch of macro factors. The fund will be managed by Ray S. Prasad, formerly of Batterymarch, and Andrey Glukhov. Expenses not revealed. The minimum initial investment will be $2000, reduced to $500 for tax-advantaged accounts.

Triad Small Cap Value Fund

Triad Small Cap Value Fund will seek long-term capital appreciation and attempt to minimize the probability of permanent losses over the longer-term, with less emphasis on short-term market fluctuations.  At base, they’re investing in small caps but willing to hold cash. The managers will be John Heldman, formerly a Neuberger Berman manager, and David Hutchison.  The fund’s opening expense ratio is listed as 1.XX%. That’s hard to argue with. The minimum initial investment will be $5,000.

Towle Deep Value Fund (TDVFX), May 2015

By David Snowball

Objective and strategy

The fund pursues long-term capital appreciation. They look to invest in a compact portfolio of 30-50 undervalued stocks. The fund is nominally all-cap but the managers have traditionally had the greatest success in identifying and investing in small cap stocks. The fund looks for “well-seasoned companies with strong market positions, identifiable catalysts for earnings improvement and [exceptional] management.” They have strong sector biases based on valuations but will not invest in tobacco, liquor, or gaming companies based on principle. For a small cap value fund, with predominantly domestic based holdings, it has unusually high exposure to international markets. They systematically track macro conditions and have the ability to move largely to cash as a defensive measure but have not done so.

Adviser

Towle & Co. Towle was founded in 1981 and is headquartered in St. Louis. They provide investment advice to institutional and private investors through the fund, partnerships and separately managed accounts. The firm had approximately $560 million in assets under management as of December 31, 2014.

Manager

The Fund’s portfolio is managed by an investment team comprised of J. Ellwood Towle, CEO, Christopher Towle, Peter Lewis, James Shields and Wesley Tibbetts. Together, they share responsibility for all day-to-day management, analytical and research duties. Other than Mr. Shields, the team has been in place since the fund’s inception. The team also manages two partnerships and about 75 separate accounts, all of which use the same strategy.

Strategy capacity and closure

The strategy’s capacity, in all vehicles, is viewed to be approximately $1 billion, but highly dependent on market conditions and opportunities. They have previously closed when they did not feel comfortable taking on new money.

Active share

98.6 “Active share” measures the degree to which a fund’s portfolio differs from the holdings of its benchmark portfolio. High active share indicates management which is providing a portfolio that is substantially different from, and independent of, the index. An active share of zero indicates perfect overlap with the index, 100 indicates perfect independence. An active share of 98.6 reflects a very high level of independence from its benchmark, the Russell 2000 Value index.

Management’s stake in the fund

The elder Mr. Towle has over $1 million in the fund and owns 6.5% of its shares, as of January 2015. The Towle family is the largest investor in the fund and in the strategy. The family has over 90% of their wealth invested in the strategy. All of the managers have invested in the fund. The younger Mr. Towle has between $50,000 and $100,000. Mr. Lewis has between $100,000 and $500,000.  Messr. Tibbetts and the newest manager, Messr. Shield, have modest investments. None of the trustees have invested in the fund, but then they oversee 76 funds and have virtually no investment in any of them.

Opening date

October 31, 2011. The underlying strategy has been in operation since January 1, 1982.

Minimum investment

$5,000, which is reduced to $2,500 for various tax-advantaged accounts.

Expense ratio

1.10% on assets of $108 million, as of July 2023. There’s also a 2% redemption fee on shares held fewer than 90 days.

Comments

There are two persistent investing anomalies worth noting. The first is “the value premium.” Value has persistently outperformed growth over the long-term in every size of stock. One 2013 essay claims that every Russell value index, everywhere in the world, in every sector, has outperformed its growth counterpart since inception. It’s true for the Russell 1000, 2000, 2500, Global 3000 ex-US, EMEA, Global ex-US ex-Japan, Global ex-US Large Cap, Greater China, Microcap, the whole shebang. In many instances, the long-term return from value investing is two or three times greater than in growth investing. Value investing is, in short, a free lunch in a business that swears that there are no free lunches.

The second anomaly is the almost no actively-managed value fund captures the value premium. That is, investors who bill themselves as dyed in the wool value guys have far wimpier performance than the theory says they should. Value funds tend to prevail over long periods but by less than you’d expect. That reflects the fact that very few of these guys invest in the sorts of deeply undervalued stocks that create the value premium. Instead, they’re sort of value-lite investors who liberally hedge their exposure to really cheap stocks with a lot of cheap relative to the rest of the market stocks. The reason’s simple: these stocks are cheap for a reason, they’re often fragile companies in out-of-favor industries and they have the potential to make investors in them look incredibly stupid for a painfully long stretch.

Few investors are willing to risk that sort of pain in pursuit of the full potential of deeply undervalued stocks. Towle & Co. is one of those few. They’ve managed to stick with their convictions because they haven’t had to worry a lot about skittish investors fleeing. In part that’s because they work really hard, mostly with separate account clients, to partner with investors who buy into the strategy. And, in part, it’s because they are their own biggest client: The Towle family has over 90% of their wealth invested in the strategy.  Happily, their convictions have reaped enormous gains for long-term investors.

While Towle assesses a wide variety of valuation metrics, a primary measure is price-to-sales. They focus on sales rather than earnings for two reasons. Topline measures like sales directly measure a firm’s vitality (are they able to sell more stuff at better prices each year?) which is important for a discipline that relies on buying robust growth at value prices. And topline measures like sales are harder to fudge than bottom line measures like earnings; a lot of financial engineering goes into “managing” earnings which makes them a less reliable measure.

Towle’s portfolio sports a price-to-sale ratio of 0.26 while its benchmark is four times pricier: 1.03. The Total Stock Market Index sells at 1.61, a 600% higher price. By that measure, only one other stock fund (out of 2300 domestic equity funds) has such a deeply undervalued portfolio. By measures such as price-to-book, Towle’s stocks sell at a 30% discount (0.91 versus 1.45) to its benchmark and a 65% discount (0.91 versus 2.52) to the broader stock market.

In the long term, this strategy has performed well. There are about two dozen small cap value funds with 20 year track records. Precisely one of those, the long-closed Bridgeway Ultra-Small Company Fund (BRUSX), has managed to outperform the Towle strategy. In the very long term, Towle has performed astonishingly well. Here are the stats for performance since the strategy’s inception in 1982:


Annualized return

$10,000 invested in ’82 would now be worth:

Towle Deep Value (net of fees)

16.0%

$2,400,000

Russell 2000 Value

12.4

590,000

S&P 500

11.7

470,000

That said, a free lunch is still not a free ride. Over shorter periods, and sometimes over quite lengthy periods, deep value stocks can remain stubbornly undervalued and unrewarding. While the strategy has a three decade track record, the mutual fund has been in operation for about four years and has married substantially above average returns with even more substantially above average volatility.


APR

Max
Drawdown,
%

Standard Deviation,
%/yr

Downside
Deviation,
%/yr

Ulcer
index

Sharpe
Ratio

Sortino
Ratio

Martin
Ratio

Towle Deep Value Fund

17.6

-14.6

18.1

11.5

5.1

0.97

0.53

0.50

Small Cap Value Group

15.9

-9.8

12.9

7.5

3.3

1.24

2.17

5.58

The fund’s sector concentration – lots of consumer cyclicals, energy and industrials but very little tech, pharma or utilities – contributes to the potential for short-term volatility. In addition, the managers occasionally make mistakes. Joe Bradley, one of the folks at Towle, says of the strategy’s 2011 performance, “we made some bad choices and we stunk it up.” Indeed the strategy posted three disastrous years this century in which they trailed their benchmark by double digits: 2000 (-1 versus +22.8), 2008 (-49.9 versus -28.9) and 2011 (-17.4 versus -5.5). Two of those three lagging years was then followed by phenomenal outperformance: 2001 (42.8% vs 14.0) and 2009 (101% vs 20.5). The portfolio, Mr. Bradley reports, became like a too-tightly compressed spring; when the rebound occurred, it was incredibly powerful.

Bottom Line

Towle Deep Value positions itself a “an absolute value fund with a strong preference for staying fully invested.” While most absolute value funds often pile up cash, Towle chooses to turn over more rocks – in under covered small caps and international markets alike – in order to find enough deeply undervalued stocks to populate the portfolio. The fund has the potential to play a valuable role in a long-term investor’s portfolio. Its focus is on a volatile and sometimes-despised corner of the market means that it’s not appropriate as a core holding but its distinctive strategy, sensible structure, steady discipline and outstanding long-term record makes it a serious contender for diversifying a portfolio heavily weighted in large cap stocks.

Fund website

Towle Deep Value Fund. It’s a pretty Spartan site. Folks seriously interested in understanding the strategy and its performance over the past 34 years would be better served by checking out the Towle & Co. website.

Fact Sheet

© Mutual Fund Observer, 2015. All rights reserved. The information here reflects publicly available information current at the time of publication. For reprint/e-rights contact us.

Seafarer Overseas Growth & Income (SFGIX/SIGIX), May 2015

By David Snowball

This fund profile was previously updated on March 1, 2013. You can find an archive of that profile here.

Download a .pdf of this profile here.

Objective and Strategy

Seafarer seeks to provide long-term capital appreciation along with some current income; it also seeks to mitigate volatility. The portfolio has two distinctive features. First, the fund invests a significant amount – 20-50% of its portfolio – in the securities of companies which are domiciled in developed countries but whose earnings are driven by emerging markets. The remainder is invested directly in developing and frontier markets. Second, the fund generally invests in dividend-paying common stocks but the portfolio might contain preferred stocks, convertible bonds, closed-end funds, ADRs and fixed-income securities. The fund typically has much more exposure to small- and mid-cap stocks than does its peers. On average, 80% of the portfolio is invested in common stock but that has ranged from 71% – 86%.

Adviser

Seafarer Capital Partners of San Francisco. Seafarer is a small, employee-owned firm that advises the Seafarer fund in the US and a €45 million French SICAV, Essor Asie Opportunités. The firm has about $190 million in assets under management, as of March 2015.

Managers

Andrew Foster is the manager, as well as Seafarer’s cofounder, CEO and CIO. Mr. Foster formerly was manager or co-manager of Matthews Asia Growth & Income (MACSX), Matthews’ research director and acting chief investment officer. He began his career in emerging markets in 1996, when he worked as a management consultant with A.T. Kearney, based in Singapore, then joined Matthews in 1998. Andrew was named Director of Research in 2003 and served as the firm’s Acting Chief Investment Officer during the height of the global financial crisis, from 2008 through 2009. Andrew is assisted by Kate Jacquet, Paul Espinosa and Sameer Agrawal. Ms. Jacquet has been with Seafarer since 2011; Messrs. Espinosa and Agrawal joined in 2014.

Management’s Stake in the Fund

Mr. Foster has over $1 million in the fund. None of the fund’s trustees have an investment in any of the 32 funds they oversee.

Opening date

February 15, 2012

Minimum investment

$100,000 for institutional share class accounts, $2,500 for regular retail accounts and $1000 for retirement accounts. The minimum subsequent investment is $500. In a spectacularly thoughtful gesture, individuals who invest directly with the fund and who establish an automatic investment plan on their accounts are eligible for a waiver of the institutional share class’s minimum investment requirement. The folks at Seafarer argue that they would like as many shareholders as possible to benefit from lower expenses, so they’re trying to manage an arrangement by which their institutional share class might actually be considered the “universal” share class.

Expense ratio

0.97% for retail shares and 0.87% for institutional shares, on assets of $2.4 Billion (as of July 2023).

Comments

Our contention has always been that Seafarer represents one of the best possible options for investors interested in approaching the emerging markets. It’s not a question of whether we’re right but, rather, of why we are.

Seafarer has three attributes that set it apart:

  1. Its approach is distinctive. Mr. Foster’s hope is to outperform his benchmark (the MSCI EM index) “slowly but steadily over time.” He describes the approach as a “relative return strategy” which pursues growth that’s more sustainable than what’s typical in developing markets while remaining value conscious. It’s grounded in the structural realities of the emerging markets.

    A defining characteristic of emerging markets is that their capital markets (including banks, brokerages and bond and stock exchanges) cannot be counted on to operate. In consequence, you’re best off with firms who won’t need to turn to those markets for capital needs. Seafarer targets (1) firms that can grow their top line steadily in the 7-15% per annum range and (2) those that can finance their growth internally. The focus on the top line means looking for firms that can increase revenues by 7-15% without obsessing about similar growth in the bottom line. It’s almost inevitable that EM firms will have “stumbles” that might diminish earnings for one to three years; while you can’t ignore them, you also can’t let them drive your investing decisions. “If the top line grows,” Mr. Foster argues, “the bottom line will follow.” The focus on internal financing means that the firms will be capable of funding their operations and plans without needing recourse to the unreliable external sources of capital.

    Seafarer tries to marry that focus on sustainable moderate growth “with some current income, which is a key tool to understanding quality and valuation of growth.” His preference is to buy dividend-paying stocks, but he often has 20% or more of the portfolio invested in other sorts of securities. The dividends are not themselves magical, but serve as “crude but useful” tools for identifying firms most likely to preserve value and navigate rough markets.

  2. Its performance is first rate. That judgment was substantiated in early March 2015 when Seafarer received its inaugural five-star rating from Morningstar. They’re also a Great Owl fund (as of May, 2015), a designation which recognizes funds whose risk-adjusted returns have finished in the top 20% of their peers for all trailing periods. Our greater sensitivity to risk, based on the evidence that investors are far less risk-tolerant than they imagine, leads to some divergence between our results and Morningstar’s: five of their five-star EM funds are not Great Owls, for instance, while some one-star funds are.

    Of 219 diversified EM funds currently tracked by Morningstar, 18 have a five-star rating (as of mid-March, 2015). 13 are Great Owls. Seafarer is one of only 10 EM funds (representing less than 5% of the peer group) that are both five-star and Great Owls.

  3. Its commitment to its shareholders is unmatched. Mr. Foster has produced consistently first-rate shareholder communications that are equally clear and honest about the fund’s successes and occasional lapses. And he’s been near-evangelical about reducing the fund’s expenses, often posting voluntary mid-year fee reductions as assets permit. Seafarer is one of the least expensive actively-managed EM funds available to retail investors.

In the three years through April 30, 2015, the fund’s annualized return was 10.8% which placed it in the top 2% of all EM equity funds. Rather than trumpet the fund’s success, Mr. Foster warned, both in letters to his shareholders and on the Observer’s conference call that investors should not expect such dominant returns in the future. “Our strategy ideally matches the anemic growth conditions that emerging markets have experienced lately,” he says. As growth returns, other strategies will have their day in the sun. Seafarer, meanwhile, will continue pursuing firms with sustainable rather than maximum growth.

Bottom Line

Mr. Foster is remarkably bright, thoughtful, experienced and concerned about the welfare of his shareholders. He thinks more broadly than most and has more experience than the vast majority of his peers. The fund offers him great flexibility and he’s using it well. There are few more-attractive emerging markets options available.

Fund website

Seafarer Overseas Growth and Income. The website is remarkably rich, both with analyses of the fund’s portfolio and performance, and with commentary on broader issues. One emblem of Mr. Foster’s commitment to having you understand what the fund is up to is a remarkably complete spreadsheet that provides month-by-month and year-by-year data on the portfolio, dating all the way back to the fund’s launch. Whether you’d like to know what percentage of the portfolio was invested in convertible shares in April 2014 or how the fund’s regional exposure affected its performance relative to its benchmark in 2013, the data’s there for you.

Disclosure

The Observer has no financial ties with Seafarer Funds. I do own shares of Seafarer and Matthews Asian Growth & Income (purchased during Andrew’s managership there) in my personal account.

© Mutual Fund Observer, 2015. All rights reserved. The information here reflects publicly available information current at the time of publication. For reprint/e-rights contact us.

Vanguard Global Minimum Volatility Fund (VMVFX), April 2015

By David Snowball

Objective and strategy

The fund seeks to provide long-term capital appreciation with low volatility relative to the global equity market. The managers use quantitative models to “construct a global equity portfolio that seeks to achieve the lowest amount of expected volatility subject to a set of reasonable constraints designed to foster portfolio diversification and liquidity.” It’s broadly diversified, with 340 stocks across all capitalizations and industry groups, with about 50% outside the U.S. The fund generally hedges most of its currency exposure to further reduce overall portfolio volatility.

Adviser

The Vanguard Group, Inc. Vanguard was founded by Jack Bogle in 1975 as a sort of crazed evangelical investing hobby. It now controls between $2.2 trillion and $2.7 trillion in assets and advises 170 mutual funds. Struck by Vanguard’s quarter trillion dollars of inflows in 2014, Morningstar’s John Rekenthaler recently mused about “what will happen when Vanguard owns everything.”

Manager

James D. Troyer, James P. Stetler, and Michael R. Roach co-manage the fund. Mr. Troyer and Mr. Stetler are Principals at Vanguard and all three have been with the fund since launch. Messrs. Troyer, Stetler, and Roach also co-manage all or a portion of 14 funds with total assets of $121 billion.

Strategy capacity and closure

Unknown.

Active share

“Active share” measures the degree to which a fund’s portfolio differs from the holdings of its benchmark portfolio. High active share indicates management which is providing a portfolio that is substantially different from, and independent of, the index. An active share of zero indicates perfect overlap with the index, 100 indicates perfect independence. Vanguard does not, however, make active share calculations public.

Management’s stake in the fund

As of October 31, 2014, Mr. Troyer had invested between $500,001–$1,000,000 in the fund while Mr. Roach had a minimal investment and Mr. Stetler had none at all. None of Vanguard’s trustees, each of whom oversees 178 funds, has invested in this fund. Oddly, the fund’s largest investor is Vanguard Managed Payout Fund (VPGDX) which owns 52% of it. Overall, Vanguard employees have invested more than $4.7 billion in their funds.

Opening date

December 12, 2013.

Minimum investment

$3,000

Expense ratio

0.21% on Investor class shares, on assets of about $2 Billion, as of July 2023.

Comments

The case for owning a consciously low-volatility stock fund comes down to two observations:

  1. Most options for reducing portfolio volatility are complicated, expensive and ineffective.

    Investors loathe equity managers who hold cash (“I’m not paying you 1.0% a year to buy CDs,” they howl), which is why there are so few managers willing to take the risk: of 2260 US equity funds, well under 100 have 15% or more in cash as of April 2015. Bonds are priced for long-term disappointment, which reduces the appeal of traditional 60/40 portfolios. Folks are much more prone to invest in “liquid alts” despite the fact that most combine untested teams, untested strategies, high expenses (the “multi-alternative” group averages 1.7-1.8%) and low returns (over most trailing periods, the multi-alt group returns between 3-4%).

    While we’ve tried to identify the few most-promising options in these areas, there’s an argument that for many investors simply investing in the right types of stocks makes a lot of sense, which brings us to …

  2. Low volatility stock portfolios substantially raise returns and reduce risk.

    The evidence here is remarkable. You’re taught in financial class that high risk assets have higher returns than low risk assets, simply because no one in their right mind would invest in a high risk game without the prospect of commensurately high returns. While that’s true between asset classes (stocks tend to return more than bonds which tend to return more than cash), it’s not true within the stock class. There’s a mass of research that shows that low volatility stocks are a free lunch, worldwide.

    There are different ways to constructing such a portfolio. The folks at Research Associates tested four different techniques against a standard market cap weighted index and found the same results everywhere, pretty much regardless of how you chose to choose your portfolio. In the US market, low vol stocks returned 156 basis points higher (134-182, depending) than did the market. In a global sample, the returns were 56 basis points higher (8-143, depending) but the risk was 30% lower. And in the emerging markets, the returns gain was huge – 203 basis points (97-407, depending) – and the volatility reduction was stunning, about a 50% lower volatility was achievable. “In all cases,” they concluded, “the risk reduction is economically and statistically significant.”

    Researchers at Standard & Poor’s found that the effect holds across all sizes of stocks, as well. Oddly, the record for large and small cap low volatility stocks is far more consistently positive than for mid-caps. Got no explanation for that.

    If the reduction in volatility keeps investors from fleeing the stock market at exactly the wrong moment, then the actual gains to investor portfolios might well be greater than the raw returns suggest.

Why is there a low volatility anomaly? That is, why are less risky stocks more profitable? The best guess is that it’s because they’re boring. No one is excited by them, no one writes excitedly about Church & Dwight (the maker of Arm & Hammer baking soda, Orajel and … well, Trojan condoms) or The Clorox Company. As a result, the stocks aren’t subject to getting bid frantically up and crashing down.

The case for using Vanguard Global Minimum is similarly straightforward:

  1. It’s Vanguard.

    That brings three advantages: it’s going to be run at-cost (30 bps, less than one-quarter of what their peers charge). It’s going to be disciplined. They argue that the “minimum” volatility moniker signals a more sophisticated approach than the simple, more-common “low volatility” strategy. Low-vol, they argue, is simply a collection of the lowest volatility stocks in a screening process; minimum volatility approaches the problem of managing the entire portfolio by accounting for factors such as correlations between the stocks, sector weights and over-exposure to less obvious risk factors such as currency or interest rate fluctuations. And it’s not going to be subject to “Great Man” risk since it’s team-managed by Vanguard’s Quantitative Equity Group.

  2. It’s global and broadly diversified.

    The managers work with a universe of 50 developed and emerging markets. Their expectation is that about half of the money, on average, will be in the US and half elsewhere. The portfolio is spread widely across various market caps (20% small- to micro-cap and 20% mega-cap) and valuations (30% value, 32% growth) and industries (though noticeably light on basic materials, tech and financials).

So far, at least in the fund’s first 15 months, it’s working. Our colleague Charles generated a quick calculation of the fund’s performance since inception (December, 2013) against its global peers. Here’s the summary:

vmnvx

Bottom Line

Minimum volatility portfolios allow you to harness the power of other investor’s stupidly: you get to profit from their refusal to bid up boring stocks as they choose, instead, to become involved in the feeding frenzy surrounding sexy biotechs. For investors interested in maintaining their exposure to stocks for the long run, using a global minimum volatility portfolio makes a lot of sense. Using a cheap, discipline one such as Vanguard Global Minimum Volatility makes the most sense for folks who want to pursue that course.

Fund website

Vanguard Global Minimum Volatility. The Vanguard site covers the basics, but doesn’t occur any particularly striking insights into the dynamics of low- or minimum-volatility investing. Happily there are a number of reasonably good reviews, mostly readable, of what you might expect from such a portfolio.

Feifei Li, Ph.D. and Philip Lawton, Ph.D., both of Research Associates, wrote True Grit: The Durable Low Volatility Effect (September 2014). The essay spends as much time on the question of whether the effect is sustainable as on the nature of the effect itself. They draw, in part, on a study of fund manager behavior: fund managers love to tell a dramatic story to clients and associates, which leads them to invest in stocks that … well, have drama. As a result, they subconsciously prefer risky stocks to safe ones. Li and Lawton conclude:

… it is reasonable to expect low volatility investing to persist in producing excess returns. The intensity of investors’ preferences may vary, but chasing outlier returns from stocks that are in vogue seems to be a steady habit … many people find it very hard to change their mindset, and they just don’t seem to learn from experience.

For those who really revel in the statistics, a larger Research Associates team, including the firm’s co-founder Jason Hsu, published a more detailed study of the findings in 2014. Because the web is weird, you can access a pdf of the published study by Googling the title but I can’t embed the link for you. However the pre-publication draft, dated December 2013, is available from the Social Sciences Research Network. Tzee-man Chow, Jason Hsu, Li-lan Kuo, and Feifei Li, A Study of Low-Volatility Portfolio Construction Methods, Journal of Portfolio Management (Summer 2014)

Aye Soe, director of index research and design, Standard & Poor’s, The Low-Volatility Effect: A Comprehensive Look (2012) is not particularly readable, but it delivers what it promises: a comprehensive presentation of the statistical research.

© Mutual Fund Observer, 2015. All rights reserved. The information here reflects publicly available information current at the time of publication. For reprint/e-rights contact us.

FPA Queens Road Small Cap Value (formerly Queens Road Small Cap Value), (QRSVX), April 2015

By David Snowball

At the time of publication, this fund was named Queens Road Small Cap Value.

Objective and strategy

The fund pursues long-term capital growth by investing, primarily, in a diversified portfolio of US small cap stocks. The advisor defines small cap in relation to the Russell 2000 Value Index; currently that means stocks with capitalizations under $3.3 billion. The portfolio is assembled by looking at stocks with low P/E and P/CF ratios, whose underlying firms have strong balance sheets and good management. The fund, which holds 39 common stocks and shares in one closed-end fund, is nominally non-diversified. The fund’s cash position is a residue of market opportunities. In times when the market is rich with opportunities, they deploy cash decisively. In 2009, for instance, they moved to under 3% cash. As markets have increasingly become richly-priced, the cash stake has grown. Over the past five years it has averaged 24% which is also where it stands in early 2015.

Adviser

Bragg Financial Advisors, headquartered in Charlotte, NC, just across from the Dowd YMCA. They used to be located on Queens Road. Bragg is a family firm with four Braggs (founder Frank as well as sons Benton, John and Phillips) and one son-in-law (manager Steven Scruggs) leading the firm. It has been around since the early 1970s, and manages approximately $850 million in assets. A lot of that is for 300 families in the Charlotte region.

Manager

Steven Scruggs, CFA. Mr. Scruggs has worked for BFA since 2000 and manages this fund and Queens Road Value (QRVLX). That’s about it. No separate accounts, hedge funds or other distractions. He does not have research analysts but the firm’s investment committee oversees the progress of the portfolio as a whole.

Strategy capacity and closure

Based on the liquidity of their holdings, that is their ability to get into and out of positions without disrupting the market, they anticipate about $800 million in capacity. They’d likely soft close the fund at $800 million and hard close it “not far north of that.”

Active share

“Active share” measures the degree to which a fund’s portfolio differs from the holdings of its benchmark portfolio. High active share indicates management which is providing a portfolio that is substantially different from, and independent of, the index. The advisor does not calculate active share for their funds. Mr. Scruggs argues that, “By the nature of our process, we’re not going to look like the index. Whether that’s a good thing or a bad thing, I can’t say.” Indeed, measured by sector weightings, the fund is demonstrably independent: the fund’s portfolio weights differ dramatically from its peer group in 10 of 11 industry sectors that Morningstar tracks.

Management’s stake in the fund

Mr. Scruggs has invested between $100,000 and $500,000 in the fund. Though modest in absolute terms, he explains that he has “the overwhelming bulk – 90-95% – of my liquid investments” in the two funds he manages. In addition, all of the fund’s independent trustees have invested in it; three of the four have investments in excess of $100,000. Especially given their modest compensation, that level of commitment is admirable, rare and helpful.

Opening date

June 13, 2002

Minimum investment

$2500 for regular accounts, $1000 for tax-sheltered accounts.

Expense ratio

1.24% on assets of $77 million.

Comments

Sometimes our greatest, and least understood, advantages, come from all of the things we don’t have. Like distractions. Second-guessers. Friends who talk us into trying hot new fashions. Or the fear of being canned if we make a mistake.

It’s sometimes dubbed “addition by subtraction.” Thomas Gray famously celebrated the virtue of being far from the temptation of the “in” crowd in his poem “Elegy Written in a Country Churchyard” (1751):

Far from the madding crowd’s ignoble strife
Their sober wishes never learn’d to stray;
Along the cool sequester’d vale of life
They kept the noiseless tenor of their way

How madding might the investment crowd be? Mr. Scruggs commends for your consideration a classic essay by Jeremy Grantham,  My Sister’s Pension Assets and Agency Problems. Mr. Grantham has been managing the pension investments for one of his sisters since 1968. She’s, in many ways, the ideal client: she’s not even vaguely interested in what the market has or has not been doing, she doesn’t meddle and isn’t going to fire him. That’s a far cry from the fate of most professional investors.

The central truth of the investment business is that investment behavior is driven by career risk. In the professional investment business we are all agents, managing other peoples’ money. The prime directive, as Keynes knew so well, is first and last to keep your job. To do this, he explained that you must never, ever be wrong on your own. To prevent this calamity, professional investors pay ruthless attention to what other investors in general are doing. The great majority “go with the flow,” either completely or partially. This creates herding, or momentum, which drives prices far above or far below fair price.

There are many other inefficiencies in market pricing, but this is by far the largest. It explains the discrepancy between a remarkably volatile stock market and a remarkably stable GDP growth, together with an equally stable growth in “fair value” for the stock market. This difference is massive – two-thirds of the time annual GDP growth and annual change in the fair value of the market is within plus or minus a tiny 1% of its long-term trend. The market’s actual price – brought to us by the workings of wild and wooly individuals – is within plus or minus 19% two-thirds of the time. Thus, the market moves 19 times more than is justified by the underlying engines!

Investors’ fears and fads feed off each other, they do what’s “hot” rather than what’s right, they chase the same assets and prices rise briskly. Until they don’t.

The success of the two small funds managed by Mr. Scruggs for Queens Road is remarkable. He has no fancy strategies or sophisticated portfolio tools. He measures a firm’s earnings and cash flow against normal, rather than abnormal, earnings. He tries to determine whether the management is likely able to continue growing earnings. If he sees a good margin of safety in the price, he buys. His preference is to be broadly diversified across sectors and industries to reduce the impact of sector-specific risks (such as oil price or interest rate changes). He won’t buy overpriced stocks just for the sake of obtaining sector exposure (he has no investments at all in five of Morningstar’s 11 sectors while his average peer has 24% of their portfolio in those sectors) but, on whole, he thinks broader exposure is more prudent than not. In the past year, his portfolio turnover has been zero. In short, he’s not trying to outsmart the market, he’s just trying to do his job: prudently compound his investors’ capital over time.

Mr. Scruggs believes that his fund will be competitive in healthy rising markets and superior in declining ones but will likely trail noticeably in frothy markets, those driven by investor frenzy rather than fundamentals. He anticipates that, across the entirety of a five-to-seven year market cycle, he’ll offer his investors somewhat better than average returns with much less heartburn.

So far he’s been true to his word. QRSVX has returned a solid 10.25% per year run inception through the end of 2014 while its benchmark made just 9% which greater volatility. A $10,000 investment at inception would have grown to $34,400 by April 2015 – about $4,000 more than his peers would have earned.

The question is: how does Queens Road stand up to the best funds, not just to the average ones. The short answer is: really quite well. The table below compares the performance of Queens Road to the three SCV funds that Morningstar designates as “the best of the best” and the low-cost default, Vanguard’s index. This data all reflects performance over the current market cycle, from the last peak in November 2007 to March 2015. For the sake of clarity, we’ve highlighted in blue the best performer in each category.

chart

What do we see?

  • All of the funds have been above-average performers, besting their SCV peer group by 0.2 – 1.7% per year.
  • Queens Road has strong absolute returns but the lowest absolute returns of the group.
  • Once risk is taken into account, however, Queens Road posts the best performance in every category. Its loss during the 2007-09 crash was smaller (Max Draw), its tendency to lose in falling markets (Downside Deviation) was smaller, and its risk-adjusted returns (Sharpe, Sortino, Martin and Return group) were all the best in class.

The advisor illustrates the same point by looking the fund’s performance during all of the quarters in which the Russell 2000 Value index fell:

qrsvx

For those counting, the fund outperformed its benchmark in nine of 10 down quarters.

When they don’t find stocks that are unreasonably cheap given their companies’ prospects, they let cash accumulate. As of the last portfolio disclosure, cash about 24% of the portfolio. That doesn’t reflect a market call, it simply reflects a shortage of stocks that offer a sufficient margin of safety:

[H]istory says we’re due for a pullback and we think it makes sense to be prepared. How do we prepare? As we’ve often said, by not making a drastic move in the portfolio. As esteemed money manager, Peter Lynch once said, “Far more money has been lost by investors trying to anticipate corrections than has ever been lost in corrections themselves.”

So why hasn’t he fallen into the trap that Mr. Grantham describes? That is, does he actually have a sustainable advantage as an investor? The fund’s 2014 Annual Report suggests three:

This is where we think we have an advantage …. First, we live in Charlotte, North Carolina, far away from the investment swirl and noise of New York, Boston or Chicago. Second, we are not a huge fund shop with a massive sales force/marketing division. Fall behind your peers for a few quarters, or heaven forbid, you lag for a couple of years at a big fund shop, and you’ve got the marketing guys in your office asking you, “What are you doing wrong? You gotta change something.” Third, we believe in our process. Collectively, our fund manager, investment committee, Board of Directors, and family have over $3 million of our own money invested in our Queens Road Funds … We understand the investment process. We are comfortable under-performing during certain periods. And we have the patience to stay the course.

Bottom Line

Most of us are best served by funds whose managers speak clearly, buy cautiously, sell rarely, and keep out of the limelight. It’s clear that thrilling funds are a disastrous move for most of us. The funds that dot the top of last year’s performance list have a real risk of landing on next year’s fund liquidation list. Investors who understand the significance of “for the long-term” in the phrase “stocks for the long-term” come to have patience with their portfolios; that patience willingness to let an investment play out over six years rather than six months distinguishes successful investors from the herd. Based on his record over the past 13 years, Mr. Scruggs has earned the designations patient, disciplined, successful. If you aspire to the same, the two Queens Road funds should surely be on your due-diligence list.

Fund website

Queens Road Small Cap Value fund

© Mutual Fund Observer, 2015. All rights reserved. The information here reflects publicly available information current at the time of publication. For reprint/e-rights contact us.

April 2015, Funds in Registration

By David Snowball

American Beacon Ionic Strategic Arbitrage Fund

American Beacon Ionic Strategic Arbitrage Fund will pursue capital appreciation with low volatility and reduced correlation to equities and interest rates. The plan is to pursue a series of arbitrage strategies: Convertible Arbitrage (40-50% of the portfolio), Credit/Rates Relative Value Arbitrage (20-30%), Equity Arbitrage (30-40%) and Volatility Arbitrage (5-15%). This strategy is currently operating as a hedge fund, Iconic Absolute Return Fund LLC, which made 3% in 2014. The fund will be managed by the Iconic team that runs the hedge fund. The opening expense ratio will be 1.98%. The minimum initial investment will be $2500 for the no-load Investor class shares.

Artisan Developing World Fund

Artisan Developing World Fund (ARTYX) will pursue long-term capital appreciation. The plan is to invest in “self-funding companies that are exposed to the growth potential of developing world economies with limited dependence on foreign capital.” The notion is that capital flight represents a serious risk; by investing in firms not dependent on outside, especially foreign, capital, the manager seeks to mitigate the risk. The fund will be managed by Lewis Kaufman who had been managing the five-star, $2.8 billion Thornburg Developing World Fund (THDAX). The opening expense ratio will be 1.50% on Investor class shares. There’s also a 2.0% redemption fee on shares held fewer than 90 days. The minimum initial investment will be $1,000; Artisan will waive the minimum if you establish (as you should) an automatic investing plan.

Aspiration US Sustainable Equity Fund

Aspiration US Sustainable Equity Fund will try to  maximize total return, consisting of capital appreciation and current income. The plan is to invest in the stocks of firms that pass their ESG screens. They’ve established a 5% threshold for exclusion: if more than 5% of your earnings come from GMOs or plastic water bottles, for example, they won’t invest in you. The fund will be managed by Bruno Bertocci and Thomas J. Digenan, both of UBS. The opening expense ratio has not been announced. The minimum initial investment will be $500. (Wow.)

Emerald Small Cap Value Fund

Emerald Small Cap Value Fund will pursue long-term capital appreciation by investing in a non-diversified portfolio of US small cap stocks. Their size universe is equivalent to the Russell 2000 Value Index’s. Up to 20% might be REITs or foreign small caps purchased through ADRs. This is a reorganization of the former Elessar Small Cap Value Fund (LSRIX) which has been around and only modestly successful since 2012. The fund will be managed by Richard Geisen and Ori Elan, the same duo that managed LSRIX. Mr. Geisen has over $200,000 in his fund while Mr. Elan has been $50,000-100,000. The opening expense ratio has not been disclosed. The minimum initial investment will be $2000, reduced to $1000 for tax-advantaged accounts.

Lazard Emerging Markets Equity Advantage Portfolio

Lazard Emerging Markets Equity Advantage Portfolio will pursue long-term capital appreciation. The plan is to invest in an emerging markets equity portfolio which might include common stocks ADRs, GDRs, EDRs, REITs, warrants and other derivatives. The fund will be managed by a team headed by Paul Moghtader. The opening expense ratio will be 1.40% for the no-load “Open” shares. The minimum initial investment is $2500.

Lazard International Equity Advantage Portfolio

Lazard International Equity Advantage Portfolio will pursue long-term capital appreciation. The plan is to invest in a global equity portfolio, but one which “typically focus[es] on securities of non-US developed market companies.” They can invest in stocks, ETFs, warrants and depositary rights (e.g., ADRs). They will be able to use various derivatives to hedge the portfolio. The fund will be managed by a team headed by Paul Moghtader. The opening expense ratio will be 1.20% for the no-load “Open” shares. The minimum initial investment is $2500.

Lazard Managed Equity Volatility Portfolio

Lazard Managed Equity Volatility Portfolio  will pursue long-term capital appreciation. The plan is to use a bunch of quantitative screens to create a global portfolio equity portfolio with low volatility and attractive risk-return characteristics. The fund will be managed by a team headed by Paul Moghtader. The opening expense ratio will be 1.05% for the no-load “Open” shares. The minimum initial investment is $2500.

PIMCO Real Return Limited Duration Fund

PIMCO Real Return Limited Duration Fund will pursue maximum real return, consistent with preservation of capital and prudent investment management. The plan is to invest in a global portfolio of sovereign and corporate inflation-indexed securities of varying maturities. The fund will normally limit its foreign currency exposure to 20% but might go as high as 30%. 10% of the portfolio might be invested in emerging markets and 10% might be invested in junk bonds. And the entire portfolio might be invested in derivatives. The fund will be managed by some as-yet unnamed person or persons.  The opening expense ratio is, likewise, not set . The minimum initial investment for the “D” share classes will be $1,000.

Northern Global Tactical Asset Allocation (BBALX), March 2015

By David Snowball

This profile has been updated. Find the new profile here.

Objective

The fund seeks a combination of growth and income. Northern Trust’s Investment Policy Committee develops tactical asset allocation recommendations based on economic factors such as GDP and inflation; fixed-income market factors such as sovereign yields, credit spreads and currency trends; and stock market factors such as domestic and foreign earnings growth and valuations. The managers execute that allocation by investing in other Northern funds and ETFs. As of 12/30/2014, the fund held three Northern funds and eight ETFs.

Adviser

Northern Trust Investments is part of Northern Trust Corp., a bank founded in 1889. The parent company provides investment management, asset and fund administration, fiduciary and banking solutions for corporations, institutions and affluent individuals worldwide. As of June 30, 2014, Northern Trust had assets under custody of $6.0 trillion, and assets under investment management of $924.4 billion. The Northern funds account for about $52 billion in assets. When these folks say, “affluent individuals,” they really mean it. Access to Northern Institutional Funds is limited to retirement plans with at least $30 million in assets, corporations and similar institutions, and “personal financial services clients having at least $500 million in total assets at Northern Trust.” Yikes. There are 42 Northern funds, nine sub-advised by multiple institutional managers.

Managers

Daniel Phillips, Robert Browne and James McDonald. Mr. Phillips joined Northern in 2005 and became co-manager in April, 2011. He’s one of Northern’s lead asset-allocation specialists. Mr. Browne joined as chief investment officer of Northern Trust in 2009 after serving as ING’s chief investment officer for fixed income. Mr. McDonald, Northern Trust’s chief investment strategist, joined the firm in 2001. This is the only mutual fund they manage.

Management’s Stake in the Fund

Northern Trust representatives report that, “that the SAI update will show Bob Browne and Jim McDonald each own BBALX shares in the $100,001-$500,000 range, and Daniel Phillips owns shares in the $1-$10,000 range.” Only one of the fund’s nine trustees has invested in it, though most have substantial investments across the fund complex. 

Opening date

Northern Institutional Balanced, this fund’s initial incarnation, launched in July 1, 1993. On April 1, 2008, this became an institutional fund of funds with a new name, manager and mission and offered four share classes. On August 1, 2011, all four share classes were combined into a single no-load retail fund.

Minimum investment

$2500, reduced to $500 for IRAs and $250 for accounts with an automatic investing plan.

Expense ratio

0.64%, after waivers, on assets of $79 million.

Comments

When we reviewed BBALX in 2011 and 2012, Morningstar classified it as a five-star moderate allocation fund. We made two points:

  1. It’s a really intriguing fund
  2. But it’s not a moderate allocation fund; you’ll be misled if you judge it against that group.

Here we are in 2015, following up on BBALX. Morningstar now classifies it as a two star moderate allocation fund. We’d like to make two points:

  1. It’s a really intriguing fund.
  2. But it’s not a moderate allocation fund; you’ll be misled if you judge it against that group.

We’ll take those points in order.

It’s a really intriguing fund. As the ticker implies, BBALX began life is a bland, perfectly respectable balanced fund that invests in larger US firms and investment grade US bonds. Northern’s core clientele are very affluent people who’d like to remain affluent, so Northern tends toward “A conservative investment approach . . . strength and stability . . . disciplined, risk-managed investment . . .” which promises “peace of mind.” The fund was mild-mannered and respectable, but not particularly interesting, much less compelling.

In April 2008, the fund morphed from conservative balanced to a global tactical fund of funds. At a swoop, the fund underwent a series of useful changes.

The strategic or “neutral” asset allocation became more aggressive, with the shift to a global portfolio and the addition of a wide range of asset classes.

Tactical asset allocation shifts became possible, with an investment committee able to substantially shift asset class exposure as opportunities changed.

Execution of the portfolio plan was through index funds and, increasingly, factor-tilted ETFs, mostly Northern’s FlexShare products. For any given asset class, the FlexShare ETFs modestly overweight factors such as dividends, quality and size which predict long-term outperformance.

Both the broadened strategic allocation and the flexibility of the tactical shifts have increased shareholder returns and reduced their risk. Compared to a simple benchmark of 60% global stocks/40% bonds, the strategic allocation adds about 50 basis points of return (4.4% vs 3.9, since inception) while reducing volatility by about 70 bps (11.6% versus 12.3%). The tactical shifts have produced dramatic improvements, adding 110 bps of return while trimming 100 bps of volatility.

trailing

In short, Northern has managed since inception to produce about 40% more upside than a global balanced benchmark while suffering about 15% less volatility.

But it’s not a moderate allocation fund. Morningstar’s moderate allocation group is dominated by funds like the pre-2008 BBALX; lots of US large caps, lots of intermediate term, investment grade bonds and little prospect for distinction. That’s an honorable niche but it is not a fair benchmark for BBALX. A quick comparison of the portfolios highlights the difference:


BBALX

Moderate Allocation Group

U.S. equity

19%

47

Developed non U.S. equity

15

10

Emerging markets

5

1.5

Bonds

43

31

“Other” assets, which might include commodities, global real estate, gold, and other real asset plays

17

2

Cash

1

7

Average market cap

$15 billion

$46 billion

Dividend yield

3.3%

2.2%

When US markets dominate, as they have in four of the past five years, funds with a strong home bias will typically outperform those with a global portfolio.

With BBALX, you get a truly global asset allocation, disciplined management and remarkably low operating and trading expenses.

Over longer period, the larger opportunity set available to global investors – assuming that they’re not offset by higher expenses – gives them a distinct and systemic advantage. With BBALX, you get a truly global asset allocation, disciplined management and remarkably low operating and trading expenses. 

The strength of the fund is more evident when you make more valid comparisons. Morningstar purports to offer up “the best of the best of the best, sir!” in the form of the Gold-rated funds and its “best of the best of the rest” in its Silver funds. Using the Observer’s premium Multisearch Tool, we generated a comparison of BBALX against the only Gold fund (BlackRock Global Allocation) and the four Silver funds in Morningstar’s global allocation group.

Over both the full market cycle (November 2007-present) and the upmarket cycle (March 2009-present), BBALX is competitive with the best global allocation funds in existence. Here are the full-cycle risk-return metrics:

full cycle risk return

Here’s how to read the table: the three ratios at the end measure risk-adjusted returns. For them, higher is better. The Maximum Drawdown, Downside Deviation and Ulcer Indexes are measures of risk. For them, lower is better. APR is the annual percentage return. In general, your best investments over the period – the GMO funds – aren’t available to mere mortals, they require minimum investments of $10 million. Northern has been a better investment than either BlackRock or Capital Income Builder.

The pattern is similar if we look just at the rebound from the market bottom in 2009. Ivy, not available in 2007, gets added to the mix. GMO leads while BBALX remains one of the best options for retail global investors.

since 09

In short, the fund’s biggest detriment is that it’s misclassified, not that it’s underperforming.

Bottom Line

There is a very strong case to be made that BBALX might be a core holding for two groups of investors. Conservative equity investors will be well-served by its uncommonly broad diversification, risk-consciousness and team management. Young families or investors looking for their first equity fund would find it one of the most affordable options, no-load with low expenses and a $250 minimum initial investment for folks willing to establish an automatic investment plan. Frankly, we know of no comparable options. This remains a cautious fund, but one which offers exposure to a diverse array of asset classes. It has used its flexibility and low expenses to outperform some very distinguished competition. Folks looking for an interesting and affordable core fund owe it to themselves to add this one to their short-list.

Fund website

Northern Global Tactical Asset Allocation.  Northern has an exceptional commitment to transparency and education; they provide a lot of detailed, current information about what they’re up to in managing the fund. A pretty readable current introduction is 2015 Outlook: Watching our Overweights (12/2014).

Disclosure:

I have owned shares of BBALX in my personal portfolio for about three years. My intent is to continue making modest, automatic monthly additions.

© Mutual Fund Observer, 2015. All rights reserved. The information here reflects publicly available information current at the time of publication. For reprint/e-rights contact us.

Pinnacle Value (PVFIX), March 2015

By David Snowball

Objective

Pinnacle Value seeks long-term capital appreciation by investing in small- and micro-cap stocks that it believes trade at a discount to underlying earnings power or asset values. It might also invest in companies undergoing unpleasant corporate events (companies beginning a turnaround, spin-offs, reorganizations, broken IPOs) as well as illiquid investments. It also buys convertible bonds and preferred stocks which provide current income plus upside potential embedded in their convertibility. The manager writes that “while our structure is a mutual fund, our attitude is partnership and we built in maximum flexibility to manage the portfolios in good markets and bad.”

Adviser

Bertolet Capital of New York. Bertolet has $83 million in assets under management, including this fund and one separate account.

Manager

John Deysher, Bertolet’s founder and president. From 1990 to 2002 Mr. Deysher was a research analyst and portfolio manager for Royce & Associates. Before that he managed equity and income portfolios at Kidder Peabody for individuals and small institutions. The fund added an equities analyst, Mike Walters, in January 2011 who is also serving as a sort of business development officer.

Strategy capacity and closure

The strategy’s maximum capacity has not been formally determined. It’s largely dependent on market conditions and the availability of reasonably priced merchandise. Mr. Deysher reports “if we ever reach the point where Fund inflows threaten to dilute the quality of investment ideas, we’ll close the Fund.” Given his steadfast and enduring commitment to his investment discipline, I have no doubt that he will.

Active share

99%. “Active share” measures the degree to which a fund’s portfolio differs from the holdings of its benchmark portfolio. High active share indicates management which is providing a portfolio that is substantially different from, and independent of, the index. An active share of zero indicates perfect overlap with the index, 100 indicates perfect independence. Pinnacle’s active share is typically between 98.5-99%, indicating an exceedingly high level of independence.

Management’s stake in the fund

Mr. Deysher has in excess of $1,000,000 in the fund, making him the fund’s largest shareholder. He also owns the fund’s advisor. Two of the fund’s three independent directors have invested over $100,000 in the fund while one has only a nominal investment, as of the May 2014 Statement of Additional Information.

Opening date

April Fool’s Day, 2003.

Minimum investment

$2500 for regular accounts and $1500 for IRAs. The fund is available through TD Ameritrade, Fidelity, Schwab, Vanguard and other platforms.

Expense ratio

1.32%, after waivers, on assets of $31.4 million, as of July 2023. There is a 1% redemption fee for shares held less than a year.

Comments

By any rational measure, for long-term investors Pinnacle Value is the best small cap value fund in existence.

There are two assumptions behind that statement:

  1. Returns matter.
  2. Risk matters more.

The first is self-evident; the second requires just a word of explanation. Part of the explanation is simple math: an investment that falls by 50% must subsequently rise by 100% just to break even. Another part of the explanation comes from behavioral psychology. Investors are psychologically ill-equipped to deal with risk: we hate huge losses and we react irrationally in the face of them but we refuse to believe that they’re going to happen to us, so we rarely act appropriately to mitigate them. In good times we delude ourselves into thinking that we’re not taking on unmanageable risks, then they blow up and we sit for years in cash. The more volatile the asset class, the greater the magnitude of our misbehavior.

If you’re thinking “uh-uh, not me,” you need to go buy Dan Kahneman’s Thinking, Fast and Slow (2013) or James Montier’s The Little Book of Behavioral Investing (2010). Kahneman won the Nobel Prize for his work on the topic, Montier is an asset allocation strategist with GMO and used to be head of Global Strategy at Société Générale.

John Deysher does a better job of managing risks in pursuit of reasonable returns than any other small cap manager. Since inception, Pinnacle Value has returned about 9.9% annually. 

Using the Observer’s premium MultiSearch tool, we were able to assess the ten-year risk adjusted performance of every small cap value fund. Here’s what we found:


Pinnacle

Coming in second

Maximum Drawdown, i.e. greatest decline

25%, best in class

Heartland Value Plus, 38.9%

Standard deviation

8%, best in class

Queens Road SCV, 15.6%

Downside deviation

5.2%, best in class

Queens Road SCV, 10.4%

Ulcer Index, which combines the magnitude of the greatest loss with the amount of time needed to recover from it

6.0, best in class

Perkins Small Cap Value, 9.2

Sharpe ratio, the most famous calculation which balances returns against volatility

0.75, best in class

0.49, AllianzGI NFJ Small-Cap Value

Sortino ratio, a refinement of the Sharpe ratio that targets downside volatility

1.15, best in class

0.71, Perkins Small Cap Value

Martin ratio, a refinement that targets returns against the size of a fund’s drawdowns

1.01, best in class

0.81, Perkins Small Cap Value

Those rankings are essentially unchanged even if we look only at results for the powerful Upmarket cycle that began in March 2009: Pinnacle returned an average of 11.4% annually during the cycle, with the group’s best performance in six of the seven measures above. It’s fourth of 94 on the Martin ratio.

We reach the same conclusion when we compare Pinnacle just against Morningstar’s “Gold” rated small cap value funds and Vanguard’s SCV index. Again, these are the 10-year numbers:

pinnacle 10yr

So what does he actually do?

The short version: he buys very good, very small companies when their stocks are selling at historic lows. Pinnacle looks for firms with strong balance sheets since small firms have fewer buffers in a downturn than large ones do, management teams that do an outstanding job of allocating capital including their own, and understandable businesses which tends to keep him out of tech, bio-tech and other high obsolescence industries.

For each of the firms they track, they know what qualifies as the “fire sale” price of the stock, typically the lowest p/e or lowest price/book ratios at which the stock has sold. When impatient investors offer quality companies at fire sale prices, Mr. Deysher buys. When they demand higher prices, he waits.

There’s an old saying, Wall Street is the place where the patient take from the impatient. Impatient investors tend to make mistakes. We are there to exploit those mistakes. We are very patient. When we find a compelling value, we step up quickly. That reflects the fact that we’re very risk adverse, not action adverse. John Deysher

His aspiration is to be competitive in rising markets and to substantially outperform in falling ones. That’s pretty much was his ten-year performance chart shows. Pinnacle is the blue line levitating over the 2008 crash; his peer group is in orange.

pinnacle chart

Pinnacle’s portfolio is compact, at 37 names.  Since fire sales are relatively rare, the fund generally sits between 40-60% in cash though he’s been willing to invest substantial amounts of that cash in a relatively short period. Many of his holdings are incredibly small; of 202 small cap value funds, only five have smaller average market caps. And many of the holdings are unusual, even by the standard of microcap value funds. Some trade over-the-counter and for some he’s virtually the only mutual fund holding them. He also owns seven closed-end funds as arbitrage plays: he bought them at vast discounts to their NAVs, those discounts will eventually revert to normal and provide Pinnacle with a source of market-neutral gain.

Bottom line

The small cap Russell 2000 index closed February 2015 at an all-time high. An investment made six years ago – March 2009 – in Vanguard’s small cap index has almost quadrupled in value. GMO calculates that U.S. small caps are the most overvalued equity class they track. If investors are incredibly lucky, prices might drift up or stage a slow, orderly decline. If they’re less lucky, small cap prices might reset themselves 40% below their current level. No one knows what path they’ll take. So Dirty Harry brings us to the nub of the matter:

You’ve gotta ask yourself one question: “Do you feel lucky?” Well, do ya, punk?

Mr. Deysher would prefer to give his investors the opportunity to earn prudent returns, sleep well at night and, eventually, profit richly from the irrational behavior of the mass of investors. Over the past decade, he’s pulled that off better than any of his peers.

Fund website

Pinnacle Value Fund. Yuh … really, John’s not much into marketing, so the amount of information available on the site is pretty limited. Jeez, we’ve profiled the fund twice before and never even made it to his “In the News” list. And while I’m pretty sure that the factsheet was done on a typewriter…. After two or three hours’ worth of conversations over the years, it’s clear that he’s a very smart and approachable guy. He provides his direct phone number on the factsheet. If I were an advisor worried about how long the good times will last and how to get ahead of events, I’d likely call him.

Fact Sheet

© Mutual Fund Observer, 2015. All rights reserved. The information here reflects publicly available information current at the time of publication. For reprint/e-rights contact us.