Category Archives: Stars in the shadows

Small funds of exceptional merit

AMG River Road International Value Equity Fund (formerly AMG / River Road Long-Short), (ARLSX), February 2014

By David Snowball

At the time of publication, this fund was named ASTON / River Road Long-Short.
This fund was previously profiled in June 2012. You can find that profile here.
This fund was formerly named AMG River Road Long-Short Fund.

On August 16, 2021 AMG River Road Long-Short Fund became 
AMG River Road International Value Equity Fund. At that point,
everything changed except the fund's ticker symbol: new strategies, 
new management team, new risks, new benchmark. As a result,
the analysis below is for archival purposes only. Do not rely
on it as a guide to the current fund's prospects or practices. 

Objective and Strategy

ARLSX seeks to provide absolute returns (“equity-like returns,” they say) while minimizing volatility over a full market cycle. The fund invests, long and short, mostly in US common stocks but can also take positions in foreign stock, preferred stock, convertible securities, REITs, ETFs, MLPs and various derivatives. The fund is not “market neutral” and will generally be “net long,” which is to say it will have more long exposure than short exposure. The managers have a strict, quantitative risk-management discipline that will force them to reduce equity exposure under certain market conditions.

Adviser

Aston Asset Management, LP, which is based in Chicago. Aston’s primary task is designing funds, then selecting and monitoring outside management teams for those funds. As of December 31, 2013, Aston is the adviser to 23 mutual funds with total net assets of approximately $15.9 billion. Affiliated Managers Group (AMG) has owned a “substantial majority” of Aston for years. In January 2014 they exercised their right to purchase the remainder of the company. AMG’s funds will be reorganized under Aston, but Aston’s funds will maintain their own identity. AMG, including Aston, has approximately $73 billion in assets across 62 mutual funds and sub-advised products.

Managers

Matt Moran and Daniel Johnson. Both work for River Road Asset Management, which is based in Louisville. They manage $10 billion for a variety of private clients (cities, unions, corporations and foundations) and sub-advise six funds for Aston, including the splendid (and closed) Aston/River Road Independent Value (ARIVX). River Road employs 19 investment professionals. Mr. Moran, the lead manager, joined River Road in 2007, has about a decade’s worth of experience and is a CFA. Before joining River Road, he was an equity analyst for Morningstar (2005-06), an associate at Citigroup (2001-05), and an analyst at Goldman Sachs (2000-2001). His MBA is from the University of Chicago. Mr. Johnson is a CPA and a CFA. Before joining River Road in 2006, he worked at PricewaterhouseCoopers.

Strategy capacity and closure

Between $1 and $1.5 billion.

Management’s Stake in the Fund

Mr. Moran and Mr. Johnson had between $100,000 and $500,000 as of the last-filed Statement of Additional Information (October 30, 2012). Those investments represent a significant portion of the managers’ liquid net worth.

Opening date

May 4, 2011.

Minimum investment

$2,500 for regular accounts and $500 for retirement accounts.

Expense ratio

1.70%, after waivers, on assets of $220 million. The fund’s operating expenses are capped at 1.70%, but expenses related to shorting add another 1.46%. Expenses of operating the fund, before waivers, are 5.08%.

Comments

When we first wrote about ARLSX eighteen months ago, it had a short public record and just $5.5 million in assets. Nonetheless, after a careful review of the managers’ strategy and a long conversation with them, we concluded:

[F]ew long-short funds are more sensibly-constructed or carefully managed than ARLSX seems to be.  It deserves attention. 

We were right. 

River Road’s long-short equity strategy is manifested both in ARLSX and in a variety of institutional accounts. Here are the key metrics of that strategy’s performance, from inception through December 30, 2013.


River Road

Long-short category

Annualized return

13.96

5.88

% of positive months

74

64

Upside capture

58

39

Downside capture

32

52

Maximum one-month drawdown

(3.5)

(4.2)

Maximum drawdown

(7.6)

(11.8)

Sharpe ratio

2.3

1.0

Sortino ratio

3.9

0.9

How do you read that chart? Easy. The first three measure how the managers perform on the upside; higher values are better. The second three reveal how they perform on the downside; lower values are better. The final two ratios reflect an assessment of the balance of risks and returns; again, higher is better.

Uhhh … more upside, less downside, far better overall.

The Sharpe and Sortino ratios bear special attention. The Sharpe ratio is the standard measure of a risk/return profile and its design helped William Sharpe win a Nobel Prize for economics. As of December 31, 2013, River Road had the highest Sharpe ratio of any long-short strategy. The Sortino ratio refines Sharpe, to put less emphasis on overall volatility and more on downside volatility. The higher the Sortino ratio, the lower the prospects for a substantial loss.

After nearly three years, ARLSX seems to be getting it right and its managers have a pretty cogent explanation for why that will continue to be the case.

In long stock selection, their mantra is “excellent companies trading at compelling prices.” Between 50% and 100% of the portfolio is invested long in 15-30 stocks. They look for fundamentally attractive companies (those with understandable businesses, good management, clean balance sheets and so on) priced at a discount to their absolute value. 

In short stock selection, they target “challenged business models with high valuations and low momentum.” In this, they differ sharply from many of their competitors. They are looking to bet against fundamentally bad companies, not against good companies whose stock is temporarily overpriced. They can be short with 10-90% of the portfolio and typically have 20-40 short positions.

Their short universe is the mirror of the long universe: lousy businesses (unattractive business models, dunderheaded management, a history of poor capital allocation, and favorites of Wall Street analysts) priced at a premium to absolute value.

Finally, they control net market exposure, that is, the extent to which they are exposed to the stock market’s gyrations. Normally the fund is 50-70% net long, though exposure could range from 10-90%. The extent of their exposure is determined by their drawdown plan, which forces them to react to reduce exposure by preset amounts based on the portfolio’s performance; for example, a 4% decline requires them to reduce exposure to no more than 50. They cannot increase their exposure again until the Russell 3000’s 50 day moving average is positive. 

This sort of portfolio strategy is expensive. A long-short fund’s expenses come in the form of those it can control (fees paid to management) and those it cannot (expenses such as repayment of dividends generated by its short positions). At 3.1%, the fund is not cheap but the controllable fee, 1.7% after waivers, is well below the charges set by its average peer. With changing market conditions, it’s possible for the cost of shorting to drop well below 1% (and perhaps even become an income generator). With the adviser absorbing another 2% in expenses as a result of waivers, it’s probably unreasonable to ask for lower.

Bottom Line

Messrs. Moran and Johnson embrace Benjamin Graham’s argument that “The essence of investment management is the management of risks, not the management of returns.” With the stock market up 280% from its March 2009 lows, there’s rarely been a better time to hedge your gains and there’s rarely been a better team to hedge them with.

Fund website

ASTON / River Road Long-Short Fund

Disclosure

By way of disclosure, while the Observer has no financial relationship with or interest in Aston or River Road, I do own shares of ARLSX in my own accounts.

© Mutual Fund Observer, 2014. All rights reserved. The information here reflects publicly available information current at the time of publication. For reprint/e-rights contact us.

Aegis Value (AVALX), December 2013

By David Snowball

THIS IS AN UPDATE OF THE FUND PROFILE ORIGINALLY PUBLISHED BY Fund Alarm IN May 2009. YOU CAN FIND THAT ORIGINAL PROFILE HERE.

Objective and strategy

The fund seeks long-term capital appreciation by investing in a diversified portfolio of very, very small North American companies.  They look for stocks that are “significantly undervalued” given fundamental accounting measures including book value, revenues, or cash flow.  They define themselves as “deep value investors.”  While the fund invests predominantly in microcap stocks, it does have the authority to invest in an all-cap portfolio if that ever seems prudent.  The portfolio is distinctive. It holds about 70 stocks and trades them half as often as its peers.  Its market cap is one-quarter that of its small-value peers.  89% of the portfolio is invested in US firms, with about 8% in Canadian and 3% in British firms.

Adviser

Aegis Financial Corporation of McLean, Virginia, is the Fund’s investment advisor. Aegis has been in operation since 1994 and has advised the fund since inception in 1998. It also manages more than 100 private accounts and Aegis High Yield (AHYFX).

Manager

Scott L. Barbee, CFA, is portfolio manager of the fund and a Managing Director of AFC. He was a founding director and officer of the fund and has been its manager since inception. He’s also a portfolio manager for Aegis High Yield and approximately 110 equity account portfolios of other AFC clients managed in an investment strategy similar to the Fund with a total value of approximately $100 million. Mr. Barbee received an MBA degree from the Wharton School at the University of Pennsylvania.

Strategy capacity and closure

Aegis Value closed to new investors in late 2004, when assets in the fund reached $750 million.  The manager estimates that, under current conditions, the strategy could accommodate nearly $1 billion.  It is currently about $410 million when separate accounts are included.

Management’s stake in the fund

As of September 30, 2013, Aegis employees owned more than $20 million of Fund shares. The vast majority of that investment is held by Mr. Barbee and his family.  Each of the fund’s directors, though very modestly compensated, has a large stake in the fund.

Opening date

May 15, 1998

Minimum investment

$10,000 for regular accounts and $5,000 for retirement accounts.

Expense ratio

1.50% on assets of $332 million, as of June 2023. 

Comments

Aegis Value must surely give the folks at Morningstar a headache.  It’s been a one-star fund, it’s been a five-star fund and it’s been everything in-between.  Its assets in 2009 were a tenth of what they were in 2004 but its assets now are nearly six times what they were in 2009.

That is, on face, a very odd pattern for a very consistent fund.  It’s had the same manager, Scott Barbee, since launch.  He’s pursued the same investing discipline and he’s applied to it the same small universe of stocks.

What might you need to know about Aegis Value as you undertake your due diligence?  Three things come immediately to mind.

First, the fund has the potential to make a great deal of money for its investors.  A $10,000 investment made at the fund’s 1998 launch would have grown to $59,800 by late November 2013.  That same investment in its small value peers would have grown to $34,900.  That translates to an annualized return of 12.2% since inception here, 8.0% at the average small-value fund.  That’s not a perfectly fair comparison, ultra-small companies are different: benchmarking them against either small- or micro-cap companies leads to spurious conclusions.  By way of simple example, Aegis completely ignored the bear market for value stocks in the late 1990s and the bear market for everybody else at the beginning of this century.  Since inception, it has handsomely outperformed other ultra-small funds, such as Franklin Microcap Value (FRMCX) and Bridgeway Ultra-Small Company Market (BRSIX).  In the past five years, its total return has been almost 2:1 greater than theirs.

Second, ultra-small companies are explosive.  Over the past five years, the fund has booked double-digit quarterly returns on 11 occasions.  It has risen by as much as 48% in three months and has fallen by as much as 20%.   During the October 2007 – March 2009 meltdown, AVALX lost 68.9%.  That did not reflect the fundamental values of the underlying stocks as much as fallout from Then, in the six months following the March 2009 low, AVALX returned 230%.  That sort of return is entirely predictable for tiny, deep-value companies following a recession.  For the first years ending November 2013, the fund earned an annualized 31.6% per year.

Third, there’s reason to approach – but to approach with caution – now.  There’s a universal recognition that valuations in the small cap space are exceedingly rich right now.  Mr. Barbee’s last letter to shareholders (Q3 2013) warns that Fed policy is “starting to form asset bubbles.”  For a deep value investor, a rising market is never a friend and he frets that “the third quarter saw a significant decline in watch-list candidates, from 270 at the end of just to 224 at the end of September.  There is now significantly more competition for the opportunities that do exist and our job is clearly becoming more challenging.” 

Microcaps represent a large and diverse universe whose members are frequently mispriced.  Given his skepticism about the consequences of fed policy and a surging market, like other deep value/absolute return managers, he is gravitating toward “hard asset enterprises” and – reluctantly – cash.  In general, he would prefer not to hold cash since it doesn’t hold value when inflation rises.  He avers that “to date, our experienced team has been able to find a sufficient number of investment candidates offering what we believe are attractive risk/reward characteristics.” Nonetheless he’s cautious enough about seeking “deeply” undervalued stocks that the portfolio is up to about 16% cash.

Bottom Line

With Aegis’s pending reorganization, this might be an opportune time for investors to look again at one of the most distinctive, successful microcap value funds around.  Mr. Barbee is one of the field’s longest tenured managers and Aegis sports one of its longest records.  Both testify to the fact that steadfast investors here have had their patience more than adequately rewarded.

Fund website

Aegis Value fund.  It’s largely a one-page site, so you’ll have to scroll down to see the links to the various fund documents and reports.  The Annual and Semi-Annual Reports are pretty formulaic, but the quarterly manager letters are worth some time and attention.

© Mutual Fund Observer, 2013. All rights reserved. The information here reflects publicly available information current at the time of publication. For reprint/e-rights contact us.
Frank Value (FRNKX), October 2013

By David Snowball

Objective and Strategy

The fund pursues long-term capital appreciation. They define themselves as conservative value investors whose first strategy is “do not lose money.” As a result, they spend substantial time analyzing and minimizing the downside risks of their investments. They generally invest in a fairly compact portfolio (around 30 names) of U.S. common stocks. They start with a series of quantitative screens (including the acquisition value of similar companies and the firms’ liquidation value), then examine the ones that pass for evidence of fiscal responsibility (balance sheets without significant debt), excellent management, a quality business, and a cheap stock price. They believe themselves to have three competitive advantages: (1) they are willing to invest in firms of all sizes. (2) They’re vigilant for factors which the market systematically misprices, such as firms whose balance sheets are stronger than their income statements and special situations, such as spin-offs. And (3) they’re small enough to pursue opportunities unattractive to managers who are moving billions around.

Adviser

Frank Capital Partners, LLC. Monique M. Weiss and Brian J. Frank each own 50% of the adviser.

Manager

Brian Frank is Frank Capital Partners’ co-founder, president and chief investment officer. He’s been interested in stock investing since he was a teenager and, like many entrepreneurial managers, was a voracious reader. At 19, his grandfather gave him $100,000 with the injunction, “buy me the best stocks.” In pursuit of that goal, he founded a family office in 2002, an investment adviser in 2003 and a mutual fund in 2004. He was portfolio co-manager from 2004 – 2009 and has been sole manager since November, 2009. He earned degrees in accounting and finance from New York University’s Stern School of Business. As of the latest SAI, Mr. Frank manages one other investment account, valued at around $8 million.

The Frank Value Fund has seven times been awarded as a Wall Street Journal Category King in the Multi-cap Core Category.

Strategy capacity and closure

Mr. Frank reports “This strategy has a capacity max of around $5 billion in assets. We will seriously examine our effect on our smallest market cap position as early as $1 billion of assets. We will close the fund before we are forced out of smaller or less liquid names. We are committed to maintaining superior returns for shareholders.”

Management’s Stake in the Fund

Mr. Frank has between $100,000 and 500,000 invested in the fund. All of the fund’s trustees have substantial investments (between $10,000 and 50,000) in the fund, especially given the modest compensation ($400/year) they receive for their service.

Opening date

July 21, 2004

Minimum investment

$1500. The fund is available through Schwab, NFS, Pershing, Commonwealth, JP Morgan, Matrix, SEI, Legent, TD Ameritrade, E-Trade, and Scottrade.

Expense ratio

1.37% on assets of $18.9 million (as of July 2023)

Comments

If a fund manager approached you with the following description of his investment discipline, how would you react?

We generally ignore two out of every three opportunities to make gains for our investors. Our discipline calls for us to periodically pour money into the most egregiously overpriced corner of the market, often enough into ideas that would be pretty damned marginal in the best of circumstances. ‘cause that’s what we’re paid to do.

Yuh.

Brian Frank reacts in about the same way you did: admiration for their painful honesty and stupefaction at their strategy. As inexplicably dumb as this passage might sound, it’s descriptive of what you’ve already agreed to when you buy any of hundreds of large mainstream domestic equity funds.

Mr. Frank believes that a manager can’t afford to ignore compelling opportunities in the name of style-box purity. The best opportunities, the market’s “fat pitches,” arise in value and growth, large and small, blue-chip and spinoff. He’s intent on pursuing each.

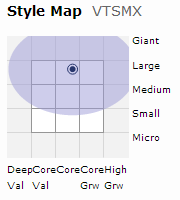
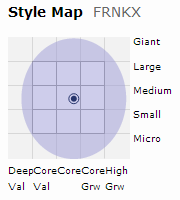
Most funds that claim to be “all cap” are sorting of spoofing you; most mean “a lot of easily-researched large companies with the occasional SMID-cap tossed in.” To get an idea of how seriously Mr. Frank means “go anywhere” when he says “go anywhere,” here’s his Morningstar portfolio map in comparison to that of the Vanguard Total Stock Market Index Fund (VTSMX):

 vtsmx style map  frnkx style map

Vanguard Total Stock Market Index

Frank Value

Nor is that distribution static; the current style map is modestly more focused on growth than last quarter’s was and there have been years with a greater bulge toward small- and micro-caps. But all versions show an incredibly diverse coverage.

Those shifts are driven by quantitative analyses of where the market’s opportunities lie. Mr. Frank writes:

What does the large-cap growth or small-cap value manager do when there are no good opportunities in their style box? They hold cash, which lowers your exposure to the equity markets and acts as a lead-weight in bull markets, or they invest in companies that do not fit their criteria and end up taking excess risk in bear markets. Neither one of these options made any sense when I was managing family-only money, and neither one made sense as we opened the strategy to the public … Our strategy is quantitative, meaning we go where we can numerically prove to ourselves there is opportunity. If there is no opportunity, we leave the space.

That breadth does not suggest that FRNKX is a closet indexer. Far from it. Morningstar categorizes equity portfolios into eleven sectors (e.g., tech or energy). At its last portfolio report, Mr. Frank had zero investing in four of the sectors (materials, real estate, energy, utilities) and diverged from the index weighting by 50% or more in three others (overweighting financial services and tech, underweighting consumer stocks).

Because the fund is small and the portfolio is focused, it can also derive substantial benefit from opportunities that wouldn’t be considered in a huge fund. He’s found considerable value when small firms are spun-off from larger ones. Two of three recent purchases were spinoffs. New Newscorp was spun-off from Rupert Murdoch’s Newscorp and, while little noticed, the “mishmash of global assets in New Newscorp, represent[s] one of the best upside/downside scenarios we have seen in a long time.” Likewise with CST Brands, a gas station and convenience store operator spun off from Valero Energy.

At the same time, Mr. Frank has a knack for identifying the sorts of small firms with unrecognized assets and low prices that eventually attract deep-pocket buyers.  He reports that “About 1 out of every 4 companies we sell is to a private equity or strategic buyer. So yes, our turnover is significantly influenced by take-outs. YTD take-outs have been DELL, BMC, and TRLG (True Religion Jeans.)”

All of this would qualify as empty talk if the manager couldn’t produce strong results, and produce them consistently.   Happily for its investors – including Mr. Frank and his family – the fund has produced remarkably strong, remarkably consistent returns.  It’s in the top tier of its peer group for trailing periods reaching back almost a decade.  The manager tracks his fund’s returns over a series of rolling five-year periods (08/2004-08/2009, 09/04-09/10 and so on).  They’ve beaten their benchmark in 45 of 45 rolling periods and have never had a negative five year span, while the S&P500 has had seven of them in the same period.  FRNKX has also outperformed in 80% of rolling three-year periods and from inception to September 2013.  That led Lipper to designate the fund as a Lipper Leader for both Total Return and Capital Preservation for every reported period.

Bottom Line

Winning is hard.  Winning consistently is incredibly hard.  Winning consistently while handicapping yourself by systematically, structurally excluding opportunities approaches impossible.  Frank Value has, for almost a decade, won quietly and consistently  While there are no guarantees in life or investing, the manager has worked hard to tilt the odds in his investors’ favor. 

Fund website

Frank Funds

Fact Sheet

Oberweis International Opportunities (OBIOX), October 2013

By David Snowball

Objective and Strategy

The fund pursues long-term capital appreciation by investing in international stocks, which might include companies headquartered in the US but having more than half of their business outside of the US.   The vast bulk of the portfolio – 85% or so – are in small- to mid-cap stocks and about 5% is in cash. They will generally invest fewer than 25% of their assets in emerging markets.

Adviser

Oberweis Asset Management Inc. Established in 1989, OAM is headquartered in suburban Chicago.  Oberweis is an independent investment management firm that invests in growth companies around the world. It specializes in small and mid-cap growth strategies globally for institutional investors and its six mutual funds. They have about $700 million in assets under management.

Manager

Ralf A. Scherschmidt, who has managed the fund since its inception. He joined Oberweis in late 2006.  Before that, he served as an equities analyst at Jetstream Capital, LLC, a global hedge fund, Aragon Global Management LLC, Bricoleur Capital Management LLC and NM Rothschild & Sons Limited.  His MBA is from Harvard, while his undergrad work (Finance, Accounting and Chinese) was completed at Georgetown. Ralf grew up and has work experience in Europe and the UK, and has also lived in South Africa, China and Taiwan. Mr. Scherschmidt oversees nearly $200 million in five other accounts.  He’s supported by three analysts who have been with Oberweis for an average of six years.

Strategy capacity and closure

Oberweis manages between $300-400 million dollars using this strategy, about 25% of which is in the fund.  The remainder is in institutional separate accounts.  The total strategy capacity might be $3 billion, but the advisor is contractually obligated to soft-close at $2.5 billion. They have the option of soft closing earlier, depending on their asset growth rate.  Oberweis does have a track record for closing their funds early.

Management’s Stake in the Fund

As of December 31, 2012, Mr. Scherschmidt had between $100,000-500,000 invested in the fund.  Three of the fund’s four trustees have some investment in the fund, with two of them being over $10,000.  As of March 31, 2013, the officers and Trustees as a group owned 5.07% of the fund’s shares.

Opening date

February 1, 2007.

Minimum investment

$1000, reduced to $500 for IRAs and $100 for accounts established with an automatic investing plan.  The fund is available through all major supermarkets (E Trade, Fidelity, Price, Schwab, Scottrade, TD Ameritrade and Vanguard, among others).

Expense ratio

1.6% on assets of $133.6 million (as of July 2023).

Comments

This is not what you imagine an Oberweis fund to be.  And that’s good.

Investors familiar with the Oberweis brand see the name and immediately think: tiny companies, high growth, high valuations, high volatility, high beta … pure run-and-gun offense.  The 76% drawdown suffered by flagship Oberweis Emerging Opportunities (OBEGX) and 74% drop at Oberweis Microcap (OBMCX) during the 2007-2009 meltdown is emblematic of that style.

OBIOX isn’t them. Indeed, OBIOX in 2013 isn’t even the OBIOX of 2009. During the 2007-09 market trauma, OBIOX suffered a 69.7% drop, well worse than their peers’ 57.7% decline. The manager was deeply dissatisfied with that performance and took concrete steps to strengthen his risk management disciplines.  OBIOX is a distinctive fund and seems to have grown stronger.

The basic portfolio construction discipline is driven by the behavioral finance research.  That research demonstrates that people, across a range of settings, make very consistent, predictable errors.  The management team is particularly taken by the research synthesized by Dan Ariely, in Predictably Irrational (2010):

We are not only irrational, but predictably irrational … our irrationality happens the same way, again and again … In conventional economics, the assumption that we are all rational implies that, in everyday life, we compute the value of all the options we face and then follow the best possible path of action … But we are really far less rational than standard economic theory assumes.  Moreover, these irrational behaviors of ours are neither random nor senseless. They are systematic and, since we repeat them again and again, predictable.

This fund seeks to identify and exploit just a few of them.

The phenomenon that most interests the manager is “post-earnings announcement drift.”  At base, investors are slow to incorporate new information which contradicts what they already “know” to be true.  If they “know” that company X is on a downward spiral, the mere fact that the company reports rising sales and rising profits won’t quickly change their beliefs.  Academic research indicates, it often takes investors between three and nine months to incorporate the new information into their conclusions.  That presents an opportunity for a more agile investor, one more adept at adapting to new facts, to engage in a sort of arbitrage: establish a position ahead of the crowd and hold until their revised estimations close the gap between the stock’s historic and current value. 

This exercise is obviously fraught with danger.  The bet works only if four things are all true:

  • The stock is substantially mispriced
  • You can establish a position in it
  • Other investors revise their estimations and bid the stock up
  • You can get out before anything bad happens.

The process of portfolio construction begins when a firm reports unexpected financial results.  At that point, the manager and his team try to determine whether the stock is a value trap (that is, a stock that actually deserves its ridiculously low price) or if it’s fundamentally mispriced.  Because most investors react so slowly, they actually have months to make that determination and establish a position in the stock. They work through 18 investment criteria and sixteen analytic steps in the process. From a 4500 stock universe, the fund holds 50-90 funds.  They have clear limits on country, sector and individual security exposure in the portfolio.  As the stock approaches 90% of Oberweis’s estimate of fair value, they sell. That automatic sell discipline forces them to lock in gains (rather than making the all-too-human mistake of falling in love with a stock and holding it too long) but also explains the fund’s occasionally very high turnover ratio: if lots of ideas are working, then they end up selling lots of appreciated stock.

There are some risk factors that the fund’s original discipline did not account for.  While it was good on individual stock risks, it was weak on accounting for the possibility that there might be exposure to unrecognized risks that affects many portfolio positions at once.  Oberweis’s John Collins offered this illustration:

If we own a Canadian chemical company, a German tech company and a Japanese consumer electronics firm, it sounds very diversified. However, if the Canadian company gets 60% of their revenue from an additive for rubber used in tires, the German firm makes a lot of sensors for engines and the Japanese firm makes a lot of car audio and navigation systems, there may be a “blind bet” in the auto sector we were unaware of.

As a result, a sudden change in the value of the euro or of a barrel of crude oil might send a shockwave rippling through the portfolio.

In January 2009, after encountering unexpectedly large losses in the meltdown, the fund added a risk optimizer program from Empirical Research Partners that performs “a monthly MRI of the portfolio” to be sure the manager understands and mitigates the sources of risk.  Since that time, the fund’s downside capture performance improved dramatically.  It used to be in the worst 25% of its peer group in down markets; it’s now in the best 25%. 

Bottom Line

This remains, by all standard measures, a volatile fund even by the standards of a volatile corner of the investment universe.  While its returns are enviable – since revising its risk management in January 2009, a $10,000 investment here would have grown to $35,000 while its average peer would have grown to $24,000 – the right question isn’t “have they done well?”  The right questions are (1) do they have a sustainable advantage over their peers and (2) is the volatility too high for you to comfortably hold it?  The answer to the first question is likely, yes.  The answer to the second might be, only if you understand the strategy and overcome your own behavioral biases.  It warrants further investigation for risk-tolerant investors.

Fund website

Oberweis International Opportunities.

2022 Semi-Annual Report

© Mutual Fund Observer, 2013. All rights reserved. The information here reflects publicly available information current at the time of publication. For reprint/e-rights contact us.
FundX Upgrader Fund (FUNDX), September 2013

By Charles Boccadoro

FundX Upgrader Fund(FUNDX) is now FundX ETF(XCOR) – January 24, 2023

Objective and Strategy

The FUNDX Upgrader Fund seeks to maximize capital appreciation. It is a fund of active or passive funds and ETFs. 70% of the portfolio is in “core funds” which pursue mainstream investments (e.g., Oakmark Global OAKGX), 30% are more aggressive and concentrated funds (e.g., Wasatch Intl Growth WAIGX and SPDR S&P Homebuilders XHB). FUNDX employs an “Upgrading” strategy in which it buys market leaders of the last several months and sells laggards. The fund seems to get a lot of press about “chasing winners,” which at one level it does. But more perhaps accurately, it methodically attempts to capitalize on trends within the market and not be left on the sidelines holding, for example, an all-domestic portfolio when international is experiencing sustained gains.

The advisor’s motto: “We’re active, flexible, and strategic because markets CHANGE.”

Advisor

FundX Investment Group (formerly DAL Investment Company, named after its founder’s children, Douglas and Linda) is the investment advisor, based in San Francisco. It has been providing investment advisory services to individual and institutional investors since 1969. Today, it invests in and provides advice on mutual fund performance through individual accounts, its family of eight upgrader funds, and publication of the NoLoad FundX newsletter.

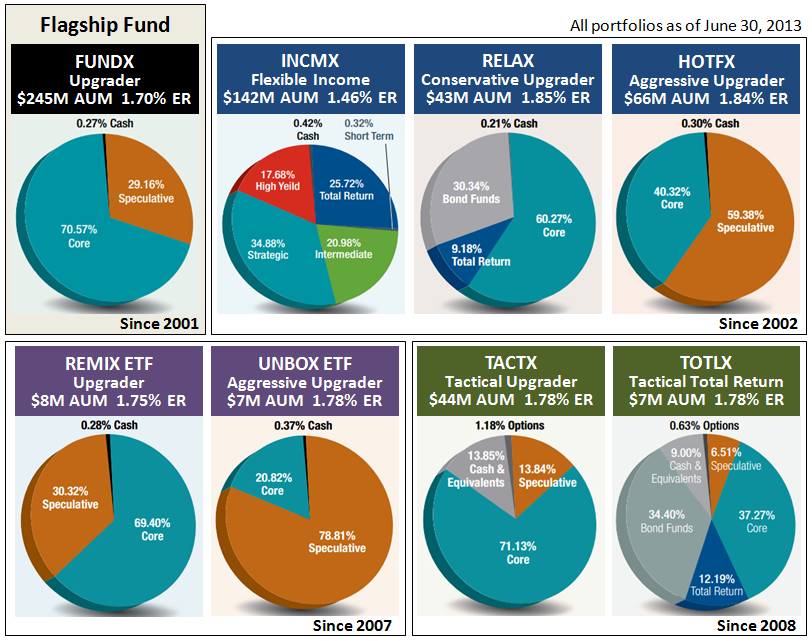
As of December 31, 2012, the advisor had nearly $900M AUM. About half is in several hundred individual accounts. The remaining AUM is held in the eight funds. All share similar upgrading strategies, but focused on different asset classes and objectives (e.g., fixed income bonds, moderate allocation, aggressive). The figure below summarizes top-level portfolio construction of each upgrader fund, as of June 30, 2013. Two are ETFs. Two others employ more tactical authority, like holding substantial cash or hedging to reduce volatility. FUNDX is the flagship equity fund with assets of $245M. 

2013-08-30_1615 (1)

Managers

All FundX funds are managed by the same team, led by FundX’s president Janet Brown and its CIO Jason Browne.  Ms. Brown joined the firm in 1978, became immersed with its founder’s methodology of ranking funds, assumed increasing money management responsibilities, became editor of their popular newsletter, then  purchased the firm in 1997. Ms. Brown graduated from San Diego State with a degree in art and architecture.  Mr. Browne joined the firm in 2000. He is a San Francisco State graduate who received his MBA from St Mary’s College. The other managers are Martin DeVault, Sean McKeon, and Bernard Burke. They too are seasoned in the study of mutual fund performance. That’s what these folks do.

Strategy Capacity and Closure

FUNDX would likely soft close between $1-1.5B and hard close at $2B, since the other funds and client portfolios use similar strategies. Mr. Browne estimates that the strategy itself has an overall capacity of $3B. In 2007, FUNDX reached $941M AUM. The portfolio today holds 26 underlying funds, with about 50% of assets in just seven funds, which means that the funds selected must have adequate liquidity.

Management Stake in the Fund

Ms. Brown has over $1M in FUNDX and between $100K and $1M in nearly all the firm’s funds. Mr. Browne too invests in all the funds, his largest investment is in tactically oriented TACTX where he has between $100K and $500K. The remaining team members hold as much as $500K in FUNDX and the fixed income INCMX, with smaller amounts in the other funds. None of the firm’s Independent Trustees, which include former President of Value Line, Inc. and former CEO of Rockefeller Trust Co., invest directly in any of the funds, but some hold individual accounts with the firm.

Opening Date

FUNDX was launched November 1, 2001. Its strategy is rooted in the NoLoad FundX Newsletter first published in 1976.

Minimum Investment

$1,000, reduced to $500 for accounts with an automatic investment plan.

Expense Ratio

1.70% as assets of $242 million (as of August 2013).

Comments

“Through bull and bear markets, Hulbert has emerged as the respected third-party authority on investment newsletters that consistently make the grade…for more than three decades, NoLoad FundX has emerged as a top performer in the Hulbert Financial Digest,” which is praise often quoted when researching FundX.

In a recent WSJ article, entitled “Chasing Hot Mutual-Fund Returns,” Mr. Hulbert summarizes results from a FundX study on fund selection, which considered over 300 funds at least two decades old. The study shows that since 1999, a portfolio based on top performing funds of the past year, like that used in the upgrader strategy, well outperforms against SP500 and a portfolio based of top performing funds of the last 10 years.

Hulbert Financial Digest does show the NoLoad FundX newsletter performance ranks among top of all newsletters tracked during the past 15 years and longer, but actually ranks it in lower half of those tracked for the last 10 years and shorter.

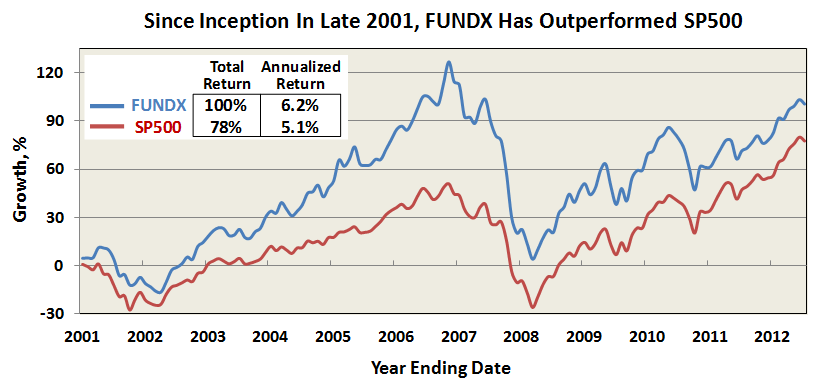
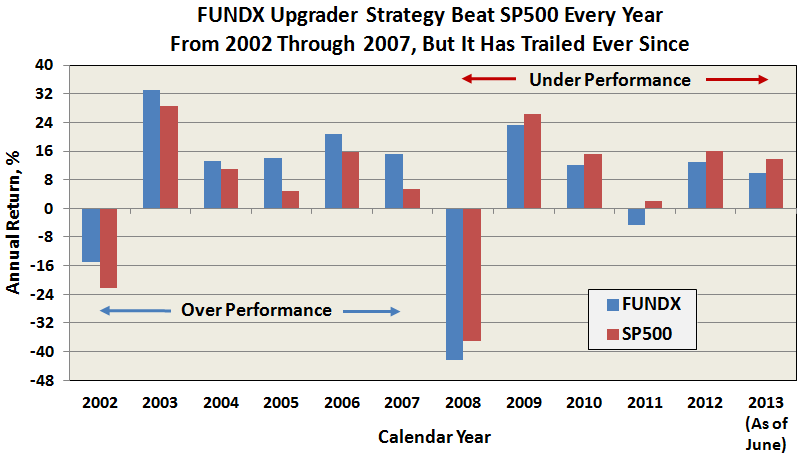
A look at FUNDX performance proper shows the flagship fund does indeed best SP500 total return. But a closer look shows its over-performance occurred only through 2007 and it has trailed every year since.

2013-08-27_0554

2013-09-01_0544

Comparisons against S&P 500 may be a bit unfair, since by design FUNDX can be more of an all-cap, global equity fund.  The fund can incrementally shift from all domestic to all foreign and back again, with the attendant change in Morningstar categorization. But Ms. Brown acknowledged the challenge head-on in a 2011 NYT interview: “As much as people in the fund industry may want to measure their performance against a very narrowly defined index, the reality is that most people judge their funds against the SP500, for better or worse.”

Asked about the fall-off, Mr. Browne explained that the recent market advance is dominated by S&P 500. Indeed, many all-cap funds with flexible mandate, like FUNDX, have actually underperformed the last few years. So while the fund attempts to capture momentum of market leaders, it also maintains a level of diversification, at least from a risk perspective, that may cause it to underperform at times. Ideally, the strategy thrives when its more speculative underlying funds experience extended advances of 10 months and more, in alignment with similar momentum in its core funds.

Crucial to their process is maintaining the universe of quality no-load/load-waived funds on which to apply its upgrading strategy. “We used to think it was all about finding the next Yacktman, and while that is still partially true, it’s just as important to align with investment style leaders, whether it is value versus growth, foreign versus domestic, or large versus small.”

Today, “the universe” comprises about 1200 funds that offer appropriate levels of diversification in both investment style and downside risk. He adds that they are very protective when adding new funds to the mix in order to avoid excessive duplication, volatility, or illiquidity. With the universe properly established, the upgrading strategy is applied monthly. The 1200 candidate funds get ranked based on performance of the past 1, 3, 6, and 12 months. Any holding that is no longer in the top 30% of its risk class gets replaced with the current leaders.

Both Ms. Brown and Mr. Browne make to clear that FUNDX is not immune to significant drawdown when the broad market declines, like in 2008-2009. In that way, it is not a timing strategy. That technique, however, can be used in the two more tactical upgrader funds TACTX and TOTLX.

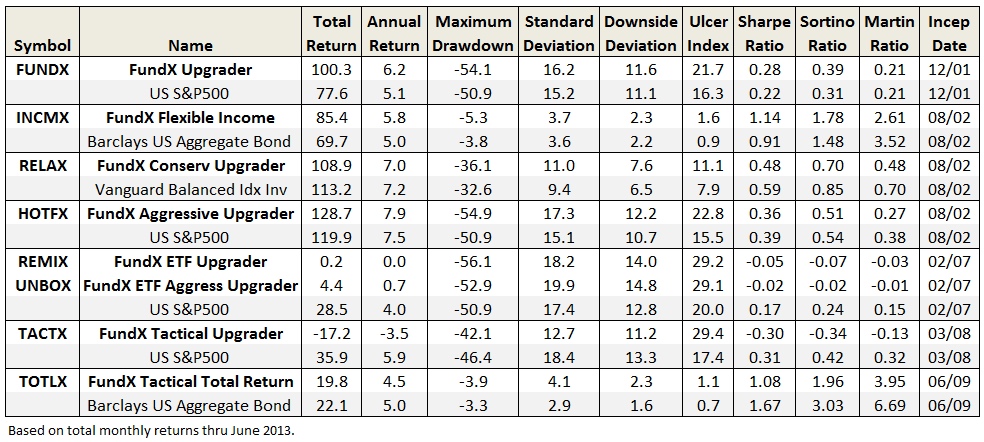
The table below summarizes lifetime risk and return numbers for FUNDX, as well as the other upgrader funds. Reference indices over same periods are included for comparison. Over longer term the four upgrader funds established by 2002 have held-up quite well, if with somewhat higher volatility and maximum drawdown than the indices. Both ETFs have struggled since inception, as has TACTX.

2013-08-31_0939

I suspect that few understand more about mutual fund performance and trends than the folks at FundX. Like many MFO readers, they fully appreciate most funds do not lead persistently and that hot managers do not stay on-top. Long ago, in fact, FundX went on record that chronic underperformance of Morningstar’s 5-star funds is because time frames considered for its ratings “are much too long to draw relevant conclusions of how a fund will do in the near future.” Better instead to “invest based on what you can observe today.” And yet, somewhat ironically, while the upgrading strategy has done well in the long term, FUNDX too can have its time in the barrel with periods of extended underperformance.

While the advisor campaigns against penalizing funds for high expenses, citing that low fees do not guarantee top performance, it’s difficult to get past the high fees of FUNDX and the upgrader funds. The extra expense layer is typical with fund-of-funds, although funds which invest solely in their own firm’s products (e.g., the T. Rowe Price Spectrum Funds and Vanguard STAR VGSTX) are often exceptions.

Bottom Line

It is maddeningly hard, as Value Line and FundX have certainly discovered, to translate portfolios which look brilliant in newsletter systems into actual mutual funds with distinguished records.   The psychological quirks which affect all investors, high operating expenses, and the pressure to gain and retain substantial AUM all erode even the best-designed system.

It might well be that FUNDX’s weak performance in the past half-decade is a statistical anomaly driven by the failure of its system to react quickly enough to the market’s bottoming in the first quarter of 2009 and its enormous surge in the second.   Those sorts of slips are endemic to quant funds.  Nonetheless, the fund has not outperformed a global equity benchmark two years in a row for more than a decade and trails that benchmark by about 1% per year for the decade.   The fact that the FundX team faces those challenges despite access to an enormous amount of data, a clear investment discipline and access to a vast array of funds serves as a cautionary tale to all of us who attempt to actively manage our fund portfolios.

Website

The FundX Investment Group, which links to its investment services, newsletter, and upgrader funds. The newsletter, which can be subscribed on-line for $89 annual, is chock full of good information.

FundX Upgrader Website, this also lists the 2013 Q3 report under the Performance tab.

Fact Sheet

Charles/31Aug2013

Beck, Mack & Oliver Partners Fund (BMPEX), September 2013

By David Snowball

Objective and Strategy

Beck, Mack & Oliver Partners Fund seeks long term capital appreciation consistent with the preservation of capital. It is an all-cap fund that invests primarily in common stock, but has the ability to purchase convertible securities, preferred stocks and a wide variety of fixed-income instruments.  In general, it is a concentrated portfolio of foreign and domestic equities that focuses on finding well-managed businesses with durable competitive advantages in healthy industries and purchasing them when the risk / reward profile is asymmetric to the upside.

Adviser

Beck, Mack & Oliver LLC, founded in 1931. The firm has remained small, with 25 professionals, just seven partners and $4.8 billion under management, and has maintained a multi-generation relationship with many of its clients.  They’re entirely owned by their employees and have a phased, mandatory divestiture for retiring partners: partners retire at 65 and transition 20% of their ownership stake to their younger partners each year.  When they reach 70, they no longer have an economic interest in the firm. That careful, predictable transition makes financial management of the firm easier and, they believe, allows them to attract talent that might otherwise be drawn to the hedge fund world.  The management team is exceptionally stable, which seems to validate their claim.  In addition to the two BM&O funds, the firm maintains 670 “client relationships” with high net worth individuals and families, trusts, tax-exempt institutions and corporations.

Manager

Zachary Wydra.  Mr. Wydra joined Beck, Mack & Oliver in 2005. He has sole responsibility for the day-to-day management of the portfolio.  Prior to joining BM&O, Mr. Wydra served as an analyst at Water Street Capital and as an associate at Graham Partners, a private equity firm. In addition to the fund, he manages the equity sleeve for one annuity and about $750 million in separate accounts.  He has degrees from a bunch of first-rate private universities: Brown, Columbia and the University of Pennsylvania.

Strategy capacity and closure

The strategy can accommodate about $1.5 billion in assets.  The plan is to return capital once assets grow beyond the optimal size and limit investment to existing investors prior to that time.  Mr. Wydra feels strongly that this is a compounding strategy, not an asset aggregation strategy and that ballooning AUM will reduce the probability of generating exceptional investment results.  Between the fund and separate accounts using the strategy, assets were approaching $500 million in August 2013.

Management’s Stake in the Fund

Over $1 million.  The fund is, he comments, “a wealth-creation vehicle for me and my family.”

Opening date

December 1, 2009 for the mutual fund but 1991 for the limited partnership.

Minimum investment

$2500, reduced to $2000 for an IRA and $250 for an account established with an automatic investment plan

Expense ratio

1.0%, after waivers on assets of $50.7 million, as of June 2023. 

Comments

One of the most important, most approachable and least read essays on investing is Charles Ellis, The Loser’s Game (1977).  It’s funny and provocative and you should read it in its entirety.  Here’s the two sentence capsule of Ellis’s argument:

In an industry dominated by highly skilled investors all equipped with excellent technology, winners are no longer defined as “the guys who perform acts of brilliance.”  Winners are defined as “the guys who make the fewest stupid, unnecessary, self-defeating mistakes.”

There are very few funds with a greater number or variety of safeguards to protect the manager from himself than Beck, Mack & Oliver Partners.  Among more than a dozen articulated safeguards:

  • The advisor announced early, publicly and repeatedly that the strategy has a limited capacity (approximately $1.5 billion) and that they are willing to begin returning capital to shareholders when size becomes an impediment to exceptional investment performance.
  • A single manager has sole responsibility for the portfolio, which means that the research is all done (in-house) by the most senior professionals and there is no diffusion of responsibility.  The decisions are Mr. Wydra’s and he knows he personally bears the consequences of those decisions.
  • The manager may not buy any stock without the endorsement of the other BM&O partners.  In a unique requirement, a majority of the other partners must buy the stock for their own clients in order for it to be available to the fund.  (“Money, meet mouth.”)
  • The manager will likely never own more than 30 securities in the portfolio and the firm as a whole pursues a single equity discipline.  In a year, the typical turnover will be 3-5 positions.
  • Portfolio position sizes are strictly controlled by the Kelly Criterion (securities with the best risk-reward comprise a larger slice of the portfolio than others) and are regularly adjusted (as a security’s price rises toward fair value, the position is reduced and finally eliminated; capital is redeployed to the most attractive existing positions or a new position).
  • When the market does not provide the opportunity to buy high quality companies at a substantial discount to fair value, the fund holds cash.  The portfolio’s equity exposure has ranged between 70-90%, with most of the rest in cash (though the manager has the option of purchasing some fixed-income securities if they represent compelling values).

Mr. Wydra puts it plainly: “My job is to manage risk.” The fund’s exceedingly deliberate, careful portfolio construction reflects the firm’s long heritage.  As with other ‘old money’ advisors like Tweedy, Browne and Dodge & Cox, Beck, Mack & Oliver’s core business is managing the wealth of those who have already accumulated a fortune.  Those investors wouldn’t tolerate a manager whose reliance on hunches or oversized bets on narrow fields, place their wealth at risk.  They want to grow their wealth over time, are generally intelligent about the need to take prudent risk but unwilling to reach for returns at the price of unmanaged risk.

That discipline has served the firm’s, and the fund’s, investors quite well.  Their investment discipline seeks out areas of risk/reward asymmetries: places where the prospect of permanent loss of capital is minimal and substantial growth of capital is plausible. They’ve demonstrably and consistently found those asymmetries: from inception through the end of June 2013, the fund captured 101% of the market’s upside but endured less than 91% of its downside. To the uninitiated, that might not seem like a huge advantage.  To others, it’s the emblem of a wealth-compounding machine: if you consistently lose a bit less in bad times and keep a little ahead in good, you will in the long term far outpace your rivals.

From inception through the end of June, 2013, the strategy outpaced the S&P 500 by about 60 basis points annually (9.46% to 8.88%).  Since its reorganization as a fund, the advantage has been 190 basis points (15.18% to 13.28%).  It’s outperformed the market in a majority of rolling three-month periods and in a majority of three-month periods when the market declined.

So what about 2013?  Through late August, the fund posted respectable absolute returns (about 10% YTD) but wretched relative ones (it trailed 94% of its peers).  Why so? Three factors contributed.  In a truly defensive move, the manager avoided the “defensive” sectors that were getting madly bid up by anxious investors.  In a contrarian move, he was buying energy stocks, many of which were priced as if their industry was dying.  And about 20% of the fund’s portfolio was in cash.  Should you care?  Only if your investment time horizon is measured in months rather than years.

Bottom Line

Successful investing does not require either a magic wand or a magic formula.  No fund or strategy will win in each year or every market.  The best we can do is to get all of the little things right: don’t overpay for stocks and don’t over-diversify, limit the size of the fund and limit turnover, keep expenses low and keep the management team stable, avoid “hot” investments and avoid unforced errors, remember it isn’t a game and it isn’t a sprint.  Beck, Mack & Oliver gets an exceptional number of the little things very right.  It has served its shareholders very well and deserves close examination.

Fund website

Beck Mack & Oliver Partners

Fact Sheet

© Mutual Fund Observer, 2013. All rights reserved. The information here reflects publicly available information current at the time of publication. For reprint/e-rights contact us.
Tributary Balanced (FOBAX), September 2013 update

By David Snowball

THIS IS AN UPDATE OF THE FUND PROFILE ORIGINALLY PUBLISHED IN April 2012. YOU CAN FIND THAT PROFILE HERE.

Objective and strategy

Tributary Balanced Fund seeks capital appreciation and current income. They allocate assets among the three major asset groups: common stocks, bonds and cash equivalents. Based on their assessment of market conditions, they will invest 25% to 75% of the portfolio in stocks and convertible securities, and at least 25% in bonds. The portfolio is typically 70-75 stocks from small- to mega-cap and turnover is well under half of the category average.  They currently hold about 60 bonds.

Adviser

Tributary Capital Management.  At base, Tributary is a subsidiary of First National Bank of Omaha and the Tributary Funds were originally branded as the bank’s funds.  Tributary advises six mutual funds, as well as serving high net worth individuals and institutions.  As of June 30, 2013, they had about $1.3 billion under management.

Manager

David C. Jordan, since July 2013.  Mr. Jordan is the Managing Partner of Growth Equities for Tributary and has been managing portfolios since 1982.  He managed this fund from 05/2001 to 07/2010. He has managed four-star Growth Opportunities (FOGRX) since 1998 and two-star Large Cap Growth (FOLCX) since 2011.  Before joining Tributary, he managed investments at the predecessors to Bank One Investment Advisors, Key Trust of the Northwest, and Wells Fargo Denver.

Management’s stake in the fund

Mr. Jordan’s investments are primarily in equities (he reports having “more than half of my financial assets invested in the Tributary Growth Opportunities Fund which I manage”), but he recently invested over $100,000 in the Balanced fund. 

Strategy capacity and closure

The advisor has “not formally discussed strategy capacities for the Balanced Fund, believing that we will not have to seriously consider capacity constraints until the fund is much larger than it is today.”

Opening date

August 6, 1996

Minimum investment

$1000, reduced to $100 for accounts opened with an automatic investing plan.

Expense ratio

0.99%, after a waiver, on $78 million in assets (as of July 2023).  Morningstar describes the expenses as “high,” which is misleading.  Morningstar continues benchmarking FOBAX against “true” institutional functions with minimums north of $100,000.

Comments

The long-time manager of Tributary Balanced has returned.  In what appears to be a modest cost-saving move, Mr. Jordan returned to the helm of this fund after a three year absence. 

If his last stint with the fund, from 2001 – 2010, is any indication, that’s a really promising development.  Over the three years of his absence, Tributary was a very solid fund.  The fund’s three-year returns of 13.1% (through 6/30/2013) place it in the top tier of all moderate allocation funds.  Over the period, it captured more of the upside and a lot less of the downside than did its average peer.  Our original profile concluded with the observation, “Almost no fund offers a consistently better risk-return profile.”

One of the few funds better than Tributary Balanced 2010-2013 might have been Tributary Balanced 2001-2010.  The fund posted better returns than the most highly-regarded, multi-billion dollar balanced funds.  If you compare the returns on an investment in FOBAX and its top-tier peers during the period of Mr. Jordan’s last tenure here (7/30/2001 – 5/10/2010), the results are striking.

Tributary versus Vanguard Balanced Index (VBINX)?  Tributary’s better.

Tributary versus Vanguard STAR (VGSTX)?  Tributary.

Tributary versus Vanguard Wellington (VWELX)?  Tributary.

Tributary versus Dodge and Cox Balanced (DODBX)?  Tributary.

Tributary versus Mairs & Power Balanced (MAPOX)?  Tributary.

Tributary versus T. Rowe Price Capital Appreciation (PRWCX)?  Price, by a mile.  Ehh.  Nobody’s perfect and Tributary did lose substantially less than Cap App during the 10/2007-03/2009 market collapse.

Libby Nelson of Tributary Capital Management reports that “During that time period, David outperformed the benchmark in 7 out of 9 of the calendar years and the five and ten-year performance was in the 10th percentile of its Morningstar Peer Group.”  In 2008, the fund finished in the top 14% of its peer group with a loss of 22.5% while its average peer dropped 28%.  During the 18-month span of the market collapse, Tributary lost 34.7% in value while the average moderate allocation fund dropped 37.3%.

To what could we attribute Tributary’s success? Mr. Jordan’s answer is, “we think a great deal about our investors.  We know that they’re seeking a lower volatility fund and that they’re concerned with downside protection.  We build the portfolio from there.”

Mr. Jordan provided stock picks for the fund’s portfolio even when he was not one of the portfolio managers.  He’s very disciplined about valuations and prefers to pursue less volatile, lower beta, lower-priced growth stocks.  In addition, he invests a greater portion of the portfolio in less-efficient slices of the market (smaller large caps and mid-caps) which results in a median market cap that’s $8 billion lower than his peers.

Responding to the growing weakness in the bond market, he’s been rotating assets into stocks (now about 70% of the portfolio) and shortening the duration of the bond portfolio (from 4.5 years down to 3.8 years).  He reports, “Our outlook is for returns from bonds in the period ahead to be both volatile, and negative, so we will move further toward an emphasis on stocks, which also may be volatile, but we believe will be positive over the next twelve months.”

Bottom Line

The empirical record is pretty clear.  Almost no fund offers a consistently better risk-return profile.  That commitment to consistency is central to Mr. Jordan’s style: “We are more focused on delivering consistent returns than keeping up with momentum driven markets and securities.”  Tributary has clearly earned a spot on the “due diligence” list for any investor interested in a hybrid fund.

Fund website

Tributary Balanced

Fact Sheet

© Mutual Fund Observer, 2013. All rights reserved. The information here reflects publicly available information current at the time of publication. For reprint/e-rights contact us.
Grandeur Peak Global Opportunities (GPGOX), August 2013 update

By David Snowball

THIS IS AN UPDATE OF THE FUND PROFILE ORIGINALLY PUBLISHED IN February 2012. YOU CAN FIND THAT PROFILE HERE.

Objective and Strategy

Global Opportunities pursues long-term capital growth by investing in a portfolio of global equities with a strong bias towards small- and micro-cap companies. Investments may include companies based in the U.S., developed foreign countries, and emerging/frontier markets. The portfolio has flexibility to adjust its investment mix by market cap, country, and sector in order to invest where the best global opportunities exist.  The managers expect to move towards 100-150 holdings (currently just over 200).

Adviser

Grandeur Peak Global Advisors is a small- and micro-cap focused global equities investment firm, founded in mid-2011, and comprised of a very experienced and collaborative investment team that worked together for years managing some of the Wasatch funds.  They advise three Grandeur Peak funds and one “pooled investment vehicle.”  The adviser passed $1 billion in assets under management in July, 2013.

Managers

Robert Gardiner and Blake Walker.   Robert Gardiner is co-founder, CEO and Director of Research for Grandeur Peak Global.  Prior to founding Grandeur Peak, he managed or co-managed Wasatch Microcap (WMICX), Small Cap Value (WMCVX) and Microcap Value (WAMVX, in which I own shares).  In 2007, he took a sort of sabbatical from active management, but continued as Director of Research.  During that sabbatical, he reached a couple conclusions: (1) global microcap investing was the world’s most interesting sector, and (2) he wanted to get back to managing a fund.  He returned to active management with the launch of Wasatch Global Opportunities (WAGOX), a global small/micro-cap fund.  From inception in late 2008 to July 2011 (the point of his departure), WAGOX turned a $10,000 investment into $23,500, while an investment in its average peer would have led to a $17,000 portfolio.  Put another way, WAGOX earned $13,500 or 92% more than its average peer managed.

Blake Walker is co-founder of and Chief Investment Officer for Grandeur Peak. Mr. Walker was a portfolio manager for two funds at Wasatch Advisors. Mr. Walker joined the research team at Wasatch Advisors in 2001 and launched his first fund, the Wasatch International Opportunities Fund (WAIOX) in 2005. He teamed up with Mr. Gardiner in 2008 to launch the Wasatch Global Opportunities (WAGOX).

Strategy capacity and closure

Grandeur Peak specializes in global small and micro-cap investing.  Their estimate, given current conditions, is that they could profitably manage about $3 billion in assets.  They could imagine running seven distinct small- to micro-cap funds and tend to close all of them (likely a soft close) when the firm’s assets under management reach about $2 billion.  The adviser has target closure levels for each current and planned fund.

Management’s stake in the fund

As of 4/30/2012, Mr. Gardiner had invested over $1 million in each of his funds, Mr. Walker had between $100,000 and 500,000 in each.  President Eric Huefner makes an argument that I find persuasive: “We are all highly vested in the success of the funds and the firm. Every person took a significant pay cut (or passed up a significantly higher paying opportunity) to be here.”   The fund’s trustees are shared with 24 other funds; none of those trustees are invested with the fund.

Opening date

October 17, 2011.

Minimum investment

The fund closed to new investors on May 1, 2013.  It remains open for additional investments by existing shareholders.

Expense ratio

1.34% on $674.2 million in assets (as of July 2023). 

Comments

As part of a long-established plan, Global Opportunities closed to new investors in May, 2013.  That’s great news for the fund’s investors and, with the near-simultaneous launch of Grandeur Peak Global Reach (GPROX/GPRIX), not terrible news for the rest of us.

There are three matters of particular note:

  1. This is a choice, not an echo.  Grandeur Peak Global Opportunities goes where virtually no one else does: tiny companies across the globe.  Most “global” funds invest in huge, global corporations.  Of roughly 280 global stock funds, 90% have average market caps over $10 billion with the average being $27 billion.  Only eight, or just 3%, are small cap funds.  GPGOX has the lowest average market capitalization of any global fund (as of July, 2013). While their peers’ large cap emphasis dampens risk, it also tends to dampen rewards and produces rather less diversification value for a portfolio.
  2. This has been a tremendously rewarding choice. While these are intrinsically risky investments, they also offer the potential for huge rewards.  The managers invest exclusively in what they deem to be high-quality companies, measured by factors such as the strength of the management team, the firm’s return on capital and debt burden, and the presence of a sustainable competitive advantage.  Together the managers have 35 years of experience in small cap investing and have done consistently excellent work.  From inception through June 30, 2013, GPGOX returned 23.5% per year while its peers have returned about 14.5%.  In dollar terms, a $10,000 investment at inception would have grown to $14,300 here, but only $12,500 in their average peer.
  3. The portfolio is evolving.  While Global Opportunities is described in the prospectus as being non-diversified, the managers have never chosen to construct such a portfolio.  The fund typically holds more than 200 names spread over a couple dozen countries.  With the launch of its sibling Global Reach, the managers will begin slimming down the Global Opportunities portfolio.  They imagine holding closer to 100-150 names in the future here versus 300 or more in Global Reach. 

Eric Huefner, Grandeur Peak’s president, isn’t exactly sure how the evolution will change Global Opportunities long-term risk/return profile.  “There will be a higher bar” for getting into the portfolio going forward, which means fewer but larger individual positions, in the stocks where the managers have the greatest confidence.  A hundred or so 10-25 bps positions will be eliminated; after the transition period, the absolute minimum position size will be 35 bps and the targeted minimum will be 50 bps.  That will eliminate a number of intriguing but higher risk stocks, the fund’s so-called “long tail.”  While more-concentrated portfolios are generally perceived to be more volatile, here the concentration is achieved by eliminating a bunch of the portfolio’s most-volatile stocks.

Bottom Line

If you’re a shareholder here, you have reason to be smug and to stay put.  If you’re not a shareholder here and you regret that fact, consider Global Reach as a more diversified application of the same strategy.

Website

Grandeur Peak Global Opportunities

Grandeur Peak Funds Investment Process

Grandeur Peak Funds Annual Report

3/31/2023 Quarterly Fact Sheet

© Mutual Fund Observer, 2013. All rights reserved. The information here reflects publicly available information current at the time of publication. For reprint/e-rights contact us.
Smead Value Fund (SMVLX), July 2013

By David Snowball

Objective and Strategy:

The fund’s investment objective is long-term capital appreciation, which it pursues by investing in 25-30 U.S. large cap companies.  Its intent is to find companies so excellent that they might be held for decades.  Their criteria for such firms are ones that meet an economic need, have a long history of profitability, a strong competitive position, a lot of free cash flow and a stock selling at a discount.  Shareholder-friendly management, strong insider ownership and a strong balance sheet are all positives but not requirements.

Adviser:

Smead Capital Management, whose motto is “Only the Lonely Can Play.”  The firm advises Smead Value and $150 million in of separate accounts.

Managers:

William W. Smead and Tony Scherrer. Mr. Smead, founder and CEO of the adviser, has 33 years of experience in the investment industry and was previously the portfolio manager of the Smead Investment Group of Wachovia Securities. Mr. Scherrer joined the firm in 2008 and was previously the Vice President and Senior Portfolio Manager at U.S. Trust and Harris Private Bank. He has 18 years of professional investment experience.

Management’s Stake in the Fund:

Mr. Smead has over $1 million invested in the fund and Mr. Scherrer has between $100,000 and $500,000.

Opening date:

January 2, 2008

Minimum investment:

$3,000 initially, $500 subsequently.

Expense ratio:

1.25% on assets of about $4.7 Billion, as of July 2023.

Comments:

Well, there certainly aren’t a lot of moving parts here. In a world dominated by increasingly complex (multi-asset, multi-strategy, multi-cap, multi-manager) products, Smead Value stands out for a refreshingly straightforward approach: Research. Buy. Hold.

Mr. Smead believes that U.S. blue chip stocks are about the best investment you can make.  Not just now or this decade or over the past 25 years.  The best, pretty much ever.  He realizes there are a lot of very smart guys who disagree with him; “the brilliant pessimists” he calls them.  He seems to have three beliefs about them:

  1. They might be right at a macro level, but that doesn’t mean that they’re offering good investment advice. He notes, for example, that the tech analysts were right in the late 1990s: the web was going to change everything. Unfortunately, that Big Picture insight did not convert to meaningful investing advice.
  2. Their pessimism is profitable – to him.  Anything scarce, he argues, goes up in value.  As more and more Big Thinkers become pessimistic, optimism becomes more valuable.  The old adage is “stocks climb a wall of worry” and the pessimists provide the wall.
  3. Their pessimism is unprofitable to their investors. He notes, as a sort of empirical test, that few pessimist-driven strategies have actually made money.

Even managers who don’t buy pessimism are, he believes, twitchy.  They buy and sell too quickly, eroding gains, driving up costs and erasing whatever analytic advantage they might have held.  The investing world is, he claims, 35% passive, 5% active … and 60% too active.

He’s even more dismissive of many investing innovations.  Commodities, he notes, are not more an “asset class” than blackjack is and futures contracts than a nine-month bet.  Commodity investing is a simple bet on the future price of an inanimate object that such bets have, for over 200 years, turned out badly: sharp price spikes have inevitably been followed by price crashes and 20-year bear markets.

His view of China is scarcely more sanguine.

His alternative?  Find excellent companies.  Really excellent ones.  Wait and wait and wait until their stock sells at a discount.  Buy.  Hold. (His preferred time frame is “10 years to forever”.) Profit.

That’s about it.

And it works.  A $10,000 investment in Smead Value at inception would be worth $13,600 by the end of June 2013; a similar investment in its average peer would have grown to only $11,800.  That places it in the top 1-2% of large cap core funds.  It has managed that return with lower volatility (measured by beta, standard deviation and downside capture ratios) than its peers.  It’s not surprising that the fund has earned five stars from Morningstar and a Lipper Leaders designation from Lipper.

Bottom Line:

Mr. Smead is pursuing much the same logic as the founders of the manager-less ING Corporate Leaders Fund (LEXCX).  Buy great companies. Do not sell.  Investors might reasonably complain about the expenses attached to such a low turnover strategy (though he anticipates dropping them by 15 basis points in 2013), but they don’t have much grounds for complaining about the results.

Fund website:

www.smeadfunds.com

2023 Q2 Shareholder Letter

Fact Sheet

© Mutual Fund Observer, 2013. All rights reserved. The information here reflects publicly available information current at the time of publication. For reprint/e-rights contact us.
Artisan Global Value (ARTGX), May 2013 update

By David Snowball

 
This is an update of the fund profile originally published in 2008, and updated in May 2012. You can find that profile here.

Objective

The fund pursues long-term growth by investing in 30-50 undervalued global stocks.  The managers look for four characteristics in their investments:

  1. A high quality business
  2. A strong balance sheet
  3. Shareholder-focused management and
  4. The stock selling for less than it’s worth.

Generally it avoids small cap caps.  It can invest in emerging markets, but rarely does so though many of its multinational holdings derived significant earnings from emerging market operations.   The managers can hedge their currency exposure, though they did not do so until the nuclear disaster in, and fiscal stance of, Japan forced them to hedge yen exposure in 2011.

Adviser

Artisan Partners, L.P. Artisan is a remarkable operation. They advise the twelve Artisan funds (the eleven retail funds plus an institutional emerging markets fund), as well as a number of separate accounts. The firm has managed to amass over $83 billion in assets under management, of which approximately $45 billion are in their mutual funds. Despite that, they have a very good track record for closing their funds and, less visibly, their separate account strategies while they’re still nimble. Five of the firm’s funds are closed to new investors, as of April 2013.  Their management teams are stable and invest heavily in their own funds.

Managers

David Samra and Daniel O’Keefe. Both joined Artisan in 2002 after serving as analysts for the very successful Oakmark International, International Small Cap and Global funds. They co-manage the closed Artisan International Value (ARTKX) fund and oversee about $23.2 billion in total. Mr. O’Keefe was, for several years in the 90s, a Morningstar analyst.  Morningstar designates Global Value as a five-star “Silver” fund and International Value as a five-star “Gold” fund, both as of March, 2013.

Management’s Stake in the Fund

Samra and O’Keefe each have more than $1 million invested in both funds, as is typical of the Artisan partners generally.

Opening date

December 10, 2007.

Minimum investment

$1,000 for regular and IRA accounts but the minimum is reduced to $50 for investors setting up an automatic investing plan. Artisan is one of a very few firms still willing to be so generous with small investors.

Expense ratio

1.30% for Investor shares. Under all the share classes, the fund manages $2 Billion. (As of June 2023). 

Comments

I’m running out of reasons to worry about Artisan Global Value.

I have long been a fan of this fund.  It was the first “new” fund to earn the “star in the shadows” designation.  Its management team won Morningstar’s International-Stock Manager of the Year honors in 2008 and was a finalist for the award in 2011 and 2012. In announcing the 2011 nomination, Morningstar’s senior international fund analyst, William Samuel Rocco, observed:

Artisan Global Value has . . .  outpaced more than 95% of its rivals since opening in December 2007.  There’s a distinctive strategy behind these distinguished results. Samra and O’Keefe favor companies that are selling well below their estimates of intrinsic value, consider companies of all sizes, and let country and sector weightings fall where they may. They typically own just 40 to 50 names. Thus, both funds consistently stand out from their category peers and have what it takes to continue to outperform. And the fact that both managers have more than $1 million invested in each fund is another plus.

Since then, the story has just gotten better. Since inception, they’ve managed to capture virtually all of the market’s upside but only about two-thirds of its downside. It has a lower standard deviation over the past three and five years than does its peers.  ARTGX has outperformed its peers in 75% of the months in which the global stock group lost money.  Lipper designates it as a “Lipper Leader” in Total Return, Consistency and Preservation of Capital for every period they track.  International Value and Global Value won three Lipper “best of” awards in 2013.

You might read all of their success in managing risk as an emblem of a fund willing to settle for second-tier returns.  To the contrary, Global Value has crushed its competition: from inception through the end of April 2013, Global Value would have turned a $10,000 investment into $14,200.  The average global stock fund would have turned $10,000 into … well, $10,000.  They’ve posted above-average returns, sometimes dramatically above average, in every calendar year since launch and are doing it again in 2013 (at least through April).

We attribute that success to a handful of factors:

First, the managers are as interested in the quality of the business as in the cost of the stock.  O’Keefe and Samra work to escape the typical value trap by looking at the future of the business – which also implies understanding the firm’s exposure to various currencies and national politics – and at the strength of its management team.

Second, the fund is sector agnostic. . .  ARTGX is staffed by “research generalists,” able to look at options across a range of sectors (often within a particular geographic region) and come up with the best ideas regardless of industry.  In designated ARTGX a “Star in the Shadows,” we concluded:

Third, they are consistently committed to their shareholder’s best interests.  They chose to close the International Value fund before its assets base grew unmanageable.  And they closed the Global Value strategy in early 2013 for the same reason.  They have over $8 billion in separate accounts that rely on the same strategy as the mutual fund and those accounts are subject to what Mr. O’Keefe called “chunky inflows” (translation: the occasional check for $50, $100 or $200 million arrives).  In order to preserve both the strategy’s strength and the ability of small investors to access it, they closed off the big money tap and left the fund open.

You might consider that a limited time offer and a durned fine one.

Bottom Line

We reiterate our conclusion from 2008, 2011 and 2012: “there are few better offerings in the global fund realm.”

Fund website

Artisan Global Value

Q3 Holdings (June 30, 2023)

© Mutual Fund Observer, 2013. All rights reserved. The information here reflects publicly available information current at the time of publication. For reprint/e-rights contact us.
Payden Global Low Duration Fund (PYGSX), May 2013

By David Snowball

Objective and Strategy

Payden Global Low Duration Fund seeks a high level of total return, consistent with preservation of capital, by investing in a wide variety of debt instruments and income-producing securities. Those include domestic and international sovereign and corporate debt, municipal bonds, mortgage- and asset-backed debt securities, convertible bonds and preferred stock. The maximum average maturity they envision is four years. Up to 35% of the portfolio might be investing in non-investment grade bonds (though the portfolio as a whole will remain investment grade) and up to 20% can be in equities. At least 40% will be non-US securities. The Fund generally hedges most of its foreign currency exposure to the U.S. dollar and is non-diversified.

Adviser

Payden & Rygel is a Los Angeles-based investment management firm which was established in 1983.  The firm is owned by 20 senior executives.  It has $85 billion in assets under management with $26 billion in “enhanced cash” products and $32 billion in low-duration ones as of March 31, 2013.  In 2012, Institutional Investor magazine recognized them as a nation’s top cash-management and short-term fixed income investor.  They advise 14 funds for non-U.S. investors (13 focused on cash or fixed income) and 18 U.S. funds (15 focused on cash or fixed income).

Managers

Mary Beth Syal, David Ballantine and Eric Hovey.  As with the Manning & Napier or Northern Trust funds, the fund relies on the judgments of an institution-wide team with the named managers serving as the sort of “point people” for the fund.    Ms. Syal is a managing principal, senior portfolio manager, and a member of the firm’s Investment Policy Committee. She directs the firm’s low duration strategies. Mr. Ballantine is a principal, a portfolio manager and develops investment strategies for short and intermediate-term fixed income portfolios.  Both have been with the fund since inception.  Mr. Hovey is a senior vice president and portfolio manager who specialty is in analyzing market opportunities and portfolio positioning.

Management’s Stake in the Fund

None.  Two of the three managers said that their own asset allocation plans were heavily weighted toward equities.

Opening date

September 18, 1996.

Minimum investment

$5000, reduced to $2000 for tax-sheltered accounts and those set up with an AIP.

Expense ratio

0.53% after a waiver ending on February 28, 2024, on assets of $68 million.

Comments

Two things conspire against the widespread recognition of this fund’s long excellent record, and they’re both its name.

“Global” and “low duration” seems to create a tension in many investors’ minds.   Traditionally, global has been a risk-on strategy and short-term bonds have represented a risk-off strategy.  That mixed signal – is this a strategy to pursue when risk-taking is being rewarded or one to pursue when risk-aversion is called for – helps explain why so few investors have found their way here.

The larger problem caused by its name is Morningstar’s decision to assign the fund to the “world bond” group rather than the “short-term bond” group.  The “world bond” group is dominated by intermediate-term bonds, which have a fundamentally different risk-return profile than does Payden.  As a result of a demonstrably inappropriate peer group assignment, a very strong fund is made to look like a very mediocre one. 

How mediocre?  The fund’s overall star rating is two-stars and its rating has mostly ranged from one- to three-stars.  That is, would be a very poor intermediate-term bond fund.  How bad is the mismatch?  The fact is that nothing about its portfolio’s sector composition, credit-quality profile or maturities is even close to the world bond group’s.  More telling is the message from Morningstar’s calculation of the fund’s upside and downside capture ratios.  They measure how the fund and its presumed act when their slice of the investing universe, in this case measured by the Barclays US Bond Aggregate Index, rises or falls.  Here, by way of illustration, is the three-year number (as of 03/31/13):


Upside capture

Downside capture

Payden Global Low

44

(28)

World bond group

100

134

When the U.S. bond market falls by 1%, the world bond group falls by 1.34% while Payden rises by 0.28%. At base, the Payden fund doesn’t belong in the world bond group – it is a fundamentally different creature, operating with a very different mission and profile.

What happens if you consider the fund as a short-term bond fund instead?  It becomes one of the five best-performing funds in existence.  Based solely on its five- and ten-year record, it’s one of the top ten no-load, retail funds in its class.  If you extend the comparison from its inception to now, it’s one of the top five.  The only funds with a record comparable or superior to Payden are:

Homestead Short-Term Bond (HOSBX)

Janus Short-Term Bond (JNSTX)

Vanguard Short Term Bond Index (VBISX)

Vanguard Short Term Investment-Grade (VFSTX)

There are a couple other intermediate-term bond funds that have recently shortened their interest rate exposures enough to be considered short-term, but since that’s a purely tactical move, we excluded them.

How might Payden be distinguished from other funds at the top of its class? 

  • Its international stake is far higher.  The fund invests at least 40% of its portfolio internationally, while it’s more distinguished competitors are in the 10-15% range.  That becomes important if you assume, as many professionals do, that the long US bull market for bonds has reached its end.  At that point, Payden’s ability to gain exposure to markets at different points in the interest rate cycle may give it a substantial advantage.
  • Its portfolio flexibility is more substantial.  Payden has the freedom to invest in domestic, developed and emerging-markets debt, both corporate and sovereign, but also in high-yield bonds, asset- and mortgage-backed securities.   Most of its peers are committed to the investment-grade portion of the market.
  • Its parent company specializes, and has specialized for decades, in low duration and international fixed-income investing.  At $80 million, this fund represents 0.1% of the firm’s assets and barely 0.25% of its low-duration assets under management.  Payden has a vast amount of experience in managing money in such strategies for institutions and other high net worth investors.  Mary Beth Syal, the lead manager who has been with Payden since 1991, describes this as their “all-weather, global macro front-end (that is, short duration) portfolio.”

Are there reasons for caution?  Because this is an assertive take on an inherently conservative strategy, there are a limited number of concerns worth flagging:

  • No one much at Payden and Rygel has been interested in investing in the fund. None of the managers have placed their money in the strategy nor has the firm’s founder, and only one trustee has a substantial investment in the fund.  The research is pretty clear that funds with substantial manager and trustee investment are, on whole, better investments than those without.   It’s both symbolically and practically a good thing to see managers tying their personal success directly to their investors’.  That said, the fund has amassed an entirely admirable record.
  • The fund shifted focus somewhat in 2008.  The managers describe the pre-2008 fund as much more “credit-focused” and the revised version as more global, perhaps more opportunistic and certainly more able to draw on a “full toolkit” of options and strategies.
  • The lack of a legitimate peer group will obligate investors to assess performance beyond the stars.  With only a small handful of relatively global, relatively low duration competitors in existence and no closely-aligned Lipper or Morningstar peer group, the relative performance numbers and ratings in the media will continue to mislead.  Investors will need to get comfortable with ignoring ill-fit ratings.

Bottom line

For a long time, fixed-income investing has been easy because every corner of the bond world has, with admirable consistency, gone up.  Those days are past.  In the years ahead, flexibility and opportunism coupled with experienced, disciplined management teams will be invaluable.  Payden offers those advantages.  The fund has a strong record, 4.5% annual returns over the past 17 years and a maximum drawdown of just 4.25% (during the 2008 market melt), a broad and stable management team and the resources of large analyst corps to draw upon.  This surely belongs on the due-diligence list for any investor looking to take a step or two beyond the microscopic returns of cash-management funds.

Company website

Payden Global Low Duration

Fact Sheet

© Mutual Fund Observer, 2013. All rights reserved. The information here reflects publicly available information current at the time of publication. For reprint/e-rights contact us.
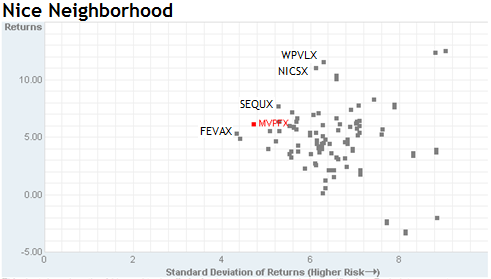
Bridgeway Managed Volatility (BRBPX), January 2013

By David Snowball

Objective and Strategy

To provide high current return with less short-term risk than the stock market, the Fund buys and sells a combination of stocks, options, futures, and fixed-income securities. Up to 75% of the portfolio may be in stocks and options.  They may short up to 35% via index futures.  At least 25% must be in stocks and no more than 15% in foreign stocks.  At least 25% will be in bonds, but those are short-term Treasuries with an average duration of five months (the manager refers to them as “the anchor rather than the sail” of the fund).  They will, on average, hold 150-200 securities.

Adviser

Bridgeway Capital Management.  The first Bridgeway fund – Ultra Small Company – opened in August of 1994.  The firm has 11 funds and 60 or so separate accounts, with about $2 billion under management.  Bridgeway’s corporate culture is famously healthy and its management ranks are very stable.

Managers

Richard Cancelmo is the lead portfolio manager and leads the trading team for Bridgeway. He joined Bridgeway in 2000 and has over 25 years of investment industry experience, including five years with Cancelmo Capital Management and The West University Fund. He has been the fund’s manager since inception.

Management’s stake

Mr. Cancelmo has been $100,000 and $500,000 invested in the fund.  John Montgomery, Bridgeway’s president, has an investment in that same range.  Every member of Bridgeway’s board of trustees also has a substantial investment in the fund.

Opening date

June 29, 2001.

Minimum investment

$2000 for both regular and tax-sheltered accounts.

Expense ratio

0.95% on assets of $29.8 million, as of June 2023. 

Comments

They were one of the finest debate teams I encountered in 20 years.  Two young men from Northwestern University.  Quiet, in an activity that was boisterous.  Clean-cut, in an era that was ragged.  They pursued very few argumentative strategies, but those few were solid, and executed perfectly. Very smart, very disciplined, but frequently discounted by their opponents.  Because they were unassuming and their arguments were relatively uncomplicated, folks made the (fatal) assumption that they’d be easy to beat.   Toward the end of one debate, one of the Northwesterners announced with a smile: “Our strategy has worked perfectly.  We have lulled them into mistakes.  In dullness there is strength!”

Bridgeway Balanced is likewise.  This fund has very few strategies but they are solid and executed perfectly.  The portfolio is 25 – 75% mid- to large-cap domestic stocks, the remainder of the portfolio is (mostly Treasury) bonds.  Within the stock portfolio, about 60% is indexed to the S&P 500 and 40% is actively managed using Bridgeway’s computer models.  Within the actively managed part, half of the picks lean toward value and half toward growth.  (Yawn.)  But also – here’s the exciting dull part – particularly within the active portion of the portfolio, Mr. Cancelmo has the ability to substitute covered calls and secured puts for direct ownership of the stocks!  (If you’re tingling now, it’s probably because your legs have fallen asleep.)

These are financial derivatives, called options.  I’ve tried six different ways of writing a layperson’s explanation for options and they were all miserably unclear.  Suffice it to say that the options are a tool to generate modest cash flows for the fund while seriously limiting the downside risk and somewhat limiting the upside potential.  At base, the fund sacrifices some Alpha in order to seriously limit Beta.  The strategy requires excellent execution or you’ll end up losing more on the upside than you gain on the downside.

But Bridgeway seems to be executing exceedingly well.  From inception through late December, 2012, BRBPX turned $10,000 into $15,000.  That handily beats its long/short funds peer group ($12,500) and the 700-pound gorilla of option strategy funds, Gateway (GATEX, $14,200).  Those returns are also better than those for the moderate allocation group, which exposes you to 60% of the stock market’s volatility against Bridgeway’s 40%. They’ve accomplished those gains with little volatility: for the past decade, their standard deviation is 7 (the S&P 500 is 15) and their beta is 0.41. 

This occurs within the context of Bridgeway’s highly principled corporate structure: small operation, very high ethical standards, unwavering commitment to honest communication with their shareholders (if you need to talk to founder John Montgomery or Mr. Cancelmo, just call and ask – the phone reps are in the same office suite with them and are authorized to ring straight through),  modest salaries (they actually report them – Mr. Cancelmo earned $423,839 in 2004 and the company made a $12,250 contribution to his IRA), a commitment to contribute 50% of their profits to charity, and a rule requiring folks to keep their investable wealth in the Bridgeway funds.

Very few people have chosen to invest in the fund – net assets are around $24 million, down from a peak of $130 million. Not just down, but steadily and consistently down even as performance has been consistently solid.  I’ve speculated elsewhere about the cause of the decline: a mismatch with the rest of the Bridgeway line-up, a complex strategy that’s hard for outsiders to grasp and to have confidence in, and poor marketing among them.  Given Bridgeway’s commitment to capping fees, the decline is sad and puzzling but has limited significance for the fund’s shareholders.

Bottom line

“In dullness, there is strength!”  For folks who want some equity exposure but can’t afford the risk of massive losses, or for any investor looking to dampen the volatility of an aggressive portfolio, Bridgeway Managed Volatility – like Bridgeway, in general – deserves serious consideration.

Company website

Bridgeway Managed Volatility

Fact Sheet

© Mutual Fund Observer, 2013. All rights reserved. The information here reflects publicly available information current at the time of publication. For reprint/e-rights contact us.

Cromwell Marketfield L/S Fund (formerly Marketfield Fund), (MFLDX), July 2012

By David Snowball

At the time of publication, this fund was named Marketfield Fund.

Objective

The fund pursues capital appreciation by investing in a changing array of asset classes.  They use a macroeconomic strategy focused on broad trends and execute the strategy by purchasing baskets of securities, often through ETFs.  They can have 50% of the portfolio invested in short sales, 50% in various forms of derivatives, 50% international, 35% in emerging market stocks, and 30% in junk bonds.

Adviser

Marketfield Asset Management, LLC.  Marketfield is a registered investment advisor that offers portfolio management to a handful of private and institutional clients. The firm is an absolute return manager that attempts “to provide returns on capital substantially in excess of the risk free rate rather than matching any particular index or external benchmark.” They have $2 billion in assets under management in MFLDX and a hedge fund and a staff of 13.  They’re currently owned by Oscar Gruss & Son Incorporated but were sold to New York Life in June 2012.

Manager

Michael C. Aronstein is the portfolio manager, president and CEO. He’s managed the fund since its inception in 2007. He’s been the chief investment strategist of Oscar Gruss & Son since 2004. From 2000 to 2004, he held the same title at the Preservation Group, an independent research firm. He has prior portfolio management experience at Comstock Partners, where he served as president from 1986 to 1993. He was also responsible for investment decisions as president of West Course Capital between 1993 and 1996. Mr. Aronstein holds a B.A. from Yale University and has accumulated over 30 years of investment experience.

Management’s Stake in the Fund

As of 12/31/2011, Mr. Aronstein had $500,001 – $1,000,000 in the fund. As of December 31, 2011, no Trustee or officer of the Trust  owned shares of the Fund or any other funds in the Trust.

Opening date

July 31, 2007.

Minimum investment

The minimum initial investment is $2,000 for investor class shares and $1000 for IRA accounts. For institutional shares it is $100,000 or $25000 for IRA accounts. The subsequent investment minimum is $100 for all share classes. [April 2023]

Expense ratio

The investor class is 2.31%, the class C shares are 3.06%, and the institutional share class is 2.06%. All net of waivers which run through April 30, 2024. The assets under management are $154.8 million. 

Comments

A great deal of the decision to invest in Marketfield comes down to an almost religious faith in the manager’s ability to see what others miss or to exploit opportunities that they don’t have the nerve or mandate to pursue.  Mr. Aronstein “considers various factors” and “focuses on broad trends” then allocates the portfolio to assets “in proportions consistent with the Adviser’s evaluation of their expected risks and returns.”  Those allocations can include both hedging market exposure through shorts and hyping that exposure through leverage.
Mr. Aronstein’s writings have a consistently Ron Paul ring to them:

The current environment of non-stop fiscal crises is part of a long, secular reckoning between governments and free markets.  This is and will continue to be the dominant theme of this decade. The various forms of resolution to this fundamental conflict will be primary determinants of economic prospects for the next several generations.  In some sense, we are at a decision point of similar moment as was the case in the aftermath of World War II.

The expansion of government power is “an ill-conceived deception.  Placing the blame [for economic dislocations] on markets and economic freedom becomes the next resort.  This is the stage we are now entering.”  He expects the summer months to be dominated by “somber rhetoric about the tyranny of markets” (Shareholder Letter, 31 May 2012).  He is at least as skeptical of the governments in emerging markets (which he sees as often “ordering major industries to maintain unprofitable production, increase hiring, turn over most foreign exchange receipts, buy only from local supplies and support the current political leadership”) as in debased Europe.

The manager acts on those insights by establishing long or short positions, mostly through baskets of stocks.  As of its latest shareholder report (May 2012), the fund has long positions in U.S. firms which derive their earnings primarily in the U.S. market (home builders, regional banks, transportation companies and retailers).  It’s shorting “emerging markets and companies that are expected to derive much of their growth from strength in their economies.”   The most recent portfolio report (30 March 2012) reveals short positions against an array of individual emerging markets (China, Australia, Brazil, South Africa, Malaysia plus individual Spanish banks).  With an average turnover rate of 125% per year, the average position lasts nine months.

The fund’s returns have been outstanding.  Absolute returns (15% per year over the past three years), relative returns (frequently top decile among long-short funds) and risk-adjusted returns (a five-star rating from Morningstar and 1.24 Sharpe ratio) are all excellent.

This strategy is similar to that pursued by many of the so-called “global macro” hedge funds.  In Marketfield’s defense, those strategies have produced enviable long-term results.  Joseph Nicholas’s “Introduction to Global Macro Hedge Funds” (Inside the House of Money, 2006) reports:

From January 1990 to December 2005, global macro hedge funds have posted an average annualized return of 15.62 percent, with an annualized standard deviation of 8.25 percent. Macro funds returned over 500 basis points more than the return generated by the S&P 500 index for the same period with more than 600 basis points less volatility. Global macro hedge funds also exhibit a low correlation to the general equity market. Since 1990, macro funds have returned a positive performance in 15 out of 16 years, with only 1994 posting a loss of 4.31 percent.

Bottom Line

Other high-conviction, macro-level investors (c.f., Ken Heebner) have found themselves recognized as absolute geniuses and visionaries, right up to the moment when they’re recognized as absolute idiots and dinosaurs.  Commentators (including two surprisingly fawning pieces from Morningstar) celebrate Mr. Aronstein’s genius.  Few even discuss the fact that the fund has above average volatility, that its risk controls are unexplained, or that Mr. Aronstein’s apparently-passionate macroeconomic opinions might yet distort his judgment.  Or not.  A lot comes down to faith.

Of equal concern is the fund’s recently announced sale to New York Life, where it will join the MainStay line of funds.  The fund will almost-certainly gain a 5.5% sales load in October 2012 and MainStay’s sales force will promote the fund with vigor.  Assets have already grown twenty-fold in three years (from under $100 million at the end of 2009 to $2 billion in mid-2012).  It will certainly grow larger with an active sales force.   Absent a commitment to close the fund at a predetermined size (“when the board determines it’s in the best interests of the shareholders” is standard text but utterly meaningless) or evidence of the strategy’s capacity (that is, the amount of assets it can accommodate without losing the ability to execute its strategy), this sale should raise a cautionary flag.

Fund website

Marketfield Fund, though mostly it’s just a long list of links to fund documents including Josh Charney’s two enthusiastic Morningstar pieces.

© Mutual Fund Observer, 2012. All rights reserved. The information here reflects publicly available information current at the time of publication. For reprint/e-rights contact us.

Huber Small Cap Value (formerly Huber Capital Small Cap Value), (HUSIX), June 2012

By David Snowball

At the time of publication, this fund was named Huber Small Cap Value.
This fund was formerly named Huber Capital Small Cap Value.

Objective and Strategy

The fund seeks long-term capital appreciation by investing in common stocks of U.S. small cap companies.  Small caps are those in the range found in the Russell 2000 Value index, roughly $36 million – $3.0 billion.  The manager looks for undervalued companies based, in part, on his assessment of the firm’s replacement cost; that is, if you wanted to build this company from the ground up, what would it cost?  The fund has a compact portfolio (typically around 40 names).  Nominally it “may make significant investments in securities of non-U.S. issuers” but the manager typically pursues U.S. small caps, some of which might be headquartered in Canada or Bermuda.  As a risk management tool, the fund limits individual positions to 5% of assets and individual industries to 15%.

Adviser

Huber Capital Management, LLC, of Los Angeles.  Huber has provided investment advisory services to individual and institutional accounts since 2007.  The firm has about $1.2 billion in assets under management, including $35 million in its two mutual funds.

Manager

Joseph Huber.  Mr. Huber was a portfolio manager in charge of security selection and Director of Research for Hotchkis and Wiley Capital Management from October 2001 through March 2007, where he helped oversee over $35 billion in U.S. value asset portfolios.  He managed, or assisted with, a variety of successful funds across a range of market caps.  He is assisted by four other investment professionals.

Management’s Stake in the Fund

Mr. Huber has over a million dollars in each of the Huber funds.  The most recent Statement of Additional Information shows him owning more than 20% of the fund shares (as of February 2012).  The firm itself is 100% employee-owned.

Opening date

June 29, 2007.  The former Institutional Class shares were re-designated as Investor Class shares on October 25, 2011, at which point a new institutional share class was launched.

Minimum investment

$5,000 for regular accounts and $2,500 for retirement accounts.

Expense ratio

1.75% on assets of $57.3 million, as of July 2023.  The expense ratio is equal to the gross expense ratio. 

Comments

Huber Small Cap Value is a remarkable fund, though not a particularly conservative one.

There are three elements that bring “remarkable” to mind.

The returns have been remarkable.  In 2012, HUSIX received the Lipper Award for the strongest risk adjusted return for a small cap value fund over the preceding three years.  (Its sibling was the top-performing large cap value one.)   From inception through late May, 2012, $10,000 invested in HUSIX would have grown to $11,650.  That return beats its average small-cap value ($9550) as well as the three funds designated as “Gold” by Morningstar analysts:  DFA US Small Value (DFSVX, $8900), Diamond Hill Small Cap (DHSCX, $10,050) and Perkins Small Cap Value (JDSAX, $8330).

The manager has been remarkable.  Mr. Huber was the Director of Research for Hotchkis-Wiley, where he also managed both funds and separate accounts. In six years there, his charges beat the Russell 2000 Value index five times, twice by more than 2000 basis points.  Since founding Huber Capital, he’s beaten the Russell 2000 Value in three of five years (including 2012 YTD), once by 6000 basis points.  In general, he accomplishes that with less volatility than his peers or his benchmark.

The investment discipline is remarkable.  Mr. Huber takes the business of establishing a firm’s value very seriously.  In his large cap fund, his team attempts to disaggregate firms; that is, to determine what each division or business line would be worth if it were a free-standing company.  Making that determination requires finding and assessing firms, often small ones that actually specialize in the work of a larger firm’s division.  That’s one of the disciplines that lead him to interesting small cap ideas.

They start by determining how much a firm can sustainably earn.  Mr. Huber writes:

 Of primary importance to our security selection process is the determination of ‘normal’ earnings. Normal earnings power is the sustainable cash earnings level of a company under equilibrium economic and competitive market conditions . . . Estimates of these sustainable earnings levels are based on mean reversion adjusted levels of return on equity and profit margins.

Like Jeremy Grantham of GMO, Mr. Huber believes in the irresistible force of mean reversion.

Over long time periods, value investment strategies have provided greater returns than growth strategies. Excess returns have historically been generated by value investing because the average investor tends to extrapolate current market trends into the future. This extrapolation leads investors to favor popular stocks and shun other companies, regardless of valuation. Mean reversion, however, suggests that companies generating above average returns on capital attract competition that ultimately leads to lower levels of profitability. Conversely, capital tends to leave depressed areas, allowing profitability to revert back to normal levels. This difference between a company’s price based on an extrapolation of current trends and a more likely reversion to mean levels creates the value investment opportunity.

The analysts write “Quick Reports” on both the company and its industry.  Those reports document competitive positions and make preliminary valuation estimates.  At this point they also do a “red flag” check, running each stock through an 80+ point checklist that reflects lessons learned from earlier blow-ups (research directors obsessively track such things).  Attractive firms are then subject to in-depth reviews on sustainability of their earnings.  Their analysts meet with company management “to better understand capital allocation policy, the return potential of current capital programs, as well as shareholder orientation and competence.”

All of that research takes time, and signals commitment.  The manager estimates that his team devotes an average of 260 hours per stock.  They invest in very few stocks, around 40, which they feel offers diversification without dilution.   And they hold those stocks for a long time.  Their 12% turnover ratio is one-quarter of their peers’.  We’ve been able to identify only six small-value funds, out of several hundred, that hold their stocks longer.

There are two reasons to approach the fund with some caution.  First, by the manager’s reckoning, the fund will underperform in extreme markets.  When the market is melting up, their conservatism and concern for strong balance sheets will keep them away from speculative names that often race ahead.  When the market is melting down, their commitment to remain fully invested and to buy more where their convictions are high will lead them to move into the teeth of a falling market.  That seems to explain the only major blemish on the fund’s performance record: they substantially trailed their peers in September, October and November of 2008 when HUSIX lost 46% in value.  In fairness, that discipline also set up a ferocious rebound in 2009 when the fund gained 86% and the stellar three-year run for which they earned the Lipper Award.

Second, the fund’s fees are high and likely to remain so.  Their management fee is 1.35% on the first $5 billion in assets, falling to 1% thereafter.  Management calculates that their strategy capacity is just $1 billion (that is, the amount that might be managed in both the fund and separate accounts).  As a result, they’re unlikely to reach that threshold in the fund ever.  The management fees charged by entrepreneurial managers vary substantially.  Chuck Akre of Akre Focus (AKREX) values his own at 0.9% of assets, John Walthausen of Walthausen Small Cap Value (WSCVX) charges 1.0% and John Deysher at Pinnacle Value (PVFIX) charges 1.25%, while David Winter of Wintergreen (WGRNX) charges 1.5%.  That said, this fund is toward the high end.

Bottom Line

Huber Small Cap has had a remarkable three-year run, and its success has continued into 2012.  The firm has in-depth analyses of that period, comparing their fund’s returns and volatility to an elite group of funds.  It’s clear that they’ve consistently posted stronger returns with less inconsistency than almost any of their peers; that is, Mr. Huber generates substantial alpha.  The autumn of 2008 offers a useful cautionary reminder that very good managers can (will and, perhaps, must) from time to time generate horrendous returns.  For investors who understand that reality and are able to tolerate “being early” as a condition of long-term outperformance, HUSIX justifies as close a look as any fund launched in the past several years.

Fund website

Huber Capital Small Cap Value Fund

April 30, 2023 Semi-Annual Report

Fact Sheet 3/31/2023

© Mutual Fund Observer, 2012. All rights reserved. The information here reflects publicly available information current at the time of publication. For reprint/e-rights contact us.

LKCM Balanced Fund (LKBAX), May 2012 update

By David Snowball

Objective

The fund seeks current income and long-term capital appreciation. The managers invest in a combination of blue chip stocks, investment grade intermediate-term bonds, convertible securities and cash. In general, at least 25% of the portfolio will be bonds. In practice, the fund is generally 70% equities, though it dropped to 60% in 2008. The portfolio turnover rate is modest. Over the past five calendar years, it has ranged between 12 – 38%.

Adviser

Founded in 1979 Luther King Capital Management provides investment management services to investment companies, foundations, endowments, pension and profit sharing plans, trusts, estates, and high net worth individuals. Luther King Capital Management has seven shareholders, all of whom are employed by the firm, and 29 investment professionals on staff. As of December, 2011, the firm had about $9 billion in assets. They advise the five LKCM funds and the three LKCM Aquinas funds, which invest in ways consistent with Catholic values.

Manager

Scot Hollmann, J. Luther King and Mark Johnson. Mr. Hollman and Mr. King have managed the fund since its inception, while Mr. Johnson joined the team in 2010.

Management’s Stake in the Fund

Hollman has between $500,000 and $1,000,000 in the fund, Mr. King has over $1 million, and Mr. Johnson continues to have a pittance in the fund

Opening date

December 30, 1997.

Minimum investment

$2,000 across the board, down from $10,000 prior to October 2011.

Expense ratio

0.80%, after waivers, on an asset base of $111.3 million (as of July 17, 2023).

Comments

Our original, May 2011 profile of LKCM Balanced made two arguments.  First, for individual investors, simple “balanced” fund make a lot more sense than we’re willing to admit.  We like to think that we’re indifferent to the stock market’s volatility (we aren’t) and that we’ll reallocate our assets to maximize our prospects (we won’t).  By capturing more of the stock market’s upside than its downside, balanced funds make it easier for us to hold on through rough patches.  Morningstar’s analysis of investor return data substantiated the argument.

Second, there are no balanced funds with consistently better risk/return profiles than LKCM Balanced.  We examined Morningstar data in April 2011, looking for balanced funds which could at least match LKBSX’s returns over the past three, five and ten years while taking on no more risk.  There were three very fine no-load funds that could make its returns (Northern Income Equity, Price Capital Appreciation, Villere Balanced, and LKCM) but none that could do so with as little volatility.

We attributed that success to a handful of factors:

Quiet discipline, it seems. Portfolio turnover is quite low, in the mid-teens to mid-20s each year. Expenses, at 0.8%, are low, period, and remarkably low for such a small fund. The portfolio is filled with well-run global corporations (U.S. based multinationals) and shorter-duration, investment grade bonds.

In designating LKBAX a “Star in the Shadows,” we concluded:

This is a singularly fine fund for investors seeking equity exposure without the thrills and chills of a stock fund. The management team has been stable, both in tenure and in discipline. Their objective remains absolutely sensible: “Our investment strategy continues to focus on managing the overall risk level of the portfolio by emphasizing diversification and quality in a blend of asset classes.”

The developments of the past year are all positive.  First, the fund yet again outperformed the vast majority of its peers.  Its twelve month return, as of the end of April 2012, placed it in the top 5% of its peer group and its five year return is in the top 4%.  Second, it was again less volatile than its peers – it held up about 25% better in downturns than did its peer group.  Third, the advisor reduced the minimum initial purchase requirement by 80% – from $10,000 to $2,000. And the expense ratio dropped by one basis point.

We commissioned an analysis of the fund by the folks at Investment Risk Management Systems (a/k/a FundReveal), who looked at daily volatility and returns, and concluded :

LKBAX is a well managed Moderate Allocation fund. It has maintained “A-Best” rating over the last 5 and 1 years, and has recently moved to a “C-Less Risky” rating over the last 63 days. Its volatility is well below that of S&P 500 over these time periods.

Its Persistence Rating is 50, indicating that it has reasonable chance of producing higher than S&P 500 Average Daily Returns at lower risk. Over the last 20 rolling quarters it has moved between “A-Best” and “C-Less Risky” ratings.

Amongst the Moderate Allocation sector it stands out as a one of the best managed funds over the last year

Despite that, assets have barely budged – up from about $19 million at the end of 2010 to $21 million at the end of 2011.  That’s attributable, at least in part, to the advisor’s modest marketing efforts. Their website is static and rudimentary, they don’t advertise, they’re not located in a financial center (Fort Worth), and even their annual reports offer one scant paragraph about each fund:

The LKCM Balanced Fund’s blend of equity and fixed income securities, along with stock selection, benefited the Fund during the year ended December 31, 2011. Our stock selection decisions in the Energy, Consumer Discretionary, Information Technology and Materials sectors benefited the Fund’s returns, while stock selection decisions in the Healthcare and Consumer Staples sectors detracted from the Fund’s returns. The Fund continued to focus its holdings of fixed income securities on investment grade corporate bonds, which generated income for the Fund and dampened the overall volatility of the Fund’s returns during the year.

Bottom Line

LKCM Balanced (with Tributary Balanced, Vanguard Balanced Index and Villere Balanced) is one of a small handful of consistently, reliably excellent balanced funds. Its conservative portfolio will lag its peers in some years, especially those favoring speculative securities.  Even in those years, it has served its investors well: in the three years since 2001 where it ended up in the bottom quarter of its peer group, it still averaged an 11.3% annual return.  This is really a first –rate choice.

Fund website

LKCM Balanced Fund

LKCM Funds Annual Report 2022

© Mutual Fund Observer, 2012. All rights reserved. The information here reflects publicly available information current at the time of publication. For reprint/e-rights contact us.

Marathon Value (MVPFX), August 2011

By Editor

*On December 12, 2022, Green Owl Intrinsic Value Fund (GOWLX) and Marathon Value Portfolio (MVPFX)  were merged and converted into a new Kovitz Core Equity ETF (EQTY) along with over $500 million of assets from separately managed accounts. The ETF adopted the record and strategy of the Green Owl Fund. In consequence, the information for Marathon Value should be read for archival purposes only.*

Objective

To provide shareholders with long-term capital appreciation in a well-diversified portfolio.  They invest primarily in U.S. mid- to large caps, though the portfolio does offer some international exposure (about 10% in mid-2011) and some small company exposure (about 2%).   On average, 80% of the portfolio is in the stock market while the rest is in cash, short term bonds and other cash equivalents.  The manager looks to buy stocks that are “relatively undervalued,” though Morningstar generally describes the portfolio as a blend of styles.  The core of the portfolio is in “sound businesses [with] dedicated, talented leaders” though they “sometimes may invest opportunistically in companies that may lack one of these qualities.”  The portfolio contains about 80 stocks and turnover averages 30% per year.

Adviser

Spectrum Advisory Services, an Atlanta based investment counseling firm whose clients include high net worth individuals and pension and profit sharing plans.  In addition to advising this fund, Spectrum manages over $415 million in taxable, retirement and charitable accounts for high net worth individuals and institutions.

Manager

Marc S. Heilweil.  Mr. Heilweil is President of Spectrum.  He founded the firm in 1991 and has managed Marathon since early 2000.  He received both his B.A. and his J.D. from Yale.

Management’s Stake in the Fund

Mr. Heilweil has over $1 million invested, and is the fund’s largest shareholder.

Opening date

The original fund launched on March 12, 1998 but was reorganized and re-launched under new management in March 2000.

Minimum investment

$2,500 across the board.

Expense ratio

1.23% on assets of $41 million (as of 6/30/2011). Update – 1.25% on assets of nearly $42 million (as of 1/15/2012.)

Comments

It’s not hard to find funds with great returns.  Morningstar lists them daily, the few surviving financial magazines list them monthly and The Wall Street Journal lists them quarterly.  It’s considerably harder to find funds that will make a lot of money for you. The indisputable reality is that investors get greedy any time that the market hasn’t crashed in 12 months and are delusional about their ability to stick with a high-return investment.   Many funds with spectacular absolute returns have earned very little for their investors because the average investor shows up late (after the splendid three-year returns have been publicized) and leaves early (after the inevitable overshoot on the downside).

The challenge is to figure out what your portfolio needs to look like (that is, your mix of stocks, bonds and cash and how much you need to be adding) in order for you to have a good chance of achieving your goals, and then pick funds that will give you exposure to those assets without also giving you vertigo.

For investors who need core stock exposure, little-known Marathon Value offers a great vehicle to attempt to get there safely and in comfort.  The manager’s discipline is unremarkable.  He establishes a firm’s value by looking at management strength (determined by long-term success and the assessment of industry insiders) and fundamental profitability (based on a firm’s enduring competitive advantages, sometimes called its “economic moat”).  If a firm’s value exceeds, “by a material amount,” its current share price, the manager will look to buy.  He’ll generally buy common stock, but has the option to invest in a firm’s high-yield bonds (up to 10% of the portfolio) or preferred shares if those offer better value.   Occasionally he’ll buy a weaker firm whose share price is utterly irrational.

The fund’s April 2011 semi-annual report gives a sense of how the manager thinks about the stocks in his portfolio:

In addition to Campbell, we added substantially to our holdings of Colgate Palmolive in the period.  Concerns about profit margins drove it to a price where we felt risk was minimal. In the S&P 500, Colgate has the second highest percentage of its revenues overseas.  Colgate also is a highly profitable company with everyday products.  Colgate is insulated from private label competition, which makes up just 1% of the toothpaste market.  Together with Procter & Gamble and Glaxo Smithkline, our fund owns companies which sell over half the world’s toothpaste.  While we expect these consumer staples shares to increase in value, their defensive nature could also help the fund outperform in a down market.

Our holdings in the financial sector consist of what we consider the most careful insurance underwriters, Alleghany Corp., Berkshire Hathaway and White Mountain Insurance Group.  All three manage their investments with a value bias.  While Berkshire was purchased in the fund’s first year, we have not added to the position in the last five years.  One of our financials, U.S. Bancorp (+7%) is considered the most conservatively managed of the nation’s five largest banks.  The rest of our financial holdings are a mix of special situations.

There seems nothing special about the process, but the results place Marathon among the industry’s elite.  Remember: the goal isn’t sheer returns but strong returns with limited risk.  Based on those criteria, Marathon is about as good as a stock fund gets.  For “visual learners,” it’s useful to glance at a risk-return snapshot of domestic equity funds over the past three years.

Here’s how to read the chart: you want to be as close as possible to the upper-left corner (infinite returns, zero risk).  The closer you get, the better you’re being served by your manager.  Five funds define a line of ideal risk/return balance; those are the five dots in a row near the upper-left.  Who are they?  From lower return/lower risk, they are:

First Eagle US Value (FEVAX): five stars, $1.8 billion in assets, made famous by Jean-Marie Eveillard.

Marathon Value (MVPFX): five stars for the past three-, five- and ten-year periods, as well as since inception, but with exceedingly modest assets.

Sequoia (SEQUX): five stars, $4.4 billion in assets, made famous by Bill Ruane and Bob Goldfarb, closed to new investors for a quarter century.

Nicholas (NICSX): five stars for the past three years, $1.7 billion, low turnover, willing to hold cash, exceedingly cautious, with the same manager (Ab Nicholas) for 41 years.

Weitz Partners Value (WPVLX): five stars over the past three years, $710 million in assets, run by Wally Weitz for 28 years.

That’s a nice neighborhood, and the funds have striking similarities: a commitment to high quality investments, long-tenured managers, low turnover, and a willingness to hold cash when circumstances dictate.  Except for Marathon, they average $2 billion in assets.

Fans of data could search Morningstar’s database for domestic large cap stock funds that, like Marathon, have “low risk” but consistently better long-term returns than Marathon.  There are exactly three funds (of about 1300 possibles) that meet those criteria: the legendary Sequoia, Amana Income (AMANX) and Auxier Focus (AUXFX), both of which are also profiled as “stars in the shadows.”

Regardless of how you ask the question, you seem to get the same answer: over Mr. Heilweil’s decade with the fund, it has consistently taken on a fraction of the market’s volatility (its beta value is between 74 and 76 over the past 3 – 10 years and Morningstar calculates its “downside capture ratio” as 68%). Alan Conner from Spectrum reports that Marathon is the 11th least volatile large core fund of near 1800 that Morningstar tracks. At the same time, it produces decent if not spectacular returns in rising markets (it captures about 82% of the gains in a rising market).  That combination lets it post returns in the top 10% of its peer group over the past 3 – 10 years.

Because Mr. Heilweil is in his mid 60s and the fund depends on his skills, potential investors might reasonably ask about his future.  Mr. Conner says that Heilweil intends to be managing the fund a decade from now.  The fund represents a limited piece of Heilweil’s workload, which decreases the risk that he’ll become bored or discouraged with it.

Bottom Line

If you accept the arguments that (a) market volatility will remain a serious concern and (b) high-quality firms remain the one undervalued corner of the market, then a fund with a long record of managing risk and investing in high-quality firms makes great sense.  Among funds that fit that description, few have compiled a stronger record than Marathon Value.

Fund website

Marathon Value Portfolio, though the website has limited and often outdated content.

© Mutual Fund Observer, 2011.  All rights reserved.  The information here reflects publicly available information current at the time of publication.  For reprint/e-rights contact [email protected].

Tocqueville Select Fund (TSELX), January 2012

By Editor

*The fund has been liquidated.*

Objective and Strategy

Tocqueville Select Fund pursues long-term capital appreciation by investing in a focused group of primarily small and mid-sized U.S. stocks. The portfolio, as of 9/30/11, is at the high end of its target of 12 to 25 stocks.  The managers pursue a bottom-up value approach, with special delight in “special situations” (that is, companies left for dead by other investors).  The fund can hedge its market exposure, but cannot short.  It can invest in fixed-income instruments, but seems mostly to hold stocks and cash.   Cash holdings are substantial, often 10 – 30% of the portfolio.

Adviser

Tocqueville Asset Management, which “has been managing private fortunes for more than 30 years.”  They serve as advisor to six Tocqueville funds, including the two former Delafield funds. The Advisor has been in the public asset management business since 1990 and. as of January, 2011, had more than $10.8 billion in assets under management.

Managers

J. Dennis Delafield, Vincent Sellecchia, and Donald Wang.  Mr. Delafield founded Delafield Asset Management in 1980 which became affiliated with Reich & Tang Asset Management in 1991. He and his team joined Tocqueville in 2009.  Mr. Sellecchia worked with Delafield at Reich & Tang and Delafield.  He and Delafield have co-managed The Delafield Fund since 1993. Mr. Wang seems to be the junior partner (though likely a talented one), having served as an analyst on The Delafield Fund and with Lindner funds.  Mr. Sellechia was the first manager (1998) of the partnership on which this fund is based, Mr. Wang came on board in 2003 and Mr. Delafield in 2005.

Management’s Stake in the Fund

Messrs Delafield and Sellecchia have each invested between $100,000 – 500,000 in Select and over $1 million in Delafield.   As of last report, Mr. Wang hadn’t joined the party.  Half of the fund’s trustees (4 of 8) have investments in the fund.

Opening date

Good question!  Select is the mutual fund successor to a private partnership, the Reich & Tang Concentrated Portfolio L.P.  The partnership opened on July 31, 1998.  On September 28 2008, it became Delafield Select Fund (a series of Natixis Funds Trust II) and one year later, it became The Select Fund (a series of The Tocqueville Trust).  This is to say, it’s a 13-year-old portfolio with a three-year record.

Minimum investment

$1000 for regular accounts, $250 for IRAs

Expense ratio

1.4% on $102 million in assets.  Assets jumped from $60 million to $100 million in the months after Morningstar, in September 2011, released its first rating for the fund. There’s also a 2% redemption fee on shares held under 120 days.

Comments

Have you ever thought about how cool it would be if Will Danoff ran a small fund again, rather than the hauling around $80 billion in Contrafund assets?  Or if Joel Tillinghast were freed of the $33 billion that Low-Priced Stock carries?  In short, if you had a brilliant manager suddenly free to do bold things with manageable piles of cash?  If so, you grasp the argument for The Select Fund.

Tocqueville Select Fund is the down-sized, ramped-up version of The Delafield Fund (DEFIX).  The two funds have the same management team, the same discipline and portfolios with many similarities.  Both have very large cash stakes, about the same distribution of stocks by size and valuation, about the same international exposure, and so on.  Both value firms with good management teams and lots of free cash flow, but both make their money off “financially troubled” firms. The difference is that Select is (1) smaller, (2) more concentrated and (3) a bit more aggressive.

All of which is a very good thing for modestly aggressive equity investors.  Delafield is a great fund, which garners only a tiny fraction of the interest it warrants.  Morningstar analysis Michael Breen, in September 2010, compared Delafield to the best mid-cap value funds (Artisan, Perkins, Vanguard) and concluded that Delafield was decisively better.

Its 11.4% annual gain for the past decade is the best in its category by a wide margin, and its 15-year return is nearly as good. And a look at upside and downside capture ratios shows this fund is the only one in the group that greatly outperformed the Russell Mid Cap Value Index in up and down periods the past 10 years.

Delafield Select was ever better.  Over the ten years ending 12/29/2011, the Select Portfolio would have turned $10,000 into $27,800 returned 14.5% while an investment in its benchmark, the Russell 2000, would have grown to $17,200.  Note that 70% of that performance occurred as a limited partnership, though the partnership’s fees were adjusted to make the performance comparable to what Select might have charged over that period.

That strong performance, however, has continued since the fund’s launch.  $10,000 invested at the fund’s inception would now be worth $13,200; the benchmark return for the same period would be $11,100.

The fund has also substantially outperformed its $1.3 billion sibling Delafield Fund, both from the inception of the partnership and from inception of the mutual fund.

The red flag is volatility.  The fund has four distinctive characteristics which would make it challenging as a significant portion of your portfolio:

  1. It’s very concentrated for a small cap fund, it might hold as few as a dozen stocks and even its high end (25-30 stocks) is very, very low.
  2. It looks for companies which are in trouble but which the managers believe will right themselves.
  3. It invests a lot in microcap stocks: about 30% at its last portfolio report.
  4. It invests a lot in a few sectors: the portfolio is constructed company by company, so it’s possible for some sectors (materials, as of late 2011) to be overweighted by 600% while there’s no exposure at all to another six half sectors.

It’s not surprising that the fund is volatile: Morningstar ranks is as “above average” in risk.  What is surprising is that it’s not more volatile; by Morningstar’s measurement, its “downside capture” has been comparable to its average small-value peer while its upside has been substantially greater.

Bottom Line

This is not the only instance where a star manager converted a successful partnership into a mutual fund, and the process has not always been successful.   Baron Partners (BPTRX) started life as a private partnership and as the ramped-up version of Baron Growth (BGRFX), but has decisively trailed its milder sibling since its launch as a fund.  That said, the Delafield team seem to have successfully managed the transition and interest in the fund bounced in September 2011, when it earned its first Morningstar rating.  Investors drawn by the prospects of seeing what Delafield and company can do with a bit more freedom and only 5% of the assets might find this a compelling choice for a small slice of a diversified portfolio.

Fund website

Tocqueville Select Fund

Fact Sheet

© Mutual Fund Observer, 2012. All rights reserved. The information here reflects publicly available information current at the time of publication. For reprint/e-rights contact us.

Artisan Small Cap (ARTSX), December 2011

By Editor

Objective

The fund pursues “maximum long-term capital growth” by investing a broadly diversified portfolio of small cap growth stocks.  For their purposes, “small cap” means “under $2.5 billion in market cap at the time of purchase.”   As of 9/30/11, they held 70 stocks.  They cap individual positions at 3% of assets, though some might appreciate past that point.  They have small stakes in both developed (2.5%) and emerging (2.3%) markets.   The managers look for companies with at least two of the following franchise characteristics:

Low cost production capability,

Possession of a proprietary asset,

Dominant market share, or a

Defensible brand name.

If the stock is reasonably priced and they have reason to believe that the firm’s prospects are brightening, it becomes a candidate for acquisition.

Adviser

Artisan Partners of Milwaukee, Wisconsin.   Artisan has five autonomous investment teams that oversee twelve distinct U.S., non-U.S. and global investment strategies. Artisan has been around since 1995.  As of 9/31/2011 Artisan Partners had approximately $51 billion in assets under management.  That’s up from $10 billion in 2000. They advise the 12 Artisan funds, but only 6% of their assets come from retail investors.

Manager

The fund is managed by the same team that manages primarily-midcap Artisan Mid Cap (ARTMX) and primarily-large cap Artisan Growth Opportunities (ARTRX) funds.  The marquee name would be Andy Stephens, founding manager of ARTMX and, earlier, co-manager of Strong Asset Allocation.  Craig Cepukenas has been an analyst with the fund since 1995 and a co-manager since 2004.  The other team members (Mr. Stephens plus Jim Hamel, Matt Kamm, Jason White) joined in the last two years.   Their work is supported by seven analysts.

Management’s Stake in the Fund

Each of the managers invests heavily in each of the three funds.  Mr. Hamel has over a million in each fund and Mr. Stephens has over $2.5 million spread between the three, while the other managers (generally younger) have combined investments well over $100,000.

Opening date

March 28, 1995.

Minimum investment

$1000 for regular accounts, reduced to $50 for accounts with automatic investing plans.  Artisan is one of the few firms who trust their investors enough to keep their investment minimums low and to waive them for folks willing to commit to the discipline of regular monthly or quarterly investments.

Expense ratio

1.2%, on assets of $1.8 Billion (as of June 2023).

Comments

ARTSX was Artisan’s first fund, launched as a vehicle for Carlene Murphy Ziegler to showcase her talents.  Ziegler had been a star at Strong, and her new fund returned 35% in its first year, about 50% better than its peers.   In under a year, the fund had gathered $300 million in assets.  It closed to new investors in February of 1996, a decision for which it was rightly lauded.

And then, something happened.  The fund, mild-mannered by growth fund standards, lagged its peers during the “hot” years of the late 1990s, rallied briefly at the turn of the century, then settled back into a long decade of mediocre returns.  Artisan tried to reignite the fund by bringing in Ziegler’s former co-manager, Marina Carlson, but nothing seemed to work.  Even in its worst years the fund was never awful, but it was also never really good again.  Ziegler retired from managing the fund in 2008 and Carlson in 2009.

Then, in 2009, Artisan found the fix.  They gave management responsibility to their five-manager Growth Team.  Artisan’s fund management is structured around a series of team.  Each team has a distinctive style (US Value, International Value, Growth, Global Equity, and Emerging Markets) and each has a distinctive, consistent investment discipline.  As each team proves its ability to provide strong, consistent, risk-conscious performance in one arena, Artisan allows them to extend their process to another.  The U.S. Value team, for example, started with Small Cap Value (ARTVX), which was wildly successful and closed to new investors.  They began managing Mid Cap Value (ARTQX) in 2001, posted a series of exceedingly strong years, and decided to add the predominantly large cap Artisan Value (ARTLX) fund in 2006.  The Growth Team started with Mid Cap (1997), added Growth Opportunities (2008) and then Small Cap (2009).

The practice of keeping teams together for the long term, allowing them to perfect and then gradually extend their investment disciplines, has produced consistently strong results for Artisan’s investors.  With the exception of their Emerging Markets fund (which is not available to retail investors), over the last three years every Artisan fund has earned four or five stars from Morningstar and every one is ranked above average in Lipper’s ratings.  Regardless of the time period you check, no Artisan fund (excepting, again, Emerging Markets) has a Morningstar rating below three stars.

The managers’ discipline is clear and sensible.  One part of the discipline involves security selection: they try to find companies with a defensible economic moat and buy them while the price is low and the prospect for rising profits looms.  Philosophically, they are driven to hunt for accelerating profit cycles. Their edge comes, in part, from their ability to identify firms which are in the early stages of an accelerating profit cycle. Their intention is to get in early so they can benefit from a long period of rising profits. The other part is capital allocation: rather than pour money into a new holding, they begin with small positions in firms whose profits are just beginning to accelerate, increase that toward their 3% asset cap as the firm achieves sustained, substantial profits, and then begins selling down the position when the stock becomes overvalued or the firm’s profitability slips.

Since taking charge of Small Cap, the fund has performed exceptionally well.  $10,000 invested when Mr. Stephens & co. arrived would have grown to $13,800 (as of 11/29/11) while their average peer would have returned $12,700.  The fund posted weak relative and strong absolute returns during the “junk rally” in 2010, making 20.5% for its investors.  In 2011, the fund finished the first 11 months in the top 2% of its peer group with a return of 5.2% (compared to a loss of nearly 8% for its average peer).

Bottom Line

Artisan has an entirely admirable culture.  Their investment teams tend to stick together for long periods, with occasional promotions from the analyst ranks to recognize excellence.  They are uniformly risk conscious, deeply invested in their funds and singularly willing to close funds before asset bloat impairs performance.  As of December 2011, half of Artisan’s retail funds (five of 10) are closed to new investors.

The Growth Team follows that same pattern, and has posted strong records in their other charges and in their two-plus years here.  Investors looking for a rational small cap growth fund – one which is competitive in rising markets and exceptionally strong in rocky ones would be well-advised to look at the reborn Artisan Small Cap fund.

Fund website

Artisan Small Cap fund


© Mutual Fund Observer, 2011.  All rights reserved.  The information here reflects publicly available information current at the time of publication.  For reprint/e-rights contact [email protected].

SouthernSun Small Cap Fund (SSSFX), October 2011

By Editor

Objective

The fund seeks to provide long-term capital appreciation by investing in a focused portfolio of small cap U.S. stocks.  “Focused” translates to 20-40 stocks.  “Small cap” means comparable to those in the Russell 2000 index, which places it at the higher end of the small cap universe.  They limit individual holdings to 10% of the portfolio (yikes) and single industries to 25%.

Adviser

SouthernSun Asset Management, which is headquartered in Memphis, Tennessee.  The firm specializes in small- to mid-cap equity investing.  It was founded in 1989 by Michael Cook and has about $1.9 billion in assets under management (as of 09/11).  This is SouthernSun’s only mutual fund.

Manager

Michael Cook.  Mr. Cook is SouthernSun’s founder and he has managed this fund since inception.  He manages another $1.4 billion in other pooled and separate accounts.  He’s supported by five analysts.

Management’s Stake in the Fund

Mr. Cook has between $100,000 and $500,000 in the fund (as of December 2010).

Opening date

October 1, 2003.  Before November 2008, it was known as New River Small Cap Fund.

Minimum investment

$1000 for all account types.  The fund is available through a variety of platforms, including Fidelity, Schwab, Scottrade and TD Ameritrade.

Expense ratio

1.31% on assets of $388 million (as of July 2023).

Comments

SouthernSun has been recognized as the top-performing small cap value fund by both Morningstar and The Wall Street Journal.  In the 2010 Annual Report, the advisor was “pleased to report the Fund was ranked NUMBER ONE based on total return for the trailing twelve month period ending September 30, 2010 in Lipper’s Small Cap Value category out of 252 funds.”  That honor is dimmed only slightly by the fact that the fund’s portfolio is neither small cap nor value.

It is durn fine.  It’s just not small-value.

The advisor specializes in small and “SMID cap” strategies, and SSSFX has migrated slowly but steadily out of the pure small cap realm.  As of the last portfolio report, 60% of assets were invested in mid-cap stocks and the fund’s average market cap is $2.5 billion, substantially above its benchmark’s $800 million.  Likewise, the portfolio sports – by Morningstar’s calculation –  23% in growth stocks against 37% in value.  In the end, the current portfolio averages out to a sort of SMID-cap core.

That structure makes comparisons to the fund’s nominal peer group problematic.  SSSFX’s returns place it in the top 1-2% of all small-value funds, depending on the time period you track.

Even allowing for that difficulty, SSSFX is a stand-out fund.  Start with the assumption that its closest peer group would be core or blend funds that sit near the small- to mid-cap border.  Morningstar identifies 75 such funds.  Over the past 12 months (through 9/30/11), SSSFX has the second-highest returns in the group (behind Putnam Equity Spectrum “A” PYSAX).  SSSFX also finishes second on the past three years, trailing only Appleseed (APPLX).  No one in the group has a better five-year record.

What’s the manager doing?  He looks for firms with three characteristics:

Financial strength: generally measured by internally-generated cash flow

Management quality: measured by the presence of transparent, measurable goals that the managers – from the C-level on down – set and meet

Niche dominance: which is a sustainable competitive advantage created by superior products, processes or technologies.

As of September 2011, those criteria tilted the portfolio heavily toward industrial firms but entirely away from energy, communications and real estate.

The manager’s selection process seems slow, deliberate and labor intensive.  The 2010 Annual Report notes that they added one position in six months.  In the Barron’s profile, below, Mr. Cook reports sometimes adding one position in an entire year.

There are two concerns worth considering as you look at the fund:

It is highly concentrated, especially for a smaller cap fund.  Only nine of the 75 SMid-cap core funds place a greater fraction of their assets in their top ten holdings than does SouthernSun (47%).   That said, most of those concentrated funds (including Appleseed, FPA Capital FPPTX, Gratio Values GRVLX and Longleaf Partners Small Cap LLSCX) have posted strong risk-adjusted returns.

It is volatile, though not gut-wrenchingly so.   The fund’s five-year standard deviation (a measure of volatility) is 29.  By comparison, FPA Capital is 22, Longleaf is 24, and Vanguard Extended Market Index (WEXMX, which has a similar market cap though far lower concentration) is 27. Morningstar rates is as having above-average risk and Lipper rates it as “low” in capital preservation.  Both services agree, though, that the risk has been well-rewarded: Morningstar gives it “high” returns and Lipper makes it a “Lipper Leader” in the category.

Bottom Line

A strong track record earned in both small- and mid-cap investing, an efficient low-turnover style, reasonable asset base and a portfolio constructed slowly and with great deliberation makes a compelling case for keeping SSSFX on your short-list of flexible, diversifying funds.

Fund website

SouthernSun Funds.  For folks interested in his stock-picking, there was a nice interview with Mr. Cook in Barron’s, May 7, 2011.

Fact Sheet (Download)

© Mutual Fund Observer, 2011.  All rights reserved.  The information here reflects publicly available information current at the time of publication.  For reprint/e-rights contact [email protected].

Walthausen Small Cap Value Fund (WSCVX), September 2011

By Editor

*This fund is now called North Star Small Cap Value Fund*

Objective

The Fund pursues capital appreciation by investing in small cap stocks.  For their purposes, “small cap” is under $2 billion at the time of purchase.  The manager reserves the right to go to cash as a temporary move.

Adviser

Walthausen & Co., LLC.  Walthausen & Co., LLC. is an employee-owned  investment adviser located in Clifton Park, NY.  Mr. Walthausen founded the firm in 2007.  It specializes in small- and mid-cap value investing through separate and institutional accounts, and its one mutual fund. Being employee owned, Mr. Walthausen and team control the decision making process on important management issues such as limiting assets under management in order to maximize their client’s returns. In September 2007, he was joined by the entire investment team that had worked previously with him at Paradigm Capital Management, including an assistant portfolio manager, two analysts and head trader. Subsequently this group was joined by Mark Hodge, as Chief Compliance Officer, bringing the total number of partners to six.

Manager

John B. Walthausen. Mr. Walthausen is the president of the Advisor and has managed the fund since its inception. Mr. Walthausen joined Paradigm Capital Management on its founding in 1994 as a Portfolio Manager. Mr. Walthausen was the lead manager of the Paradigm Value Fund from January 2003 until July 2007 and oversaw approximately $1.3 billion in assets.  He’s got about 30 years of experience and is, as I noted above, supported by the team from his former employer.

Inception

February 1, 2008.

Management’s Stake in the Fund

Mr. Walthausen has over $1 million invested in the fund and also owns the fund’s adviser.

Minimum investment

$2,500 for all accounts.

Expense ratio

1.21% on an asset base of about $40 million, as of August 2023.  When I first profiled the fund in April 2010, expenses were 1.48% on just $25 million in assets, so it seems unlikely that the fund will ever become inexpensive.

Comments

Walthausen Value started as Mr. Walthausen’s attempt to reproduce the success of his Paradigm Value (PVFAX) fund by using the same investment objectives, strategies and policies with his new fund.  It’s not entirely clear what those strategies are.  Mr. Walthausen maintains a pretty low profile and the prospectus refers only to “a proprietary valuation model to identify companies that are trading at a discount to intrinsic value.”  If a stock passes that valuation screen, Walthausen and his team construct detailed earnings and cash flow projections.  Those projections are driven, in part, by evidence of “internal drivers” of growth, such as new managers or new products.  They’ll frequently talk with company managers, and then decide whether or not to buy.

His strategy appears to be fairly adaptable.  In explaining the fund’s strong relative performance in 2008, he notes that it “was achieved by populating the portfolio with companies which, by and large, had strong balance sheets, conservative, bottom-line oriented managements, and products that were in reasonable demand from their customers” (Annual Report, 1/09).  His letter, written while the market was still falling, concludes with his belief that excess negativity and a tumbling valuation meant “that outsized returns become a real possibility.”  Six months later, as he began harvesting those outsized returns, the portfolio had been moved to overweight cyclical sectors (e.g., information tech and consumer discretionary) and underweight defensive ones.

Mr. Waltausen’s public record dates to the founding of Paradigm Value.  His ability to replicate PVFAX’s record here would be an entirely excellent outcome, since his record there was outstanding.  The SEC believes the funds are close enough to allow Paradigm’s record into Walthausen’s prospectus.

  Last year at PVFAX 

7/31/06- 7/31/07

Last 3 years at PVFAX 

7/31/04 – 7/31/07

From inception to departure 

1/1/03 – 7/31/07

Paradigm Value 21.45 21.55 28.82
S&P 600 14.11 14.63 18.48
Russell 2000 Value 7.67 13.42 18.86

The fund has quickly earned itself a spot among the industry’s elite.  It returned over 40% in each of its first two full years of operation.  Its 2011 performance (through 08/25/2011) is -12.6%, about average for a small-value fund.

Since the fund has an elite pedigree, it makes sense to compare it to the industry’s elite.  I turned to Morningstar’s list of small core “analyst pick” funds.   Morningstar’s analyst picks are their “best ideas” funds, selected category-by-category, on the basis of a mix of quantitative and qualitative factors: thoughtful strategies, experienced management, low expenses, high stewardship grades and so on.  I tested Walthausen against those funds for two time periods.  The first is 2/1/08 – 7/30/2011 (that is, inception to the present).  A skeptic might argue that that comparison is biased in Walthausen’s favor, since it was likely still holding a lot of start-up cash as the market imploded.  For that reason, I also included the period 3/2/09 – 3/2/10 (that is, the year of the ferocious rally off the March market bottom).

$10,000 would have become . . . Since inception Year after the market bottom
Walthausen Small Cap Value $16,120 $24,000
Royce Special (RYSEX) 13,000 16,700
Paradigm Value (PVFAX) 12,200 18,300
Vanguard Tax-Managed Small Cap (VTMSX) 11,800 18,800
Bogle Small Cap Growth (BOGLX) 11,400 20,400
Third Avenue Small-Cap Value (TASCX) 10,000 17,100
Bridgeway Small-Cap Value  (BRSVX) 9400 18,400

When I last ran this comparison (April 2010), the funds ended up in exactly the same order as they do today (August 2011).

The majority of Walthausen’s investors come by way of Registered Investment Advisers, a fairly sophisticated group who don’t tend to be market timers.  As a result, the fund saw very little by way of outflows during the summer turbulence.  While closure is not imminent, investors do need to plan for that possibility.  Mr. Walthausen manages both his fund and separate accounts.  Between them, they have $530 million in assets.  He anticipates closing the strategy, both accounts and the fund, was that total reaches $750 million.  That’s well below the $1.3 billion he managed at Paradigm and could come in the foreseeable future.

Bottom line

There are, of course, reasons for caution.  Mr. Walthausen, born in 1945, is likely in the later stages of his investing career.  The fund’s expenses are above average, though its returns are higher still.  Mr. Walthausen has invested through a series of very different market conditions and has produced consistently top decile returns throughout.   This fund keeps rising to the top of my various screens and seems to be making a compelling case to rise on yours as well.

Company link

North Star Small Cap Value Fund, which is a pretty durn Spartan spot but there’s a fair amount of information if you click on the tiny text links across the top.

© Mutual Fund Observer, 2011.  All rights reserved.  The information here reflects publicly available information current at the time of publication.  For reprint/e-rights contact [email protected].