Category Archives: Most intriguing new funds

North Square Strategic Income (formerly Advisory Research Strategic Income), (ADVNX), September 2013

By David Snowball

At the time of publication, this fund was named Advisory Research Strategic Income.

Objective and Strategy

The fund seeks high current income and, as a secondary objective, long term capital appreciation.  It invests primarily in straight, convertible and hybrid preferred securities but has the freedom to invest in other income-producing assets including common stock.  The advisor wants to achieve “significantly higher yields” than available through Treasury securities while maintaining an investment-grade portfolio.  That said, the fund may invest “to a limited extent” in high-yield bonds, may invest up to 20% in foreign issues and may write covered call options against its holdings.  Morningstar categorizes it as a Long-Term Bond fund, which is sure to generate misleading peer group performance stats since it’s not a long-term bond fund.

Adviser

Advisory Research (ARI).  AR is a Chicago-based advisor for some of the nation’s wealthiest individuals, as well as privately-held companies, endowments, foundations, pensions and profit-sharing plans. They manage over $10.0 billion in total assets and advise the five AR funds.

Manager

Brien O’Brien, James Langer and Bruce Zessar.  Mr. O’Brien is ARI’s CEO.  He has 34 years of investment experience including stints with Marquette Capital, Bear Stearns and Oppenheimer.  He graduated with honors from Boston College with a B.S. in finance and theology.  He oversees four other AR funds.   Mr. Langer is a Managing Director and helps oversee two other AR funds.  Like Mr. O’Brien, he worked for Marquette Associates.  His career started at the well-respected Center for Research in Security Prices at the University of Chicago.  Mr. Zessar has a J.D. from Stanford Law and 11 years of investing experience.  Mr. Zessar also co-manages All-Cap Value (ADVGX). The team manages about $6 billion in other accounts.

Management’s Stake in the Fund

Mr. O’Brien provided a seed investment when the strategy was launched in 2003, and today has over $1 million in the fund.  Mr. Langer has around a half million in the fund and Mr. Zessar had between $10,000 and $50,000 in the fund.   

Strategy capacity and closure

They estimate a strategy capacity of about $1 billion; since they do invest heavily in preferred shares but have the ability to invest elsewhere, they view the cap as flexible.  Mr. Zessar notes that the few others open-end funds specializing in preferred shares have asset bases of $1 – 5 billion.

Opening date

December 31, 2012 after the conversion of one limited partnership account, Advisory Research Value Income Fund, L.P., which commenced operations on June 30, 2003 and the merger of another.

Minimum investment

$2500.

Expense ratio

0.90%, after waivers, on assets of $167.9 million, as of July 2023. 1.15%, after waivers, for “A” class shares. 

Comments

Preferred stocks are odd creatures, at least in the eyes of many investors.  To just say “they are securities with some characteristics of a bond and some of a stock” is correct, but woefully inadequate.  In general, preferred stock carries a ticker symbol and trades on an exchange, like common stock does.  In general, preferred stockholders have a greater claim on a firm’s dividend stream than do common stockholders: preferred dividends are paid before a company decides whether it can pay its common shareholders, tend to be higher and are often fixed, like the coupon on a bond. 

But preferred shares have little potential for capital appreciation; they’re generally issued at $25 and improving fortunes of the issuing firm don’t translate to a rising share price.  A preferred stock may or may not have maturity like a bond; some are “perpetual” and many have 30-40 year maturities.  It can either pay a dividend or interest, usually quarterly or semi-annually.  Its payments might be taxed at the dividend rate or at your marginal income rate, depending.  Some preferred shares start with a fixed coupon payment for, say, ten years and then exchange it for a floating payment fixed to some benchmark.  Some are callable, some are not.  Some are convertible, some are not.

As a result of this complexity, preferred shares tend to be underfollowed and lightly used in open-end funds.  Of the 7500 extant open-end mutual funds, only four specialize in preferred securities: ADVNX and three load-bearing funds.  A far larger number of closed-end funds invest in these securities, often with an overlay of leverage.

What’s the case for investing in preferred stocks

Steady income.  Strategic Income’s portfolio has a yield of 4.69%.  By comparison, Vanguard Intermediate-Term Treasury Fund (VFITX) has a 30-day yield of 1.38% and its broader Intermediate-Term Bond Index Fund (VBIIX) yields 2.64%.

The yield spread between the fed funds rate and the 10-year Treasury is abnormally large at the moment (about 280 bps in late August); when that spread reverts to its normal level (about 150 bps), there’s also the potential for a little capital appreciation in the Strategic Income fund.

In the long term, the managers believe that they will be able to offer a yield of about 200-250 basis points above what you could get from the benchmark 10-year Treasury.  At the same time, they believe that they can do so with less interest rate sensitivity; the fund has, in the past, shown the interest rate sensitivity associated with a bond portfolio that has a six or seven year maturity.

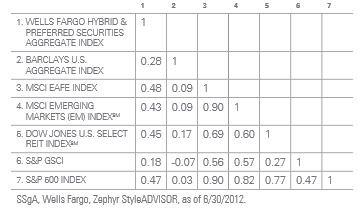
In addition, preferred stocks have traditionally had low correlations to other asset classes.   A 2012 report from State Street Global Advisors, The Case for Preferred Stocks, likes the correlation between preferred shares and bonds, international stocks, emerging markets stocks, real estate, commodities and domestic common stocks for the 10 years from 2003 to 2012:
ssga

As a result, adding preferred stock to a portfolio might both decrease its volatility and its interest rate sensitivity while boosting its income.

What’s the case for investing with Advisory Research

They have a lot of experience in actively managing this portfolio.

Advisory Research launched this fund’s predecessor in 2003.  They converted it to a mutual fund at the end of 2012 in response to investor demands for daily liquidity and corrosive skepticism of LPs in the wake of the Madoff scandal. The existing partners voted unanimously for conversion to a mutual fund.

From inception through its conversion to a mutual fund, the L.P. returned 4.24% annually while its benchmark returned 2.44%, an exceptionally wide gap for a fixed-income fund.  Because it’s weakly correlated to the overall stock market, it has held up relatively well in downturns, losing 25.8% in 2008 when the S&P 500 dropped 37%.  The fund’s 28.1% gain in 2009 exceeded the S&P’s 26.5% rebound.  It’s also worth noting that the same management team has been in place since 2003.

The team actively manages the portfolio for both sector allocation and duration.  They have considerable autonomy in allocating the portfolio, and look to shift resources in the direction of finding “safe spread.”  That is, for those investments whose higher yield is not swamped by higher risk.  In mid-2012, 60% of the portfolio was allocated to fixed preferred shares.  In mid-2013, they were half that.  The portfolio instead has 50% in short-term corporate bonds and fixed-to-floating rate securities.  At the same time, they moved aggressively to limit interest-rate risk by dramatically shortening the portfolio’s duration.

Bottom Line

This is not a riskless strategy.  Market panics can drive even fundamentally sound securities lower.  But panics are short-term events.  The challenge facing conservative investors, especially, is long-term: they need to ask the question, “where, in the next decade or so, am I going to find a reasonable stream of income?”  With the end of the 30-year bond bull market, the answer has to be “in strategies that you’ve not considered before, led by managers whose record is solid and whose interests are aligned with yours.” With long-term volatility akin to an intermediate-term corporate bond fund’s, substantial yield, and a stable, talented management team, Advisory Research Strategic Income offers the prospect of a valuable complement to a traditional bond-centered portfolio.

Fund website

North Square Strategic Income.  SSgA’s The Case for Preferred Stock (2012) is also worth reading, recalling that ADVNX’s portfolio is neither all-preferred nor locked into its current preferred allocation.

SSgA’s Preferred Securities 101

2023 Semi-Annual Report

Fact Sheet

© Mutual Fund Observer, 2013. All rights reserved. The information here reflects publicly available information current at the time of publication. For reprint/e-rights contact us.

Sextant Global High Income (SGHIX), August 2013

By David Snowball

Objective and Strategy

The fund seeks high income, with a secondary objective of capital preservation.  They invest in a global, diversified portfolio of income-producing debt and equity securities.  They manage risk at the level of individual security selection, but also through their ability to allocate between stocks and bonds, sectors, countries and currencies.  Their portfolio may invest in up to 50% in equities, 50% in the U.S., 50% in investment grade bonds, and 33% in emerging markets.  They won’t engage in hedging, leverage or credit default swaps. 

Adviser

Saturna Capital Corporation, which was founded in 1989.  Saturna has about $3.9 billion in assets under management and advises the Sextant, Idaho and Amana funds.  Their funds are universally and continually solid, sensible and risk-conscious.

Manager

Bryce Fegley and John Scott. Mr. Fegley joined Saturna 2001, served as an analyst and then as director of research at their Malaysian subsidiary, Saturna Sdn Bhd.  Mr. Scott joined Saturna 2009.  He has worked with Morgan Stanley Smith Barney in  California and Hyundai Securities in Seoul, S. Korea.

Strategy capacity and closure

They haven’t really discussed the matter formally.  Mr. Fegley’s general sense is that the fund’s stake in preferred shares (currently 8% of the portfolio) would represent the largest constraint because the preferred market is small ($200 billion) compared to the common stock market ($14 trillion) and might well shrink by half over the next few years as new banking regulations kick in.

Management’s Stake in the Fund

As of November 30, 2012, Mr. Fegley had invested between $100,000 and 500,000 in the fund while Mr. Scott had between $50,000 and 100,000.  As of the most recent SAI, their boss, Nick Kaiser, owned 30% of all of the fund’s shares which would be rather more than a million in the fund.

Opening date

March 30, 2012.

Minimum investment

$1,000 for regular accounts, $100 for IRAs.

Expense ratio

0.75% on assets of $9.4 million.

Comments

SGHIX, positioned as “a retirees’ fund,” responds to two undeniable realities: (1) investors need income and (2) the old stand-by – toss money into an aggregate bond index full of Treasuries – will, for a generation or more, no longer work.  Grantham, Mayo, van Otterloo (a/k/a GMO) forecast “The Purgatory of Low Returns” (July 2013) for investors over the next seven years with a tradition 60/40 hybrid earning a real return under 1% per year and most classes of U.S. bonds posting negative real returns.  Their recommendations for possible paths forward: concentrate on the highest return asset classes and rebalance frequently, seek alternatives, use leverage, and be patient.

With the exception of “use leverage,” Sextant does.  SGHIX explicitly targets “high current income” and has broad flexibility to seek income almost anywhere, though they do so with a prudent concern for risk.  John Scott describes himself as “the offensive manager,” the guy charged with finding the broadest possible array of reasonably-priced, income-producing securities.  Bryce Fegley is “the defensive manager,” a self-described “asset allocation nerd” who aims to balance the effects of many sources of risk – country, valuation, interest rate, currency – while still pursuing a high-income mandate.  Their strategy is to buy and hold for as long as possible: they hope to hold bonds to redemption and stocks as long as their dividends seem secure.  With hard work, luck and skill, their ability to move between dividend-paying common stock, preferred shares (currently 8% of the portfolio) and relatively high-quality high yield bonds might allow them to achieve their goal of high income.

How high?  The managers estimate that they might earn 300-400 bps more than a 10-year Treasury.  In a “normal” world, a 10-year might earn 4.5%; this fund might earn 7.5 – 8.5%.  In addition, the managers believe they might be able to add 2% per year in capital appreciation.

What concerns should prospective investors have?  Three come immediately to mind:

  1. To date, execution of the strategy has been imperfect. From inception through mid-July 2013, a period of about 15 months, the fund posted a total return of 5.2%.  Much of their portfolio was, for about six months, in cash which certainly depressed returns.  The managers are very aware of the fact that many investments are not paying investors for the risk they’re taking and have, as a result, positioned the portfolio conservatively.  In addition, it’s almost impossible to construct a true peer group for this fund since its combination of a high income mandate, equities and tactical asset allocation changes is unique.  There are four other funds with “global high income” in their names (Aberdeen, DWS, Fidelity, and MainStay plus one closed-end fund), but all are essentially high-yield bond funds with 0-3% in equities.

    That having been said, a 4% annual return – roughly equivalent to the fund’s yield – is pretty modest.  Investors interested in high income derived from a globally diversified portfolio might consider Sextant in the company with any of a number of funds or ETFs that advertise themselves as providing “multi-asset income.”  An incomplete roster of such options and their total return from the date of Sextant’s launch through 7/29/13 includes:


    10K at SGHIX inception became

    30-day SEC yield

    Stock/bond allocation

    Guggenheim Multi-Asset Income (CVY)

    11,800

    5.9

    91 / 6

    Arrow Dow Jones Global Yield ETF (GYLD)

    11,300

    5.8

    60 / 40

    BlackRock Multi-Asset Income (BAICX)

    11,200

    4.5

    23 / 53

    iShares Morningstar Multi-Asset Income (IYLD)

    10,700

    6.1

    35 / 58

    T. Rowe Price Spectrum Income (RPSIX)

    10,700

    2.9

    13 / 77

    SPDR SSgA Income Allocation (INKM)

    10,600

    4.2

    50 / 40

    Sextant

    10,500

    4.0

    45 / 34

    The portfolio composition stats illustrate the fact that none of these funds are pure peers.  They are, however, plausible competitors: that is, they represent alternatives that potential SGHIX investors might consider. The other consideration, though, is that many of these funds are substantially more volatile than Sextant is.  Below are the funds with launch dates near Sextant’s, along with their maximum draw down (that is, it measures the magnitude of a fund’s worst decline) and Ulcer Index (which factors-in both magnitude and duration of a decline).  In both cases, “smaller” is “better.”


    Maximum drawdown

    Date

    Ulcer Index

    iShares Morningstar Multi-Asset Income (IYLD)

    7.9

    06/13

    2.7

    SPDR SSgA Income Allocation (INKM)

    6.9

    06/13

    2.3

    Arrow Dow Jones Global Yield ETF (GYLD)

    6.8

    06/13

    2.3

    Sextant

    4.7

    06/13

    1.6

  2. The decision to provide a payout only once a year may not meet retirees’ needs for steady income.  For investors who choose to receive their income in a check, rather than reinvesting it in fund shares, Sextant’s policy of paying out dividends and interest only once each year may be sub-optimal.  The likeliest work-around would be to establish a systematic withdrawal plan, whereby an investor automatically redeems shares of the fund at regular intervals.
  3. The fund’s risk calculus is not clearly articulated.  This is a relative, rather than absolute, value portfolio.  The managers feel compelled to remain fully invested in something. They’re currently moving around, looking to find income-producing assets where the income is relatively high and steady and the risk of loss of principal is manageable.  That’s led them to a relatively low-yielding portfolio.  When we talked about what level of risk they targeted or were willing to accept, the answer was pretty close to “it depends on what’s available.”  While some funds have target volatility levels or drawdowns, the Sextant team seems mostly to be feeling their way along, taking the best deals they can find.  That strategy would be a bit more palatable if the managers had a longer record, here or elsewhere, of navigating markets with the strategy.

Bottom Line

Sextant Global High Income has a lot to recommend it.  The fund’s price (0.90%) is low, especially for such a tiny fund, as is its minimum investment.  Saturna has an excellent reputation for patient, profitable, risk-conscious investing.  The ability to travel globally and to tap into multiple asset classes is distinctive and exceedingly attractive. The question is whether the two young managers will pull it off.  They’re both bright and dedicated guys, we’re pulling for them and we’ll watch the fund closely to see how it matures.

Fund website

Sextant Global High Income

© Mutual Fund Observer, 2013. All rights reserved. The information here reflects publicly available information current at the time of publication. For reprint/e-rights contact us.

Grandeur Peak Global Reach (GPROX), August 2013

By David Snowball

Objective and Strategy

Global Reach pursues long-term capital growth primarily by investing globally in a small and micro-cap portfolio.  Up to 90% of the fund might normally be invested in microcaps (stocks with market cap under $1 billion at the time of purchase), but they’re also allowed to invest up to 35% in stocks over $5 billion.  The managers seek high quality companies that they place in one of three classifications:

Best-In-Class Growth Companies: fast earnings growth, good management, strong financials.  The strategy is to “find them small and undiscovered; buy and hold” until the market catches on.  In the interim, capture the compounded earnings growth.

Fallen Angels: good growth companies that hit “a bump in the road” and are priced as value stocks.  The strategy is to buy them low and hold through the recovery.

Stalwarts: basically, blue chip mid-cap stocks.  Decent but not great growth, great financials, and the prospect of dividends or stock buy-backs.  The strategy is to buy them at a fair price, but be careful of overpaying since their growth may be decelerating.

Grandeur Peak considers this “our flagship … strategy.”  It is their most broadly diversified and team-based strategy.  Global Reach will typically own 300-500 stocks, somewhere around 1-2% of their investible universe.

Adviser

Grandeur Peak Global Advisors is a small- and micro-cap focused global equities investment firm, founded in mid-2011, and comprised of a very experienced and collaborative investment team that worked together for years managing some of the Wasatch funds.  They advise three Grandeur Peak funds and one “pooled investment vehicle.”  The adviser passed $1 billion in assets under management in July, 2013.

Managers

Robert Gardiner and Blake Walker, assisted by three associate managers.   Robert Gardiner is co-founder, CEO and Director of Research for Grandeur Peak Global.  Prior to founding Grandeur Peak, he managed or co-managed Wasatch Microcap (WMICX), Small Cap Value (WMCVX) and Microcap Value (WAMVX, in which I own shares).  In 2007, he took a sort of sabbatical from active management, but continued as Director of Research.  During that sabbatical, he reached a couple conclusions: (1) global small/micro-cap investing was the world’s most interesting sector, and (2) he wanted to get back to managing a fund.  He returned to active management with the launch of Wasatch Global Opportunities (WAGOX), a global small/micro-cap fund.  From inception in late 2008 to July 2011 (the point of his departure), WAGOX turned a $10,000 investment into $23,500, while an investment in its average peer would have led to a $17,000 portfolio.  Put another way, WAGOX earned $13,500 or 92% more than its average peer managed.

Blake Walker is co-founder of and Chief Investment Officer for Grandeur Peak. Mr. Walker was a portfolio manager for two funds at Wasatch Advisors. Mr. Walker joined the research team at Wasatch Advisors in 2001 and launched his first fund, the Wasatch International Opportunities Fund (WAIOX) in 2005. He teamed up with Mr. Gardiner in 2008 to launch the Wasatch Global Opportunities (WAGOX).

The associate managers, all Wasatch alumni, are Amy Hu Sunderland, Randy Pearce, and Spencer Stewart.

Strategy capacity and closure

$400-500 million.  Grandeur Peak specializes in global small and micro-cap investing.  Their estimate, given current conditions, is that they could effectively manage about $3 billion in assets.  They could imagine running seven distinct small- to micro-cap funds and tend to close all of them (likely a soft close) when the firm’s assets under management reach about $2 billion.  The adviser has target closure levels for each current and planned fund.

Management’s stake in the fund

None yet disclosed, but the Grandeur Peak folks tend to invest heavily in their funds.

Opening date

June 19, 2013.

Minimum investment

$2,000, reduced to $1,000 for an account established with an automatic investment plan.

Expense ratio

1.25% on assets of $252.3 (as of July 2023). 

Comments

When Grandeur Peak opened shop in 2011, passion declared that this should be their first fund.  Prudence dictated otherwise.

Prudence prevailed.

I approached this prevail with some combination of curiosity bordering on skepticism.  The fact that Grandeur Peak closed two funds – presumably a signal that they had reached the limit of their ability to productively invest in this style – and then immediately launched a third, near-identical fund, raised questions about whether this was some variety of a marketing ploy.  Some reflection and a long conversation with Eric Huefner, Grandeur Peak’s president, convinced me otherwise. 

To understand my revised conclusion, and the conflict between passion and prudence, it’s important to understand the universe within which Grandeur Peak operates. 

Their investable universe is about 30,000 publicly-traded stocks, most particularly small and microcap, from around the globe, many with little external analyst coverage.  At the moment of launch, Grandeur Peak had six full-time investment professionals on staff.  Fully covering all 30,000 would have been a Herculean task.  Quite beyond that, Grandeur Peak faced the question: “How do we make our business model work?”  Unlike many fund companies, Grandeur Peak chose to focus solely on its mutual funds and not on separately-managed accounts or private partnerships.  Making that model work, especially with a fair amount of overhead, required that they be able to gather attention and assets.  The conclusion that the Grandeur Peak executives reached was that it was more prudent to launch two more-focused, potentially more newsworthy funds as their opening gambit.  Those two funds, Global Opportunities and International Opportunities, performed spectacularly in their two years of operations, having gathered a billion in assets and considerable press attention.

The success of Grandeur Peak’s first two funds allowed them to substantially increase their investment staff to fourteen, including seven senior investment professionals and seven junior ones.  With the greater staff available, they felt now that prudence called them to launch the fund that Mr. Gardiner hoped would be the firm’s flagship and crown jewel.

The structure of the Grandeur Peak funds is intriguing and distinctive.  The plan is for Global Reach to function as a sort of master portfolio, holding all of the stocks that the firm finds, at any given point, to be compelling.  They estimate that that will be somewhere between 300 and 500 names.  Those stocks will be selected based on the same criteria that drove portfolio construction at GPGOX and GPIOX and at the Wasatch funds before them.   Those selection criteria drive Grandeur Peak to seek out high quality small companies with a strong bias toward microcap stocks.  This has traditionally been a distinctive niche and a highly rewarding one.   Of all of the global stock funds in existence, Grandeur Peak has the smallest market cap by far and, in its two years of existence, it has posted some of its category’s strongest returns.

The plan is to offer Global Reach as the flagship portfolio and, for many investors, the most logical place for them to invest with Grandeur Peak.  It will offer the broadest and most diversified take on Gardiner and Walker’s investing skills.  It will be part of an eventual constellation of seven funds.  Global Reach will offer the most complete portfolio.  Each of the remaining funds will offer a way for investors to “tilt” their portfolios.  An investor who has a particular desire for exposure to frontier and emerging markets might choose to invest in Global Reach (which currently has 16% in emerging markets), but then to supplement it with a position in the eventual Emerging Markets Opportunities fund.  But for the vast majority of investors who have no particular justification for tilting their portfolio toward any set of attributes (domestic, value, emerging), the logical core holding is Global Reach. 

Are there reasons for concern?  Two come to mind.

Managing seven funds could, eventually, stretch the managers’ resources.  Cutting against this is the unique relationship of Global Reach to its sister portfolios.  The great bulk of the research effort will manifest itself in the Global Reach portfolio; the remaining funds will remain subsidiary to it.  That is, they will represent slices of the larger portfolio, not distinct burdens in addition to it.

The fund’s expense ratios are structurally, persistently high.  The fund will charge 1.60%, below the 1.88% at GPGOX, but substantially above the 1.20% charged by the average no-load global fund.  The management fee alone is 1.10%.  Cutting against that, of course, is the fact that Mr. Gardiner has for nearly three decades now, more than earned the fees assessed to his investors. It appears that you’re getting more than what you are paying for; while the fee is substantial, it seems to be well-earned.

Bottom Line

This is a very young, but very promising fund.  It is the fund that Grandeur Peak has wanted to launch from Day One, and it is understandably attracting considerable attention, drawing nearly $20 million in its first 30 days of operation.  For investors interested in a portfolio of high-quality, growth-oriented stocks from around the globe, there are few more-attractive opportunities available to them.

Website

Grandeur Peak Global Reach

© Mutual Fund Observer, 2013. All rights reserved. The information here reflects publicly available information current at the time of publication. For reprint/e-rights contact us.

Bretton Fund (BRTNX), Updated June 2013

By David Snowball

THIS IS AN UPDATE OF THE FUND PROFILE ORIGINALLY PUBLISHED IN February 2012. YOU CAN FIND THAT ORIGINAL PROFILE HERE.

Objective and Strategy

The Bretton Fund seeks to achieve long-term capital appreciation by investing in a small number of undervalued securities. The fund invests in common stocks of companies of all sizes. It normally holds a core position of between 15 to 20 securities whose underlying firms combine a defensible competitive advantage, relevant products, competent and shareholder-oriented management, growth, and a low level of debt.  The manager wants to invest “in ethical businesses” but does not use any formal ESG screens; mostly he avoids tobacco and gaming companies.

Adviser

Bretton Capital Management, LLC.  Bretton was founded in 2010 to advise this fund, which is its only client.

Manager

Stephen Dodson.  From 2002 to 2008, Mr. Dodson worked at Parnassus Investments in San Francisco, California, where he held various positions including president, chief operating officer, chief compliance officer and was a co-portfolio manager of a $25 million California tax-exempt bond fund. Prior to joining Parnassus Investments, Mr. Dodson was a venture capital associate with Advent International and an investment banking analyst at Morgan Stanley. Mr. Dodson attended the University of California, Berkeley, and earned a B.S. in Business Administration from the Haas School of Business.

Management’s Stake in the Fund

Mr. Dodson has over a million dollars invested in the fund and a large fraction of the fund’s total assets come from the manager’s family.

Opening date

September 30, 2010.

Minimum investment

$2000 for regular accounts, $1000 for IRAs or accounts established with an automatic investment plan.  The fund’s available for purchase through E*Trade and Pershing.

Expense ratio

1.35% on $67.7 million in assets.  

Comments

We first profiled Bretton Fund in February, 2012.  If you’re interested in our original analysis, it’s here.

Does it make sense to you that you could profit from following the real-life choices of the professionals in your life?  What hospital does your doctor use when her family needs one?  Where does the area’s best chef eat when he wants to go out for a weeknight dinner?  Which tablet computer gets our IT staff all shiny-eyed?

If that strategy makes sense to you, so will the Bretton Fund.

Bretton is managed by Stephen Dodson.  For a relatively young man, he’s had a fascinating array of experiences.  After graduating from Berkeley, he booked 80-100 hour weeks with Morgan Stanley, taking telecom firms public.  He worked in venture capital, with software and communications firms, before joining his father’s firm, Parnassus Investments.  At Parnassus he did everything from answering phones and doing equity research, to co-managing a fixed-income fund and presiding over the company.  He came to realize that “managing a family relationship and what I wanted in my career were incompatible at the time,” and so left to start his own firm.

In imagining that firm and its discipline, he was struck by a paradox: almost all investment professionals worshipped Warren Buffett, but almost none attempted to invest like him.  Stephen’s estimate is that there are “a ton” of concentrated long-term value hedge funds, but fewer than 20 mutual funds (most visibly The Cook and Bynum Fund COBYX) that follow Buffett’s discipline: he invests in “a small number of good business he believes that he understands and that are trading at a significant discount to what they believe they’re worth.”    He seemed particularly struck by his interviews of managers who run successful, conventional equity funds: 50-100 stocks and a portfolio sensitive to the sector-weightings in some index.

I asked each of them, “How would you invest if it was only your money and you never had to report to outside shareholders but you needed to sort of protect and grow this capital at an attractive rate for the rest of your life, how would you invest.  Would you invest in the same approach, 50-100 stocks across all sectors.”  And they said, “absolutely not.  I’d only invest in my 10-20 best ideas.” 

And that’s what Bretton does.  It holds 15-20 stocks in industries that the manager feels he understands really well. “Understands really well” translates to “do I think I understand who’ll be making money five years from now and what the sources of those earnings will be?” In some industries (biotech, media, oil), his answer was “no.” “Some really smart guys say oil will be $50/bbl in a couple years. Other equally smart analysts say $150. I have no hope of knowing which is right, so I don’t invest in oil.” He does invest in industries such as retail, financial services and transportation, where he’s fairly comfortable with his ability to make sense of their dynamics.

When I say “he does invest,” I mean “him, personally.”  Mr. Dodson reports that “I’ve invested all my investible net-worth, all my family members are invested in the fund.  My mother is invested in the fund.  My mother-in-law is invested in the fund (and that definitely sharpens the mind).”   Because of that, he can imagine Bretton Fund functioning almost as a family office.  He’s gathering assets at a steady pace – the fund has doubled in size since last spring and will be able to cover all of its ‘hard’ expenses once it hits $7 million in assets – but even if he didn’t get a single additional outside dollar he’d continue running Bretton as a mechanism for his family’s wealth management.   He’s looking to the prospect of some day having $20-40 million, and he suspects the strategy could accommodate $500 million or more.

He might well have launched a hedge fund, but decided he’d rather help average families do well than having the ultra-rich become ultra-richer.  Too, he might have considered a venture capital capital of the kind he’s worked with before, but venture capitalist bank on having one investment out of ten becoming a huge winner while nine of 10 simply fail.  “That’s not,” he reports, “what I want to do.”

What he wants to do is to combine a wide net (the manager reports spending most of his time reading), a small circle of competence (representing industries where he’s confident he understands the dynamic), a consistent discipline (target undervalued companies, defined by their ability to generate an attractive internal rate of return – currently he’s hoping for investments that have returns in the low double-digits) and patience (“five years to forever” are conceivable holding periods for his stocks).  He’s currently leveraging to fund’s small size, which allows him to benefit from a stake in companies too small for larger funds to even notice. 

This is a one-man operation.  Economies of scale are few and the opportunity for a lower expense ratio is distant.  It’s designed for careful compounding, which means that it will rarely be fully invested (imagine 10-20% cash as normal) and it will show weak relative returns in markets that are somewhat overvalued and still rising.  Many will find that frustrating.

Bottom Line

The fund is doing well – it has handily outperformed its peers since inception, outperformed them in 11 of 11 down months and 18 of 32 months overall.  It’s posted solid double-digit returns in 2012 and 2013, through May, with a considerable cash buffer.  It will celebrate its three-year anniversary this fall, which is the minimum threshold for most advisors to consider the fund. While he’s doing no marketing now, the manager imagines some marketing effort once he’s got a three year record to talk about.  Frankly, I think he has a lot to talk about already.

Fund website

Bretton Fund

Fund Documents

© Mutual Fund Observer, 2013. All rights reserved. The information here reflects publicly available information current at the time of publication. For reprint/e-rights contact us.

FPA International Value (FPIVX), May 2013 update

By David Snowball

This is an update of the fund profile originally published in August 2012. You can find that profile here.
FPA International Value Fund was reorganized as Phaeacian Accent International Value Fund after the close of the FPA Fund’s business on October 16, 2020.

As of May 26, 2022, the fund has been liquidated and terminated, according to the SEC. 

Objective and Strategy

FPA International Value tries to provide above average capital appreciation over the long term while minimizing the risk of capital losses.  Their strategy is to identify high-quality companies, invest in a quite limited number of them (say 25-30) and only when they’re selling at a substantial discount to FPA’s estimation of fair value, and then to hold on to them for the long-term.  In the absence of stocks selling at compelling discounts, FPA is willing to hold a lot of cash for an extended period.  They’re able to invest in both developed and developing markets, but recognize that the bulk of their exposure to the latter might be achieved indirectly through developed market firms with substantial emerging markets footprints.

Adviser

FPA, formerly First Pacific Advisors, which is located in Los Angeles.  The firm is entirely owned by its management which, in a singularly cool move, bought FPA from its parent company in 2006 and became independent for the first time in its 50 year history.  The firm has 27 investment professionals and 71 employees in total.  Currently, FPA manages about $23 billion across four equity strategies and one fixed income strategy.  Each strategy is manifested in a mutual fund and in separately managed accounts; for example, the Contrarian Value strategy is manifested in FPA Crescent (FPACX), in nine separate accounts and a half dozen hedge funds.  On April 1, 2013, all of FPA’s fund became no-loads.

Managers

Pierre O. Py.  Mr. Py joined FPA in September 2011. Prior to that, he was an International Research Analyst for Harris Associates, adviser to the Oakmark funds, from 2004 to 2010. In early 2013, FPA added two analysts to support Mr. Py.  One, Victor Liu, was a Vice President and Research Analyst at Causeway Capital Management from 2005 until 2013.  The other, Jason Dempsey, was a Research Analyst at Artisan Partners and Deccan Value Advisers.  He’s also a California native who’s a specialist in French rhetorical theory and has taught on the subject in France.  (Suddenly my own doctorate in rhetoric and public address feels trendy.)

Management’s Stake in the Fund

Mr. Py and FPA’s partners are some of the fund’s largest investors.  Mr. Py has committed “all of my investible net worth” to the fund.  That reflects FPA’s corporate commitment to “co-investment” in which “Partners invest alongside our clients and have a majority of their investable net worth committed to the firm’s products and investments. We encourage all other members of the firm to invest similarly.”

Opening date

December 1, 2011.

Minimum investment

$1,500, reduced to $100 for IRAs or accounts with automatic investing plans.

Expense ratio

1.32%, after waivers, on assets of $80 million.  The waiver is in effect through 2015, and might be extended.

Comments

Few fund companies get it consistently right.  By “right” I don’t mean “in step with current market passions” or “at the top of the charts every years.”  By “right” I mean two things: they have an excellent investment discipline and they treat their shareholders with profound respect.

FPA gets it consistently right.

That alone is enough to warrant a place for FPA International Value on any reasonable investor’s due diligence list.

Like the other FPA funds, FPA International Value is looking to buy world-class companies at substantial discounts.

They demand that their investments meet four, non-negotiable criteria:

  1. High quality businesses with long-term staying power.
  2. Overall financial strength and ability to weather market dislocations.
  3. Management teams that allocate capital in a value creative manner.
  4. Significant discount to the intrinsic value of the business.

The managers will follow a good company for years if necessary, waiting for an opportunity to purchase its stock at a price they’re willing to pay.  Mr. Py recounted the story of a long (and presumably frustrating) recent research trip to the Nordic countries.   After weeks in northern Europe in January, Mr. Py came home with the conclusion that there was essential nothing that met their quality and valuation criteria.  “The curse of absolute investors,” he called it.  As the market continues to rally, “it [becomes] increasingly difficult for us to find new compelling investment opportunities.”  And so he’s doing now what he knows he must: “We take the time to get to know the business, build our understanding . . . and wait patiently, sometimes multiple years” for all the stars to align.

The fund’s early performance (top 2% of its peer group in 2012 and returns since inception well better than their peer group’s, with muted volatility) is entirely encouraging.  The manager’s decision to avoid the hot Japanese market (“weak financial discipline … insufficient discounts”) and cash reserves means that its performance so far in 2013 (decent absolute returns but weak relative returns) is predictable and largely unavoidable, given their discipline.

Bottom Line

This is not a fund that’s suited to everybody.  Unless you share their passion for absolute value investing, hence their willingness to hold 30 or 40% of the portfolio in cash while a market roars ahead, you’re not well-matched with the FPA funds.  FPA lends a fine pedigree to this fund, their first new offering in almost 20 years (they acquired Crescent in the early 1990s) and their first new fund launch in almost 30.  While the FPIVX team has considerable autonomy, it’s clear that they also believe passionately in FPA’s absolute value orientation and are well-supported by their new colleagues.  While FPIVX certainly will not spend every year in the top tier and will likely spend some years in the bottom one, there are few funds with brighter long-term prospects.

Fund website

FPAInternationalValue

2013 Q3 Report and Commentary

Fact Sheet

© Mutual Fund Observer, 2013. All rights reserved. The information here reflects publicly available information current at the time of publication. For reprint/e-rights contact us.

The Cook & Bynum Fund (COBYX), April 2013

By David Snowball


This is an update of the fund profile originally published in August 2012. You can find that profile here.

Objective and Strategy

COBYX pursues the long-term growth of capital.  They do that by assembling an exceedingly concentrated global stock portfolio.  The stocks in the portfolio must meet four criteria. 

  • Circle of Competence: they only invest in businesses “whose economics and future prospects” they can understand.
  • Business: they only invest in “wide moat” firms, those with sustainable competitive advantages.   
  • People: they only invest when they believe the management team is highly competent (perhaps even crafty) and trustworthy. 
  • Price: they only buy shares priced at a substantial discount – preferably 50% – to their estimate of the share’s true value.

Within those confines, they can invest pretty much anywhere and in any amount.

Adviser

Cook & Bynum Capital Management, LLC, an independent, employee-owned money management firm established in 2001.  The firm is headquartered in Birmingham, Alabama.  It manages COBYX and two other “pooled investment vehicles.”  As of March 2013, the adviser had approximately $250 million in assets under management.

Manager

Richard Cook and Dowe Bynum.  Messrs Cook and Bynum are the principals and founding partners of Cook & Bynum and have managed the fund since its inception. They have a combined 23 years of investment management experience. Mr. Cook previously managed individual accounts for Cook & Bynum Capital Management, which also served as a subadviser to Gullane Capital Partners. Prior to that, he worked for Tudor Investment Corp. in Greenwich, CT. Mr. Bynum also managed individual accounts for Cook & Bynum. Previously, he’d worked as an equity analyst at Goldman Sachs & Co. in New York.   They work alone and also manage around $150 million in two other accounts.

Management’s Stake in the Fund

As of September 30, 2012, Mr. Cook had between $100,000 and $500,000 invested in the fund, and Mr. Bynum has between $500,000 and $1,000,000 invested.  They also invest in their private account which has the same fee structure and approach as the mutual fund. They describe this as “substantially all of our liquid net worth.”

Opening date

July 1, 2009.  The fund is modeled on a private fund which the team has run since August 2001.

Minimum investment

$5,000 for regular accounts and $1,000 for IRA accounts.

Expense ratio

1.49%, after waivers, on assets of $71 million, as of July 2023. There’s also a 2% redemption fee for shares held less than 60 days.

Comments

Messrs. Cook and Bynum are concentrated value investors in the tradition of Buffett and Munger. They’ve been investing since before they were teens and even tried to start a mutual fund with $200,000 in seed money while they were in college.  Within a few years after graduating college, they began managing money professionally, Cook with a hedge fund and Bynum at Goldman Sachs.  Now in their mid 30s, they’re managing a five star fund.

Their investment discipline seems straightforward: do what Warren would do. Focus on businesses and industries that you understand, invest only with world-class management teams, research intensely, wait for a good price, don’t over-diversify, and be willing to admit your mistakes.

Their discipline led to the construction of a very distinctive portfolio. They’ve invested in just seven stocks (as of 12/31/12) and hold about 34% in cash. There are simply no surprises in the list:


Business

% of portfolio

Date first purchased – the fund opened in 2009

Microsoft

Largest software company

16.6

12/2010

Wal-Mart Stores

Largest retailer

15.8

06/2010

Berkshire Hathaway Cl B

Buffet’s machine

11.4

09/2011

Arca Continental, S.A.B. de C.V.

Mexico Coca-Cola bottler/distributor

8.7

12/2010

Tesco PLC

U.K. grocer

5.7

06/2012

Procter & Gamble

Consumer products

4.8

12/2010

Coca-Cola

Soft drink manufacturer and distributor

4.4

12/2009

Since our first profile of the fund, one stock (Kraft) departed and no one was added.

American investors might be a bit unfamiliar with the fund’s two international holdings (Arca is a large Coca-Cola bottler serving Latin America and Tesco is the world’s third-largest retailer) but neither is “an undiscovered gem.”  

With so few stocks, there’s little diversification by sector (60% of the fund is “consumer defensive” stocks) or size (85% are mega-caps).  Both are residues of bottom-up stock picking (that is, the stocks which best met C&B’s criteria were consumer-oriented multinationals) and are of no concern to the managers who remain agnostic about such external benchmarks. The fund’s turnover ratio, which might range around 10-25%, is low but not stunningly low.

The managers have five real distinctions.

  1. The guys are willing to look stupid.   There are times, as now, when they can’t find stocks that meet their quality and valuation standards.  The rule for such situations is simply:  “When compelling opportunities do not exist, it is our obligation not to put capital at risk.”  They happily admit that other funds might well reap short-term gains by running with the pack, but you “have to be willing to look stupid.”  
  2. The guys are not willing to be stupid.   Richard and Dowe grew up together and are comfortable challenging each other.  Richard knows the limits of Dowe’s knowledge (and vice versa), “so we’re less likely to hold hands and go off the cliff together.”   In order to avoid that outcome, they spend a lot of time figuring out how not to be stupid.  They relegate some intriguing possibilities to the “too hard pile,” those businesses that might have a great story but whose business model or financials are simply too hard to forecast with sufficient confidence.  They think about common errors  (commitment bias, our ability to rationalize why we’re not going to stop doing something once we’ve started, chief among them) and have generated a set of really interesting tools to help contain them.  They maintain, for example, a list all of the reasons why they we don’t like their current holdings.  In advance of any purchase, they list all of the conditions under which they’d quickly sell (“if their star CEO leaves, we do too”) and keep that on top of their pile of papers concerning the stock.  
  3. They’re doing what they love.  Before starting Cook & Bynum (the company), both of the guys had high-visibility, highly-compensated positions in financial centers.  Richard worked for Tudor Investments in Stamford, CT, while Dowe was with Goldman, Sachs in New York.  The guys believe in a fundamental, value- and research-driven, stock-by-stock process.  What they were being paid to do (with Tudor’s macro event-driven hedge fund strategies for Richard) was about as far from what they most wanted as they could get. And so they quit, moved back to Alabama and set up their own shop to manage their own money and the investments of high net-worth individuals. They created Cook & Bynum (the fund) in response to an investor’s request for a product accessible to family and friends.    
  4. They do prodigious research without succumbing to the “gotta buy something” impulse.  While they spend the majority of their time in their offices, they’re also comfortable with spending two or three weeks at a time on the road. Their argument is that they’ve got to understand the entire ecosystem in which a firm operates – from the quality of its distribution network to the feelings of its customers – which they can only do first-hand. Nonetheless, they’ve been pretty good at resisting “deal momentum.”  They spent, for example, some three weeks traveling around Estonia, Poland and Hungary. Found nothing compelling.  Traveled Greece and Turkey and learned a lot, including how deeply dysfunctional the Greek economy is, but bought nothing.
  5. They’re willing to do what you won’t.   Most of us profess a buy low / buy the unloved / break from the herd / embrace our inner contrarian ethos. And most of us are deluded. Cook and Bynum seem rather less so: they’re holding cash now while others buy stocks after the market has doubled and profits margins hit records but in the depth of the 2008 meltdown they were buyers.  (They report having skipped Christmas presents in 2008 in order to have extra capital to invest.)  As the market bottomed in March 2009, the fund was down to 2% cash.

The fund’s risk-return profile has been outstanding.  At base, they have managed to produce almost all of the market’s upside with barely one-third of its downside.  They will surely lag when the stock market turns exuberant, as they have in the first quarter of 2013.  The fund returned 5.6% in the first quarter of 2013.  That’s a remarkably good performance (a) in absolute terms, (b) in relation to Morningstar’s index of highest-quality companies, the Wide Moat Focus 20, and (c) given a 34% cash stake.  It sucks relative to everything else. 

Here’s the key question: why would you care?  If the answer is, “I could have made more money elsewhere,” then I suppose you should go somewhere else.  The managers seem to be looking for two elusive commodities.  One is investments worth pursuing.  They are currently finding none.  The other is investing partners who share their passion for compelling investments and their willingness to let other investors charge off in a herd.  If you’re shaken by one quarter, or two or three, of weak relative performance, you shouldn’t be here. You should join the herd; they’re easy to find and reassuring in their mediocrity.

Bottom Line

It’s working.  Cook and Bynum might well be among the best.  They’re young.  The fund is small and nimble.  Their discipline makes great sense.  It’s not magic, but it has been very, very good and offers an intriguing alternative for investors concerned by lockstep correlations and watered-down portfolios.

Fund website

The Cook & Bynum Fund.  The C&B website was recently recognized as one of the two best small fund websites as part of the Observer’s “Best of the Web” feature.

2023 Semi-Annual Report

© Mutual Fund Observer, 2013. All rights reserved. The information here reflects publicly available information current at the time of publication. For reprint/e-rights contact us.

Artisan Global Equity Fund (ARTHX), February 2013

By David Snowball

 
This is an update of the fund profile originally published in December 2012. You can fined that original profile here

Objective and Strategy

The fund seeks to maximize long-term capital growth.  They invest in a global, all-cap equity portfolio which may include common and preferred stocks, convertible securities and, to a limited extent, derivatives.  They’re looking for high-quality growth companies with sustainable growth characteristics.  Their preference is to invest in firms that benefit from long-term growth trends and in stocks which are selling at a reasonable price.  Typically they hold 60-100 stocks. No more than 30% of the portfolio may be invested in emerging markets.  In general they do not hedge their currency exposure but could choose to do so if they owned a security denominated in an overvalued currency.

Adviser

Artisan Partners of Milwaukee, Wisconsin with Artisan Partners UK LLP as a subadvisor.   Artisan has five autonomous investment teams that oversee twelve distinct U.S., non-U.S. and global investment strategies. Artisan has been around since 1994.  As of 9/30/2012, Artisan Partners had approximately $70 billion in assets under management.  That’s up from $10 billion in 2000. They advise the 12 Artisan funds, but only 5% of their assets come from retail investors.

Manager

Mark L. Yockey, Charles-Henri Hamker and Andrew J. Euretig.  Mr. Yockey joined Artisan in 1995 and has been repeatedly recognized as one of the industry’s premier international stock investors.  He is a portfolio manager for Artisan International, Artisan International Small Cap and Artisan Global Equity Funds. He is, Artisan notes, fluent in French.  Charles-Henri Hamker is an associate portfolio manager on Artisan International Fund, and a portfolio manager with Artisan International Small Cap and Artisan Global Equity Funds. He is fluent in French and German.  (Take that, Yockey.)  Andrew J. Euretig joined Artisan in 2005. He is an associate portfolio manager for Artisan International Fund, and a portfolio manager for Artisan Global Equity Fund. (He never quite knows what Yockey and Hamker are whispering back and forth in French.)  The team was responsible, as of 9/30/12, for about $9 billion in investments other than this fund.

Management’s Stake in the Fund

Mr. Yockey has over $1 million invested, Mr. Eurtig has between $50,000 – 100,000 and Mr. Hamker has not (yet) invested in the fund.  As of December 31, 2012, the officers and directors of Artisan Funds as a group owned 17.20% of Investor Shares of the Global Equity Fund, up slightly from the year before. 

Opening date

March 29, 2010

Minimum investment

$1,000, which Artisan will waive if you establish an account with an automatic investment plan.

Expense ratio

1.28% on assets of $68.4 million for Investor class shares, as of June 2023.

Comments

The argument for considering ARTHX has changed, but it has not weakened.

In mid-January 2013, lead manager Barry Dargan elected to leave Artisan.  Mr. Dargan had a long, distinguished track record both here and at MFS where he managed, or co-managed, six funds, including two global funds. 

With his departure, leadership for the fund shifts to Mr. Yockey has famously managed two Artisan international funds since their inception, was recognized as Morningstar’s International Fund Manager of the Year (1998) and was a finalist for the award in 2012.  For most trailing time periods, his funds have top 10% returns.  International Small Cap received Morningstar’s highest accolade when it was designated as the only “Gold” fund in its peer group while International was recognized as a “Silver” fund. 

The change at the top offers no obvious cause for investor concern.  Three factors weigh in that judgment.  First, Artisan has been working consistently and successfully to move away from an “alpha manager” model toward a team-based discipline. Artisan is organized around a set of autonomous teams, each with a distinctive and definable discipline. Each team grows its own talent (that is, they’re independent of the other Artisan teams when it comes to staff and research) and grows into new funds when they have the capacity to do so. Second, the amount of experience and analytic ability on the management team remains formidable. Mr. Yockey is among the industry’s best and, like Artisan’s other lead managers, he’s clearly taken time to hire and mentor talented younger managers who move up the ladder from analyst to associate manager, co-manager and lead manager as they demonstrate they ability to meet the firm’s high standards. Artisan promises to provide additional resources, if they prove necessary, to broaden the team as their responsibilities grow.  Third, Artisan has handled management transitions before.  While the teams are stable, the firm has done a good job when confronted by the need to hand-off responsibilities.

The second argument on the fund’s behalf is that Artisan is a good steward.  Artisan has a very good record for lowering expenses, being risk conscious, opening funds only when they believe they have the capacity to be category-leaders (and almost all are) and closing funds before they’re bloated.

Third, ARTHX is nimble.  Its mandate is flexible: all sizes, all countries, any industry.  The fund’s direct investment in emerging markets is limited to 30% of the portfolio, but their pursuit of the world’s best companies leads them to firms whose income streams are more diverse than would be suggested by the names of the countries where they’re headquartered.  The managers note:

Though we have outsized exposure to Europe and undersized exposure to the U.S., we believe our relative country weights are of less significance since the companies we own in these developed economies continually expand their revenue bases across the globe.

Our portfolio remains centered around global industry leading companies with attractive valuations. This has led to a significant overweight position in the consumer sectors where many of our holdings benefit from significant exposure to the faster growth in emerging economies.

Since much of the world’s secular (enduring, long-term) growth is in the emerging markets, the portfolio is positioned to give them substantial exposure to it through their Europe and US-domiciled firms.  While the managers are experienced in handling billions, here they’re dealing with only $25 million.

The results are not surprising.  Morningstar believes that their analysts can identify those funds likely to serve their shareholders best; they do this by looking at a series of qualitative factors on top of pure performance.  When they find a fund that they believe has the potential to be consistently strong in the future, they can name it as a “Gold” fund.   Here are ARTHX’s returns since inception (the blue line) against all of Morningstar’s global Gold funds:

Not to say that the gap between Artisan and the other top funds is large and growing, but it is.

Bottom Line

Artisan Global Equity is an outstanding small fund for investors looking for exposure to many of the best firms from around the global.  The expenses are reasonable, the investment minimum is low and the managers are first-rate.  Which should be no surprise since two of the few funds keeping pace with Artisan Global Equity have names beginning with the same two words: Artisan Global Opportunities (ARTRX) and Artisan Global Value (ARTGX).

Fund website

Artisan Global Equity

Q3 Holdings (June 30, 2023)

© Mutual Fund Observer, 2013. All rights reserved. The information here reflects publicly available information current at the time of publication. For reprint/e-rights contact us.

PIMCO Short Asset Investment Fund, “A” shares (PAIAX), February 2013

By David Snowball

The “D” share class originally profiled here was converted to “A” shares in 2018. Retail investors now pay a 2.25% front load for the shares

Objective and Strategy

The fund seeks to provide “maximum current income, consistent with daily liquidity.”   The fund invests, primarily, in short-term investment grade debt.  The average duration varies according to PIMCO’s assessment of market conditions, but will not normally exceed 18 months.  The fund can invest in dollar-denominated debt from foreign issuers, with as much as 10% from the emerging markets, but it cannot invest in securities denominated in foreign currencies.  The manager also has the freedom to use derivatives and, at a limited extent, to use credit default swaps and short sales.

Adviser

PIMCO.  Famous for its fixed-income expertise and its $280 billion PIMCO Total Return Fund, PIMCO has emerged as one of the industry’s most innovative and successful firms across a wide array of asset classes and strategies.  They advise the 84 PIMCO funds as well as a global array of private and institutional clients.  As of December 31, 2012 they had $2 trillion in assets under management, $1.6 trillion in third party assets and 695 investment professionals. 

Manager

Jerome Schneider.  Mr. Schneider is an executive vice president in the Newport Beach office and head of the short-term and funding desk.  Mr. Schneider also manages four other cash management funds for PIMCO and a variety of other accounts, with combined assets exceeding $74 billion.  Prior to joining PIMCO in 2008, Mr. Schneider was a senior managing director with Bear Stearns.

Management’s Stake in the Fund

None.  Mr. Schneider manages five cash management funds and has not invested a penny in any of them (as of the latest SAI, 7/31/12). 

Opening date

May 31, 2012

Minimum investment

$1,000 for “D” shares, which is the class generally available no-load and NTF through various fund supermarkets.

Expense ratio

0.65%, after waivers, on assets of $3 Billion, as of July 2023.

Comments

You need to know about two guys in order to understand the case for PIMCO Short Asset.  The first is E.O. Wilson, the world’s leading authority in myrmecology, the study of ants.  His publications include the Pulitzer Prize winning The Ants (1990), which weighs in at nearly 800 pages as well as Journey to the Ants (1998), Leafcutter Ants (2010), Anthill: A Novel (2010) and 433 scientific papers. 

Wilson wondered, as I’m sure so many of us do, what characteristics distinguish very successful ant colonies from less successful or failed ones.  It’s this: the most successful colonies are organized so that they thoroughly gather all the small crumbs of food around them but they’re also capable of exploiting the occasional large windfall.  Failed colonies aren’t good about efficiently and consistently gathering their crumbs or can’t jump on the unexpected opportunities that present themselves.

The second is Bill Gross, who is on the short list for the title “best fixed-income investor, ever.”  He currently manages well more than $300 billion in PIMCO funds and another hundred billion or so in other accounts.  Morningstar named Mr. Gross and his investment team Fixed Income Manager of the Decade for 2000-2009 and Fixed Income Manager of the Year for 1998, 2000, and 2007 (the first three-time recipient).  Forbes ranks him as 51st on their list of the world’s most powerful people.

Why is that important?

Jerome Schneider is the guy that Bill Gross turns to managing the “cash” portion of his mutual funds.  Schneider is the guy responsible for directing all of PIMCO’s cash-management strategies and PIMCO Short Asset embodies the portfolio strategy used for all of those funds.  They refer to it as an “enhanced cash strategy” that combines high quality money market investments with a flexible array of other investment grade, short-term debt.  The goal is to produce lower volatility than short-term bonds and higher returns than cash.  Mr. Schneider is backed by an incredible array of analytic resources, from analysts tracking individual issues to high level strategists like Mr. Gross and Mohamed El-Erian, the firm’s co-CIOs.

From inception through 1/31/13, PAIUX turned a $10,000 investment into $10,150.  In the average money market, you’d have $10,005.  Over that same period, PAIUX outperformed both the broad bond market and the average market-neutral fund.

So here’s the question: if Bill Gross couldn’t find a better cash manager, what’s the prospect that you will?

Bottom Line

This fund will not make you rich but it may be integral to a strategy that does.  Your success, like the ants, may be driven by two different strategies: never leaving a crumb behind and being ready to hop on the occasional compelling opportunity.  PAIUX has a role to play in both.  It does give you a strong prospect of picking up every little crumb every day, leaving you with the more of the resources you’ll need to exploit the occasional compelling opportunity.

More venturesome investors might look at RiverPark Short Term High Yield Fund (RPHYX) for the cash management sleeve of their portfolios but conservative investors are unlikely to find any better option than this.

Fund website

PIMCO Short Asset Investment “A”

Fact Sheet

(2023)

© Mutual Fund Observer, 2013. All rights reserved. The information here reflects publicly available information current at the time of publication. For reprint/e-rights contact us.

T. Rowe Price Real Assets (PRAFX), October 2012

By David Snowball

Objective and Strategy

The fund tries to protect investors against the effects of inflation by investing in stocks which give you direct or indirect exposure to “real assets.” Real assets include “any assets that have physical properties.” Their understandably vague investment parameters include “energy and natural resources, real estate, basic materials, equipment, utilities and infrastructure, and commodities.” A stock is eligible for inclusion in the fund so long as at least 50% of company revenues or assets are linked to real assets. The portfolio is global and sprawling.

Adviser

T. Rowe Price. Price was founded in 1937 by Thomas Rowe Price, widely acknowledged as “the father of growth investing.” The firm now serves retail and institutional clients through more than 450 separate and commingled institutional accounts and more than 90 stock, bond, and money market funds. As of December 31, 2011, the Firm managed approximately $489 billion for more than 11 million individual and institutional investor accounts.

Manager

Wyatt Lee handles day-to-day management of the fund and chairs the fund’s Investment Advisory Committee. The IAC is comprised of other Price managers whose expertise and experience might be relevant to this portfolio. Mr. Lee joined Price in 1999. Before joining this fund he “assisted other T. Rowe Price portfolio managers in managing and executing the Firm’s asset allocation strategies.”

Management’s Stake in the Fund

As of December 31, 2011, Mr. Lee has under $10,000 invested in the fund but over $1 million invested in Price funds as a whole. None of the fund’s eight trustees had chosen to invest in it.

Inception

From July 28, 2010 to May 1, 2011, PRAFX was managed by Edmund M. Notzon and available only for use in other T. Rowe Price mutual funds, mostly the Retirement Date series. It became available to the public and Mr. Lee became the manager on May 1, 2011.

Minimum investment

$2,500 for regular accounts, $1000 for IRAs.

Expense ratio

0.93% on assets of $7 billion, as of July 2023.

Comments

PRAFX was created to respond to a compelling problem. The problem was the return of inflation and, in particular, the return of inflation driven by commodity prices. Three things are true about inflation:

  1. It’s tremendously corrosive.
  2. It might rise substantially.
  3. Neither stocks nor bonds cope well with rising inflation.

While inflation is pretty benign for now (in 2011 it was 3.2%), In the ten year period beginning in 1973 (and encompassing the two great oil price shocks), the annual rate of inflation was 8.75%. Over that decade, the S&P500 lost money in four years and returned 6.7% annually. In “real” terms, that is, factoring in the effects of inflation, your investment lost 18% of its buying power over the decade.

Price, which consistently does some of the industry’s best and most forward-thinking work on asset classes and asset allocation, began several decades ago to prepare its shareholders’ portfolios for the challenge of rising inflation. Their first venture in this direction was T. Rowe Price New Era (PRNEX), designed to cope with a new era of rising natural resource prices. The fund was launched in 1969, ahead of the inflation that dogged the 70s, and it performed excellently. Its 1973-1882 returns were about 50% higher than those produced by a globally diversified stock portfolio. As of September 2012, about 60% of its portfolio is linked to energy stocks and the remainder to other hard commodities.

In the course of designing and refining their asset allocation funds (the Spectrum, Personal Strategy and Retirement date funds), Price’s strategists concluded that they needed to build in inflation buffers. They tested a series of asset classes, alone and in combination. They concluded that some reputed inflation hedges worked poorly and a handful worked well, but differently from one another.

  • TIPs had low volatility, reacted somewhat slowly to rising inflation and had limited upside.
  • Commodities were much more volatile, reacted very quickly to inflation (indeed, likely drove the inflation) and performed well.
  • Equities were also volatile, reacted a bit more slowly to inflation than did commodities but performed better than commodities over longer time periods
  • Futures contracts and other derivatives sometimes worked well, but there was concern about their reliability. Small changes in the futures curve could trigger losses in the contracts. The returns on the collateral (usually government bonds) used with the contracts is very low and Price was concerned about the implications of the “financialization” of the derivatives market.

Since the purpose of the inflation funds was to provide a specific hedge inside Price’s asset allocation funds, they decided that they shouldn’t try an “one size fits all” approach that included both TIPs and equities. In consequence, they launched two separate funds for their managers’ use: Real Assets and Inflation-Focused Bond (no symbol). Both funds were originally available only for use in other Price funds, Inflation-Focused Bond (as distinct from the public Inflation-Protected Bond PRIPX) remains available only to Price managers.

How might you use PRAFX? A lot depends on your expectations for inflation. PRAFX is a global stock fund whose portfolio has two huge sector biases: 38% of the portfolio is invested in real estate and 35% in basic materials stocks. In the “normal” world stock fund, those numbers would be 2% and 5%, respectively. Another 16% is in energy stocks, twice the group norm. The relative performance of that portfolio varies according to your inflation assumption. The manager writes that “real assets stocks typically lag other equities during periods of low or falling inflation.” In periods of moderate inflation, “it’s a crap shoot.” He suggested that at 2-3% inflation, a firm’s underlying fundamentals would have a greater effect on its stock price than would inflation sensitivity. But if inflation tops 5%, if the rate is rising and, especially, if the rise was unexpected, the portfolio should perform markedly better than other equity portfolios.

Price’s own asset allocation decisions might give you some sense of how much exposure to PRAFX might be sensible.

  %age of the portfolio in PRAFX, 9/2012
Retirement 2055 (TRRNX)

3.5%

Price Personal Strategy Growth (TRSGX)

3.5

T. Rowe Price Spectrum Growth (PRSGX)

3.4

Retirement 2020 (TRRBX)

2.8

Retirement Income (TRRIX)

1.5

If you have a portfolio of $50,000, the minimum investment in PRAFX would be more (5%) than Price currently devotes in any of its funds.

Mr. Lee is a bright and articulate guy. He has a lot of experience in asset allocation products. Price trusts him enough to build his work into all of their asset allocation funds. And he’s supported by the same analyst pool that all of the Price’s managers draw from. That said, he doesn’t have a public record, he suspects that asset allocation changes (his strength) will drive returns less than will security selection, and his portfolio (315 stocks) is sprawling. All of those point toward “steady and solid” rather than “spectacular.” Which is to say, it’s a Price fund.

Bottom line

Mr. Lee believes that over longer periods, even without sustained bursts of inflation, the portfolio should have returns competitive with the world stock group as a whole. New Era’s performance seems to bear that out: it’s lagged over the past 5 – 10 years (which have been marked by low and falling inflation), it’s been a perfectly middling fund over the past 15 years but brilliant over the past 40. The fund’s expenses are reasonable and Price is always a responsible, cautious steward. For folks with larger portfolios or premonitions of spiking resource prices, a modest position here might be a sensible option.

Fund website

T. Rowe Price Real Assets

Disclosure

I own shares of PRAFX in my retirement portfolio. Along with Fidelity Strategic Real Return (FSRRX) inflation-sensitive funds comprise about 4% of my portfolio.

© Mutual Fund Observer, 2012. All rights reserved. The information here reflects publicly available information current at the time of publication. For reprint/e-rights contact us.

RiverPark Long/Short Opportunity Fund (RLSFX), August 2012

By David Snowball

Objective and Strategy

The fund pursues long-term capital appreciation while managing downside volatility by investing, long and short, primarily in U.S. stocks.  The managers describe the goal as pursuing “above average rates of return with less volatility and less downside risk as compared to U.S. equity markets.” They normally hold 40-60 long positions in stocks with “above-average growth prospects” and 40-75 short positions in stocks representing firms with challenged business models operating in declining industries.   They would typically be 50-60% net long, though their “target window” is 20-70%.  They invest in stocks of all capitalizations and can invest in non-U.S. stocks but the managers do not view that as a primary focus.

Adviser

RiverPark Advisors, LLC. Executives from Baron Asset Management, including president Morty Schaja, formed RiverPark in July 2009.  RiverPark oversees the six RiverPark funds, though other firms manage three of them.  RiverPark Capital Management runs separate accounts and partnerships.  Collectively, they have $567 million in assets under management, as of July 31, 2012.

Manager

Mitch Rubin, a Managing Partner at RiverPark and their CIO.  Mr. Rubin came to investing after graduating from Harvard Law and working in the mergers and acquisitions department of a law firm and then the research department of an investment bank.  The global perspective taken by the M&A people led to a fascination with investing and, eventually, the opportunity to manage several strategies at Baron Capital.  Rubin also manages the RiverPark Large Cap Growth Fund and co-manages Small Cap Growth.  He’s assisted by RiverPark’s CEO, Morty Schaja, and Conrad van Tienhoven, a long-time associate of his and co-manager on Small Cap Growth.

Management’s Stake in the Fund

The managers and other principals at RiverPark have invested about $4.2 million in the fund, as of July 2012.  Mr. Schaja describes it as “our favorite internal fund” and object of “the greatest net investment of our own money.”

Opening date

March 30, 2012.  The fund started life as a hedge fund on September 30, 2009 then converted to a mutual fund in March 2012.  The hedge fund’s “investment policies, objectives, guidelines and restrictions were in all material respects equivalent to the Fund’s.”

Minimum investment

$1,000.

Expense ratio

1.75% for institutional class shares and 2.00% for retail class shares, after waivers, on assets of $46.4 million, as of July 2023. 

Comments

All long-short funds have about the same goal: to provide a relatively large fraction of the stock market’s long-term gains with a relatively small fraction of its short-term volatility.  They all invest long in what they believe to be the most attractively valued stocks and invest short, that is bet against, the least attractively valued ones.  Many managers imagine their long portfolios as “offense” and their short portfolio as “defense.”

That’s the first place where RiverPark stands apart.  Mr. Rubin intends to “always play offense.”  He believes that RiverPark’s discipline will allow him to make money, “on average and over time,” on both his long and short portfolios.  Most long-short managers, observing that the stock market rises more often than it falls and that a rising market boosts even bad stocks, expect to lose money in the long-term on their short positions even while the shorts offer important protection in falling markets.

How so?  RiverPark started with the recognition that some industries are in terminal decline because of enduring, secular changes in society.  By identifying what the most important enduring changes were, the managers thought they might have a template for identifying industries likely to rise over the coming decades and those most likely to decline.  The word “decade” here is important: the managers are not trying to identify relatively short-term “macro” events (e.g., the failure of the next Eurozone bailout) that might boost or depress stocks over the next six to 18 months.  Their hope is to identify factors which are going to lift up or grind down entire industries, year after year, for as far as the eye could see.

And that establishes a second distinction for RiverPark: they’re long-term investors who have been in the industry, and have been together, long enough (17 years so far) to learn patience.  They’re quite willing to short a company like JCPenney even as other investors frantically bid up the share price over the arrival of a new management team, new marketing campaign or a new pricing scheme.  They have reason to believe that Penney “is a struggling, sunset business attempting to adapt to . . . changes” in a dying industry (big mall-based department stores).  The enthusiasm of other investors pushed Penney’s stock valuation to 40-times earnings, despite the fact that “our research with vendors, real estate professionals, and consumers has produced no evidence to indicate that any of the company’s plans were actually working.  In fact, we have seen the opposite.  The pricing strategy has proven to be confusing, the advertising to be ineffective, and the morale at the company to be poor.”

Finally, they know the trajectory of the firms they cover.  The team started in small cap investing, later added large caps and finally long-short strategies.  It means that there are firms which they researched intensively when they were in their small cap growth products, which grew into contributors in the large cap growth fund, were sold as they became mature firms with limited growth prospects, and are now shorted as they move into the sunset.   This has two consequences.  They have a tremendous amount of knowledge from which to draw; Mr. van Tienhoven notes that they have records of every trade they’ve made since 1997.  And they have no emotional attachment to their stocks; they are, they tell me, “analysts and not advocates.”  They will not overpay for stocks and they won’t hold stocks whose prospects are no longer compelling.  They been known to “work on a company for 15 years that we love but that we’ve never owned” because the valuations have never been compelling.  And they know that the stocks that once made them a great deal of money as longs may inevitably become candidates for shorting, which will allow them to again contribute to the fund’s shareholders.

All of which is fine in theory.  The question is: can they pull it off in practice?

Our best clue comes from Mr. Rubin’s long public track record.  RLSFX is his eighth fund that he’s either managed or co-managed.  Of those, seven – dating back to 1995 – have met and in many cases substantially exceeded its benchmark either during his tenure or, in the case of current funds, from inception through the end of the first quarter of 2012.  That includes five long-only products and two long-short funds. At the point of its conversion to a mutual fund, the RiverPark Opportunity Fund LLC was only half as volatile as the S&P 500 whether measured by maximum drawdown (that is, the greatest peak to trough fall), downmarket performance or worst quarter performance.  The fund returned 14.31% from inception, barely trailing the S&P’s 14.49%. The combination of the same returns with a fraction of the volatility gave the fund an outstanding Sharpe ratio: 4.2%.  He is, it’s clear, quite capable of consistently and patiently executing the strategy that he’s described.

There are a couple potential concerns which investors need to consider.

  1. The expense ratio, even after waivers, is a daunting 3.5%.  About 40% of the expenses are incurred by the fund’s short positions and so they’re beyond the manager’s immediate control.
  2. The fund’s performance after conversion to a mutual fund is more modest than its preceding performance.  The fund gained 21% in the first quarter of 2012 while still a hedge fund, smashing its peer group’s 4.8% return.  In the four months since conversion, it leads its peers by a more modest 0.8%.  Mr. Rubin is intensely competitive and intensely aware of his fund’s absolute and relative performance.  He says that nothing about the fund’s operation changed in the transition and notes that no fund outperforms every quarter in every kind of market, but “we’ve never underperformed for very long.”

Bottom Line

Mr. Rubin is an experienced professional, working on a fund that he thinks of as the culmination of the 17 years of active management, research and refinement.  Both of his long-short hedge funds offered annual returns within a few tenths of a percent of the stock market’s but did so with barely half of the volatility.   Even with the drag of substantial expenses, RLSFX has earned a place on any short-list of managed volatility equity funds.

Fund website

RiverPark Long-Short /Opportunity Fund

Fact Sheet

© Mutual Fund Observer, 2012. All rights reserved. The information here reflects publicly available information current at the time of publication. For reprint/e-rights contact us.

Amana Developing World Fund (AMDWX), May 2012

By David Snowball

Objective

The fund seeks long-term capital growth by investing exclusively in stocks of companies with significant exposure (50% or more of assets or revenues) to countries with developing economies and/or markets.  That investment can occur through ADRs and ADSs.  Investment decisions are made in accordance with Islamic principles. The fund diversifies its investments across the countries of the developing world, industries, and companies, and generally follows a value investment style.

Adviser

Saturna Capital, of Bellingham, Washington.  Saturna oversees six Sextant funds, the Idaho Tax-Free fund and four Amana funds.  They have about $4 billion in assets under management, the great bulk of which are in the Amana funds.  The Amana funds invest in accord with Islamic investing principles. The Income Fund commenced operations in June 1986 and the Growth Fund in February, 1994. Mr. Kaiser was recognized as the best Islamic fund manager for 2005.

Manager

Scott Klimo, Monem Salam, Levi Stewart Zurbrugg.

Mr. Klimo is vice president and chief investment officer of Saturna Capital and a deputy portfolio manager of Amana Income and Amana Developing World Funds. He joined Saturna Capital in 2012 as director of research. From 2001 to 2011, he served as a senior investment analyst, research director, and portfolio manager at Avera Global Partners/Security Global Investors. His academic background is in Asian Studies and he’s lived in a variety of Asian countries over the course of his professional career. Monem Salam is a portfolio manager, investment analyst, and director for Saturna Capital Corporation. He is also president and executive director of Saturna Sdn. Bhd, Saturna Capital’s wholly-owned Malaysian subsidiary. Mr. Zurbrugg is a senior investment analyst and portfolio manager for Saturna Capital Corporation. 

Mr. Klimo joined the fund’s management team in 2012 and worked with Amana founder Nick Kaiser for nearly five years. Mr. Salam joined in 2017 and Mr. Zurbrugg in 2020.

Inception

September 28, 2009.

Management’s Stake in the Fund

Mr. Klimo has a modest personal investment of $10,000 – 50,000 in the fund. Mr. Salam has invested between $100,000 – 500,000. Mr. Zurbrugg has a nominal investment of under $10,000.

Minimum investment

$250 for all accounts, with a $25 subsequent investment minimum.  That’s blessedly low.

Expense ratio

1.21% on AUM of $29.4M, as of June 2023.  That’s up about $4 million since March 2011. There’s also a 2% redemption fee on shares held fewer than 90 days.

Comments

Our 2011 profile of AMDWX recognized the fund’s relatively poor performance.  From launch to the end of 2011, a 10% cumulative gain against a 34% gain for its average peer over the same period.  I pointed out that money was pouring into emerging market stock funds at the rate of $2 billion a week and that many very talented managers (including the Artisan International Value team) were heading for the exits. The question, I suggested, was “will Amana’s underperformance be an ongoing issue?   No.”

Over the following 12 months (through April 2012), Amana validated that conclusion by finishing in the top 5% of all emerging markets stock funds.

Our conclusion in May 2011 was, “if you’re looking for a potential great entree into the developing markets, and especially if you’re a small investors looking for an affordable, conservative fund, you’ve found it!”

That confidence, which Mr. Kaiser earned over years of cautious, highly-successful investing, has been put to the test with this fund.  It has trailed the average emerging markets equities fund in eight of its 10 quarters of operation and finished at the bottom of the emerging markets rankings in 2010 and 2012 (through April 29).

What should you make of that pattern: bottom 1% (2010), top 5% (2011), bottom 3% (2012)?

Cash and crash.

For a long while, the majority of the fund’s portfolio has been in cash: over 50% at the end of March 2011 and 47% at the end of March 2012.  That has severely retarded returns during rising markets but substantially softened the blow of falling ones.  Here is AMDWX, compared with Vanguard Emerging Markets Stock Index Fund (VEIEX):

The index leads Amana by a bit, cumulatively, but that lead comes at a tremendous cost.  The volatility of the VEIEX chart helps explain why, over the past five years, its investors have managed to pocket only about one-third of the fund’s nominal gains.  The average investor arrives late, leaves early and leaves poor.

How should investors think about the fund as a future investment?  Manager Nick Kaiser made a couple important points in a late April 2012 interview.

  1. This fund is inherently more conservative than most. Part of that comes from its Islamic investing principles which keep it from investing in highly-indebted firms and financial companies, but which also prohibit speculation.  That latter mandate moves the fund toward a long-term ownership model with very low turnover (about 2% per year) and it keeps the fund away from younger companies whose prospects are mostly speculative.In addition to the sharia requirements, the management also defines “emerging markets companies” as those which derive half of their earnings or conduct half of their operations in emerging markets.  That allows it to invest in firms domiciled in the US.  Apple (AAPL), not a fund holding, first qualified as an emerging markets stock in April 2012.  The fund’s largest holding, as of March 2012, was VF Corporation (VFC) which owns the Lee, Wrangler, Timberland, North Face brands, among others.  Mead Johnson (MJN), which makes infant nutrition products such as Enfamil, was fourth.  Those companies operate with considerably greater regulatory and product safety scrutiny than might operate in many developing nations.  They’re also less volatile than the typical e.m. stock.
  2. The managers are beginning to deploy their cash.  At the end of April 2012, cash was down to 41% (from 47% a month earlier).  Mr. Kaiser notes that valuations, overall, are “a bit more attractive” and, he suspects, “the time to be invested is approaching.”

Bottom line

Mr. Kaiser is a patient investor, and would prefer shareholders who are likewise patient.  His generally-cautious equity selections have performed well (the average stock in the portfolio is up 12% as of late April 2012, matching the performance of the more-speculative stocks in the Vanguard index) and he’s now deploying cash into both U.S. and emerging markets-domiciled firms.  If markets turn choppy, this is likely to remain an island of comfortable sanity.  If, contrarily, emerging markets somehow soar in the face of slowing growth in China (often their largest market), this fund will continue to lag.  Much of the question in determining whether the fund makes sense for you is whether you’re willing to surrender the dramatic upside in order to have a better shot at capital preservation in the longer term.

Company link

Amana Developing World

2013 Q3 Report

© Mutual Fund Observer, 2012. All rights reserved. The information here reflects publicly available information current at the time of publication. For reprint/e-rights contact us.


FMI International (FMIJX), May 2012

By David Snowball

Objective and strategy

FMI International seeks long-term capital appreciation by investing, mainly, in a focused portfolio of large cap, non-US stocks. The Fund may invest in common and preferred stocks, convertibles, warrants, ADRs and ETFs. It targets firms with global, rather than national, footprints. They describe themselves as looking “for stocks of good businesses that are selling at value prices in an effort to achieve above average performance with below average risk.”

Adviser

Fiduciary Management, Inc., of Milwaukee, Wisconsin. FMI was founded in 1980 and is employee owned.  They manage over $14.5 billion in assets for domestic and international institutions, individual investors and RIAs through separately managed accounts and the five FMI funds.

Managers

A nine-person management team, directed by CEO Ted Kellner and Patrick English.  Mr. Kellner has been with the firm since 1980, Mr. English since 1986.  Kellner and English also co-manage FMI Common Stock (FMIMX), a solid, risk-conscious small- to mid-value fund which is closed to new investors and FMI Large Cap (FMIHX).  The team manages three other funds and nearly 900 separate accounts, valued at about $5.3 billion.

Inception

December 31, 2010.

Management’s Stake in the Fund

As of December 2011, all nine managers were invested in the fund, with substantial investments by the three senior members (in excess of $100,000) and fair-sized investments ($10,000 – $100,000) by most of the younger members.  In addition, five of the fund’s six directors had substantial investments ($50,000 and up) in the fund.  Collectively, the fund’s board and officers owned 55% of the fund’s shares.

Minimum investment

$2500 for all accounts.

Expense ratio

0.94% on assets of close to $4.1 Billion, as of July 2023. 

Comments

You would expect a lot from a new FMI fund. The other two FMI-managed funds are both outstanding.  FMI Common Stock (FMIMX), a small- to mid-cap core fund launched in 1981, has been outstanding: it has earned Morningstar’s highest designations (Five Stars and a Gold analyst rating), it’s earned Lipper’s highest designations for Total Returns and Preservation of Capital, and it has top tier returns for the past 5, 10 and 15 years.  FMI Large Cap (FMIHX), a large cap core fund launched in 2001, has been outstanding: it has earned Morningstar’s highest designations (Five Stars and a Gold analyst rating), it’s earned Lipper’s highest designations for Total Returns, Consistency and Preservation of Capital, and it has top tier returns for the past 5 and 10 years. Both are more concentrated (30-40 stocks), more conservative (both have “below average” to “low” risk scores from Morningstar), and more deliberate (turnover is less than half their peers’).

Consistent, cautious discipline is their mantra: “While past performance may not be indicative of the future, we can assure our shareholders that FMI’s investment process will remain the same as it has for over 30 years, with a steadfast focus on fundamental research and an emphasis on avoiding permanent impairment of capital.”

Since FMI International is run by the same team, using the same investment discipline, you’d have reason to expect a lot of it.  And, so far, your expectations would have been more than met.

Like its siblings, International has posted top-tier returns.  $10,000 invested at the fund’s lunch at the end of 2010 would now be worth $10,000 by the end of April 2012.  In that same period, its average peer would have lost $500.  Like its siblings, International has excelled in turbulent markets and been competitive in quickly rising ones.  At the end of March, FMI’s managers noted “Since inception, the performance of the Fund has been consistent with FMI’s long-term track record in domestic equities, generally outperforming in periods of distress, while lagging during sharp market rallies.”

It’s important to note that the FMI funds post strong absolute returns in the years in which the markets turn froth and they lag their peers.  Common Stock badly trailed its peers in four of the past 11 years (2003, 07, 10 and YTD 12) but posted an average 15.4% return in those years.  Large Cap lagged three times (2007, 10, and YTD 12) but posted 10.6% returns in those years.  For both funds, their performance in these “bad” years is better than their own overall long-term records.

A number of factors distinguish FMI from the average large cap international fund:

  1. It’s noticeably more concentrated.  The fund holds 26 stocks.80-120 would be far more typical.
  2. It has a large stake in North American stocks.  The US and Canada consume 30% of the portfolio (as of March 2012), with U.S. multinationals occupying as much space in the portfolio (19%) as SEC rules permit.  A 4% stake would be more common.
  3. It has a long holding period, about seven years, which is reflected in a 12% portfolio turnover.  60% turnover is about average.
  4. It avoids direct exposure to emerging markets.  There are no traditionally “emerging markets” stocks in the portfolio, though all of the companies in the portfolio derive earnings from the emerging markets.  It is unlikely that investors here will ever see the sort of emerging markets stake that’s typical of such funds. The managers explain that
    • the lack of good data, transparency and trust with respect to accounting, management, return on invested capital, governance, and several other factors makes it impossible for us to look at many international companies in a way that is comparable to how we operate domestically. China is an example of a country where we simply do not have enough trust and confidence in the companies or the government to invest our shareholders’ money.
    • In China there is little respect for intellectual property, and we are not surprised to see massive fraud allegations in the news with regard to Chinese equities. Investors have lost fortunes in companies such as Sino-Forest, MediaExpress, China Agritech, Rino International, and others. While there are sure to be high-quality, reliable mainland China or other emerging market businesses, for now we plan to focus on companies domiciled in developed countries, with accounting, management, and governance we can trust. As we look to invest in multinational companies that generally have a global footprint, we will get exposure to emerging markets without direct investment in the countries themselves. This will allow our shareholders to get the benefits of global diversification, but with a much greater margin of safety.
  5. The fund actively manages its currency exposure.  The managers are deeply skeptical that the euro-zone will survive and are fairly certain that the yen is “dramatically overvalued.”  As a result, they own only two stocks denominated in euros (Henkel and TNT Express) and have hedged both their euro and yen exposure.  As the managers at Tweedy, Browne have noted, the cost of those hedges reduces long-term returns by a little but short-term volatility by a lot.

On top of the manager’s stock selection skills and the fund’s distinctive portfolio, I’d commend them for a very shareholder friendly environment – from the very low expenses for such a small fund to their willingness to close Common Stock – and for really thoughtful writing.  Their shareholder letters are frequently, detailed, thoughtful and literate.  They’re a far cut above the marketing pap generated by many larger companies.  They also update the information on their website (holdings, commentaries, performance comparisons) quite frequently.

Bottom line

All the evidence available suggests that FMI International is a star in the making.  It’s headed by a cautious and consistent team that’s been together for a long while.  Expenses are low, the minimum is low, and FMI’s portfolio of high-quality multinational stocks is likely to produce a smoother, more profitable ride than the vast majority of its competitors.  Investors, and not just conservative ones, who are looking for a risk-conscious approach to international equities owe it to themselves to review this fund.

Company link

FMI International

March 31, 2023 Semi-Annual Report

RMS (a/k/a FundReveal) provides a discussion of the fund’s risk/return profile, based on their messages of daily volatility, at http://www.fundreveal.com/mutual-fund-blog/2012/05/fmjix-analysis-complementing-mutual-fund-observer-may-1-2012/

© Mutual Fund Observer, 2012. All rights reserved. The information here reflects publicly available information current at the time of publication. For reprint/e-rights contact us.

Wedgewood (formerly RiverPark/Wedgewood), (RWGFX), September 2011

By Editor

At the time of publication, this fund was named RiverPark/Wedgewood.

Objective

Wedgewood pursues long-term capital growth, but does so with an intelligent concern for short-term loss. The manager invests in 20-25 predominately large-cap market leaders.  In general, that means recognizable blue chip names (the top four, as of 08/11, are Google, Apple, Visa, and Berkshire Hathaway) with a market value of more than $5 billion.  They describe themselves as “contrarian growth investors.”  That translates to two principles: (1) target great businesses with sustainable, long-term advantages and (2) buy them when normal growth investors – often momentum-oriented managers – are panicking and running away.  They then tend to hold stocks for substantially longer than do most growth managers.  The combination of a wide economic moat and a purchase at a reasonable price gives the fund an unusual amount of downside protection, considering that it remains almost always fully-invested.

Adviser

RiverPark Advisors, LLC.   Executives from Baron Asset Management, including president Morty Schaja, formed RiverPark in July 2009.  RiverPark oversees the five RiverPark funds, though other firms manage three of the five.  Until recently, they also advised two actively-managed ETFs under the Grail RP banner.  A legally separate entity, RiverPark Capital Management, runs separate accounts and partnerships.  Collectively, they have $100 million in assets under management, as of August 2011.  Wedgewood Partners, Inc. manages $1.1 billion in separate accounts managed similarly to the fund and subadvises the fund and provides the management team and strategy.

Manager

David Rolfe.  Mr. Rolfe has managed the fund since its inception, and has managed separate accounts using the same strategy since 1993.  He joined Wedgewood that year and was charged with creating the firm’s focused growth strategy.  He holds a BA in Finance from the University of Missouri at St. Louis, a durn fine school.

Management’s Stake in the Fund

Mr. Rolfe and his associates clearly believe in eating their own cooking.   According to Matt Kelly of RiverPark, “not only has David had an SMA invested in this strategy for years, but he invested in the Fund on day 1”.   As of August 1, David and his immediate family’s stake in the Fund was approximately $400,000.  In addition, 50% of Wedgewood’s 401(k) money is invested in the fund.  Finally, Mr. Rolfe owns 45% of Wedgewood Partners.  “Of course, RiverPark executives are also big believers in the Fund, and currently have about $2 million in the Fund.”

Opening date

September 30, 2010

Minimum investment

$1,000 across the board.

Expense ratio

1.25% on assets, in the retail version of the fund, of $29 million (as of August 2023). The institutional shares are 1.00%. Both share classes have a waiver on the expense ratio. 

Comments

Americans are a fidgety bunch, and always have been.  Alexis de Tocqueville observed, in 1835 no less, that our relentless desire to move around and do new things ended only at our deaths.

A native of the United States clings to this world’s goods as if he were certain never to die; and he is so hasty in grasping at all within his reach that one would suppose he was constantly afraid of not living long enough to enjoy them. He clutches everything, he holds nothing fast, but soon loosens his grasp to pursue fresh gratifications.

Our national mantra seems to be “don’t just sit there, do something!”

That impulse affects individual and professional investors alike.  It manifests itself in the desire to buy into every neat story they hear, which leads to sprawling portfolios of stocks and funds each of which earns the title, “it seemed like a good idea at the time.”  And it leads investors to buy and sell incessantly.  We become stock collectors and traders, rather than business owners.

Large-cap funds, and especially large large-cap funds, suffer similarly.  On average, actively-manage large growth funds hold 70 stocks and turn over 100% per year.  The ten largest such funds hold 311 stocks on average and turn over 38% per year

The well-read folks at Wedgewood see it differently.  Manager David Rolfe endorses Charles Ellis’s classic essay, “The Losers Game” (Financial Analysts Journal, July 1975). Reasoning from war and sports to investing, Ellis argues that losers games are those where, as in amateur tennis,

The amateur duffer seldom beats his opponent, but he beats himself all the time. The victor in this game of tennis gets a higher score than the opponent, but he gets that higher score because his opponent is losing even more points.

Ellis argues that professional investors, in the main, play a losers game by becoming distracted, unfocused and undistinguished.  Mr. Rolfe and his associates are determined not to play that game.  They position themselves as “contrarian growth investors.”  In practical terms, that means:

They force themselves to own fewer stocks than they really want to.  After filtering a universe of 500-600 large growth companies, Wedgewood holds only “the top 20 of the 40 stocks we really want to own.”   Currently, 63% of the fund’s assets are in its top ten picks.

They buy when other growth managers are selling. Most growth managers are momentum investors, they buy when a stock’s price is rising.  If the company behind the stock meets the firm’s quantitative (“return on equity > 25%”) and qualitative (“a dominant product or service that is practically irreplaceable or lacks substitutes”) screens, Wedgewood would rather buy during panic than during euphoria.

They hold far longer once they buy.  The historical average for Wedgewood’s separate accounts which use this exact discipline is 15-20% turnover where, as I note, their peers sit around 100%.

And then they spend a lot of time watching those stocks.  “Thinking and acting like business owners reduces our interest to those few businesses which are superior,” Rolfe writes, and he maintains a thoughtful vigil over those businesses. For folks interested in looking over their managers’ shoulders, Wedgewood has posted a series of thoughtful analyses of Apple.  Mr. Rolfe had a new analysis out to his investors within a few hours of the announcement of Steve Jobs’ resignation:

Mr. Jobs is irreplaceable.  That said. . . [i]n the history of Apple, the company has never before had the depth, breadth, scale and scope of management, technological innovation and design, financial resources and market share strength as it possesses today.  Apple’s stock will take its inevitable lumps over the near-term.  If the Street’s reaction is too extreme we will buy more.  (With our expectation of earnings power of +$40 per share in F2012, plus $100 billion in balance sheet liquidity by year-end 2011, the stock is an extreme bargain – even before today’s news.)

Beyond individual stock selection, Mr. Rolfe understood that you can’t beat an index with a portfolio that mirrors an index and so, “we believe that our portfolios must be constructed as different from an index as possible.”   And they are strikingly different.  Of 11 industry sectors that Morningstar benchmarks, Wedgewood has zero exposure to six.  In four sectors, they are “overweight” or “underweight” by margins of 2:1 up to 7:1.  Technology is the only near normal weighting in the current portfolio.  The fund’s market cap is 40% larger than its benchmark and its average stock is far faster growing.

None of which would matter if the results weren’t great.  Fortunately, they are.

Returns are high. From inception (9/92) to the end of the most recent quarter (6/11), Wedgewood’s large growth accounts returned 11.5% annually while the Russell 1000 Growth index returned 7.4%.  Wedgewood substantially leads the index in every trailing period (3, 5, 7, 10 and 15 years).  It also has the highest alpha (a measure of risk-adjusted performance) over the past 15 years of any of the large-cap growth managers in its peer group.

Risk is moderate and well-rewarded. Over the past 15 years, Wedgewood has captured about 85% of the large-cap universe’s downside and 140% of its upside.  That is, they make 40% more in a rising market and lose 15% less in a falling market than their peers do.   The comparison with large cap mutual funds is striking.  Large growth funds as a whole capture 110% of the downside and 106% of the upside.  That is, Wedgewood falls far less in falling markets and rises much more in rising ones, than did the average large-growth fund over the past 15 years.

Statisticians attempt to standardize those returns by calculating various ratios.  The famous Sharpe ratio (for which William Sharpe won a Nobel Prize) tries to determine whether a portfolio’s returns are due to smart investment decisions or a result of excess risk.  Wedgewood has the 10th highest Sharpe ratio among the 112 managers in its peer group.  The “information ratio” attempts to measure the consistency with which a manager’s returns exceeds the risks s/he takes.  The higher the IR, the more consistent a manager is and Wedgewood has the highest information ratio of any of the 112 managers in its universe.

The portfolio is well-positioned.  According to a Morningstar analysis provided by the manager, the companies in Wedgewood Growth’s portfolio are growing earnings 50% faster than those in the S&P500, while selling at an 11% discount to it.  That disconnect serves as part of the “margin of safety” that Mr. Rolfe attempts to build into the fund.

Is there reason for caution?  Sure.  Two come to mind.  The first concern is that these results were generated by the firm’s focused large-growth separate accounts, not by a mutual fund.  The dynamics of those accounts are different (different fee structure and you might have only a dozen investors to reason with, as opposed to thousands of shareholders) and some managers have been challenged to translate their success from one realm to the other.  I brought the question to Mr. Rolfe, who makes two points.  First, the investment disciplines are identical, which is what persuaded the SEC to allow Wedgewood to include the separate account track record in the fund’s prospectus.  For the purpose of that track record, the fund is now figured-in as one of the firm’s separate accounts.  Second, internal data shows good tracking consistency between the fund and the separate account composite.  That is, the fund is acting pretty much the way the separate accounts act.

The other concern is Mr. Rolfe’s individual importance to the fund.  He’s the sole manager in a relatively small operation.  While he’s a young man (not yet 50) and passionate about his work, a lot of the fund’s success will ride on his shoulders.  That said, Mr. Rolfe is significantly supported by a small but cohesive and experienced investment management team.  The three other investment professionals are Tony Guerrerio (since 1992), Dana Webb (since 2002) and Michael Quigley (since 2005).

Bottom Line

RiverPark Wedgewood is off to an excellent start.  It has one of the best records so far in 2011 (top 6%, as of 8/25/11) as well as one of the best records during the summer market turmoil (top 3% in the preceding three months).  Mr. Rolfe writes, “We are different. We are unique in that we think and act unlike the vast majority of active managers. Our results speak to our process.”  Because those results, earned through 18 years of separate account management, are not well known, advisors may be slow to notice the fund’s strength.  RWGFX is a worthy addition to the RiverPark family and to any stock-fund investors’ due-diligence list.

Fund website

Wedgewood Fund

Ellis’s “Losers Game” offers good advice for folks determined to try to beat a passive scheme, much of which is embodied here.  I don’t know how long the article will remain posted there, but it’s well-worth reading.

© Mutual Fund Observer, 2011.  All rights reserved.  The information here reflects publicly available information current at the time of publication.  For reprint/e-rights contact [email protected].

Manning and Napier Disciplined Value (formerly Dividend Focus), (MNDFX), November 2011

By Editor

Objective

The fund seeks returns which are competitive with the broad market, while at the same time providing some capital protection during “sustained” bear markets. Stocks are selected from a broad universe of mid- to large-cap stocks — including international and emerging markets — based on high free cash flow, high dividend yields, and low likelihood of, well, bankruptcy. This is a quant fund which rebalances only once each year, although the managers reserve the right to add or drop individual holdings at any time.  Their target audience is investors “[s]eeking a fundamentals-based alternative to indexing.”

Adviser

Manning & Napier Advisors, LLC.  Manning & Napier was founded in 1970, and they manage about $43 billion in assets for a wide spectrum of clients from endowments and state pension plans to individual investors. About $17 billion of that amount is in their mutual funds. The firm is entirely employee-owned and their 22 funds are entirely team-managed. The firm’s investment team currently consists of more than 50 analysts and economists. The senior analysts have an average tenure of nearly 22 years.  The firm reorganized on October 1, 2011.  That reorganization reflected succession planning, as the firm’s owner – William Manning – entered his mid-70s.  Under the reorganization, the other employees own more of the fund and outside investors own a bit of it.

Manager

Managed by a team of ten. They actually mean “the team does it.” Manning & Napier is so committed to the concept that they don’t even have a CEO; that’s handled by another team, the Executive Group. In any case, the Gang of Many is the same crew that manages all their other funds.

Management’s Stake in the Fund

Only one team member has an investment in this fund, as of 3/31/11.  All of the managers have over $100,000 invested in Manning & Napier funds, and three of the eight have over $500,000.

Opening date

November 7, 2008

Minimum investment

$2,000, which is waived for accounts established with an automatic investment plan (AIP).

Expense ratio

0.52% on assets of $363.5 million, as of July 2023. 

Comments

Dividend Focus invests in a diversified portfolio of large- and mega-cap stocks.  The managers select stocks based on three criteria:

  • “High free cash flow (i.e., cash generated by a company that is available to equity holders). Minimum free cash flow yield must exceed the yield of high quality corporate bonds.
  • Dividend yield equal to or exceeding the dividend yield of the broad equity market.
  • Not having a high probability of experiencing financial distress. This estimate is based on a credit scoring model that incorporates measures of corporate health such as liquidity, profitability, leverage, and solvency to assess the likelihood of a bankruptcy in the next one to two years.”

The portfolio currently (9/31/11) holds 130 stocks, about a quarter international including a 3% emerging markets stake.

Why consider it?  There are three really good reasons.

First, it’s managed by the best team you’ve never heard of.

Manning & Napier launched at the outset of “the lost decade” of the 1970s when the stock market failed to beat either inflation or the returns on cash. The “strategies and disciplines” they designed to survive that tough market allowed them to flourish in the lost decade of the 2000s: every M&N fund with a ten-year record has significant, sustained positive returns across the decade. Results like that led Morningstar, not a group enamored with small fund firms, to name Manning & Napier as a finalist for the title, Fund Manager of the Decade. In announcing the designation, Karen Dolan of Morningstar wrote:

The Manning & Napier team is the real hidden gem on this list. The team brings a unique and attractive focus on absolute returns to research companies of all sizes around the globe. The results speak for themselves, not only in World Opportunities, but across Manning & Napier’s entire lineup. (The Fund Manager of the Decade Finalists, 11/19/09)

More recently, Morningstar profiled the tiny handful of funds that have beaten their category averages every single year for the past decade (“Here Come the Category Killers,” 10/23/11). One of only three domestic stock funds to make the list was Manning & Napier Pro-Blend Maximum (EXHAX), which they praised for its “team of extremely long-tenured portfolio managers oversee the fund, employing a strategy that overlays bottom-up security selection with macroeconomic research.” MNDFX is run by the same team.

Second, it’s the cheapest possible way of accessing that team’s skill.

Manning & Napier charges 0.60% for the fund, about half of what their other (larger, more famous) funds charge.  It’s even lower than what they typically charge for institutional shares.  It’s competitive with the 0.40 – 0.50% charged by most of the dividend-focused ETFs.

Third, the fund is doing well and achieving its goals.

Manning was attempting to generate a compelling alternative to index investing.  So far, they’ve done so.  The fund returned 9% through the first ten months of 2011, placing it in the top 2% of comparable funds.  The fund has outperformed the most popular dividend-focused index funds and exchange-traded funds since its launch.


Since inception

Q3, 2011

Vanguard Total Stock Market (VTSMX)

15,200

-15.3%

M&N Dividend Focus (MNDFX)

14,700

-8.9

Vanguard Dividend Appreciation Index (VDAIX)

14,600

-12.5

SPDR S&P Dividend ETF (SDY)

14,500

-9.4

First Trust Morningstar Div Leaders Index (FDL)

14,200

-3.7

iShares Dow Jones Select Dividend Index (DVY)

13,400

-8.1

PowerShares HighYield Dividend Achievers (PEY)

12,000

-5.9

The fund’s focus on blue-chip companies have held it back during frothy markets when smaller and less stable firms flourish, but it also holds up better in rough periods such as the third quarter of 2011.

The fund has also earned a mention in the company of some of the most distinguished actively-managed, five-star high dividend/high quality funds.


Since inception

Q3, 2011

M&N Dividend Focus (MNDFX)

14,700

-8.9

Tweedy, Browne Worldwide High Dividend Yield Value (TBHDX)

14,600

-10.1

GMO Quality III (GQETX)

14,100

-5.4

In the long run, the evidence is unequivocal: a focus on high-quality, dividend-paying stocks are the closest thing the market offers to a free lunch. That is, you earn slightly higher-than-market returns with slightly lower-than-market risk. Dividends help in three ways:

  • They’ve always been an important contributor to a fund’s total returns (Eaton Vance and Standard & Poor’s separately calculated dividend’s long-term contribution at 33-50% of total returns);
  • The dividends provide an ongoing source of cash for reinvestment, especially during downturns when investors might otherwise be reluctant to add to their positions; and,
  • Dividends are often a useful signal of the underlying health of the company, and that helps investors decrease the prospect of having a position blow up.

Some cynics also observe that dividends, by taking money out of the hands of corporate executives and placing in investors’ hands, decreases the executives’ ability to engage in destructive empire-building acquisitions.

Bottom Line

After a virtually unprecedented period of junk outperforming quality, many commentators – from Jeremy Grantham to the Motley Fools – predict that high quality stocks will resume their historic role as the most attractive investments in the U.S. market, and quite possibly in the world. MNDFX offers investors their lowest-cost access to what is unquestionably one of the fund industry’s most disciplined and consistently successful management teams. Especially for taxable accounts, investors should seriously consider both Manning & Napier Tax-Managed (EXTAX) and Dividend Focus for core domestic exposure.

Fund website

Disciplined Value Fund

Fact Sheet


© Mutual Fund Observer, 2011.  All rights reserved.  The information here reflects publicly available information current at the time of publication.  For reprint/e-rights contact [email protected].

Vulcan Value Partners Small Cap Fund (VVPSX), April 2011

By Editor

Objective

Seeks to achieve long-term capital appreciation by investing primarily in publicly traded small-capitalization U.S. companies – the Russell 2000 universe – believed to be both undervalued and possessing a sustainable competitive advantage. They look for businesses that are run by ethical, capable, stockholder-oriented management teams that also are good at allocating their capital. The manager determines the firm’s value, compares it to the current share price, and then invests greater amounts in the more deeply-discounted stocks.

Adviser

Vulcan Value Partner. C.T. Fitzpatrick founded Vulcan Value Partners in 2007 to manage his personal wealth. Vulcan manages two mutual funds and oversees four strategies (Large Cap, Small Cap, Focus and Focus Plus) for its separate accounts. Since inception, all four strategies have peer rankings in the top 5% of value managers in their respective categories.

Manager

C.T. Fitzpatrick, Founder, Chief Executive Officer, Chief Investment Officer, and Chief Shareholder. Before founding Vulcan, Mr. Fitzpatrick worked as a principal and portfolio manager at Southeastern Asset Management, adviser to the Longleaf funds. He co-managed the relatively short-lived Longleaf Partners Realty fund. During his 17 year tenure (1990-2007), the team at Southeastern Asset Management achieved double digit returns and was ranked in top 5% of money managers over five, ten, and twenty year periods according to Callan and Associates.

Management’s Stake in the Fund

Mr. Fitzpatrick has over $1 million in each of Vulcan’s two funds. He also owns a majority of the Adviser. All of Vulcan Value’s employees make all of their investments either through the firm’s funds or its separate accounts.

Opening date

12/30/2009

Minimum investment

$5000, reduced to $500 for college savings accounts.

Expense ratio

1.25% on assets of $423 million, as of July 2023. There is no redemption fee. 

Comments

Mr. Fitzpatrick is a disciplined, and bullish, value investor. He spent 17 years at Southeastern Asset Management, which has a great tradition of skilled, shareholder-friendly management. He left, he says, because life simply got too hectic as SAM grew to managing $40 billion and he found himself traveling weekly to Europe. (The TSA pat downs alone would cause me to reconsider the job.) While he was not one of the Longleaf Small Cap co-managers, he knows the discipline and has imported chunks of it. Like Longleaf, Vulcan runs a very compact portfolio of 20-30 stocks while many of the small-to-midcap peers holds 50-150 names. Both firms profess a long-term perspective, and believe that a five-year perspective gives them a competitive advantage when dealing with competitors who have trouble imagining “committing” to a stock for five months. Mr. Fitzpatrick’s description is that “We buy 900-pound gorillas priced like 98-pound weaklings. We have a five-year time horizon. Usually, our investments are out of favor for short-term reasons but their long-term fundamentals are sound.” They continue to hold stocks which have grown beyond the small cap realm, so long as those stocks continue to have a favorable value profile. As a result, both firms hold more midcap than small cap stocks in their small cap funds. Neither firm is a “deep value” purist, so the portfolios contain a number of “growth” stocks. And both firms require that everyone’s interests are aligned with their shareholders; the only investment that employees of either firm are allowed to make are in the firms’ own products. That discipline seems to work. It works for Longleaf, which has 20 years of top decile returns. It’s worked for Vulcan’s separate accounts, whose small cap composite outperformed their benchmark by index by 900 basis points a year; gaining 4% which the Russell Value index dropped 5%. And it’s worked so far for the Vulcan fund, which gained nearly 23% over the first 11 months of 2010. That easily outpaces both its small- and mid-cap peer groups, placing it in the top 10% of the former.

Bottom Line

Mr. Fitzpatrick is bullish on stocks, largely because so few other people are. Money is flowing out of equities, at the same time that corporate balance sheets are becoming exceptionally strong and bonds exceptionally unattractive. In particular, he finds the highest quality companies to be the most undervalued. That creates fertile ground for a disciplined value investor. For folks venturesome enough to pursue high quality small companies, Vulcan offers the prospects of a solid, sensible, profitable vehicle.

Fund website

Vulcan Value Partners Small Cap. You might browse through the exceptionally detailed discussion of their small cap separate accounts, of which the mutual fund is a clone. There’s a fair amount of interesting commentary attached to them.

Fact Sheet

© Mutual Fund Observer, 2011.  All rights reserved.  The information here reflects publicly available information current at the time of publication.  For reprint/e-rights contact [email protected].

RiverNorth DoubleLine Strategic Income (RNDLX), April 2011

By Editor

Objective

To provide both current income and total return. The fund has three distinct strategies, two overseen by DoubleLine, among which it allocates assets based on the advisor’s tactical judgment. The fund aims to be less volatile than the broad fixed-income market.

Adviser

RiverNorth Capital Management, LLC. RiverNorth, founded in 2000, specializes in quantitative and qualitative closed-end fund trading strategies and advises the RiverNorth Core Opportunity Fund (RNCOX) and a several hedge funds. They manage nearly $700 million for individuals and institutions, including employee benefit plans.

Manager

Patrick W. Galley and Stephen A. O’Neill, both of RiverNorth Capital and co-managers of the five-star RiverNorth Core Opportunity fund (RNCOX), and Jeffrey E. Gundlach. Mr. Gundlach ran TCW Total Return (TGLMX) from 1993 through 2009. For most trailing periods at the time of his departure, his fund had returns in the top 1% of its peer group. He was Morningstar’s fixed-income manager of the year in 2006 and a nominee for fixed income manager of the decade in 2009. Most of the investment staff from TCW moved to DoubleLine with him.

Management’s Stake in the Fund

None yet reported since the latest Statement of Additional Information precedes the fund’s launch. Mr. Galley owns more than 25% of the adviser and has between $100,000 and $500,000 in his Core Opportunity fund. Mr. Galley reports that “100% of our employees’ 401k assets [and] over 85% of the portfolio managers’ liquid net worth [is] invested in our own products.”

Opening date

December 30, 2010.

Minimum investment

$5000, reduced to $1000 for IRAs.

Expense ratio

1.28% on assets of about $1.3 Billion, as of July 2023. 

Comments

Many serious analysts expect a period of low returns across a whole variety of asset classes. GMO, for example, forecasts real returns of nearly zero on a variety of bond classes over the next five years. Forecasts for equity returns seem to range from “restrained” to “disastrous.”

If true, the received wisdom — invest in low cost, broadly diversified index funds or ETFs — will produce reasonable relative returns and unreasonable absolute ones. A popular alternative — be bold, make a few big bets — might produce better returns, but will certainly produce gut-wrenching periods. And, in truth, we’re not wired to embrace volatility.

The folks at RiverNorth propose an alternative of a sort of “core and explore” variety. RiverNorth DoubleLine Strategic Income has three “sleeves,” or distinct components in its portfolio:

  • Core Fixed Income, run by fixed-income superstar Jeff Gundlach & co., will follow the same strategy as the DoubleLine Core Fixed Income (DLFNX) fund though it won’t be a clone of the fund. As the name implies, this strategy will be the core of the portfolio. With it, Gundlach is authorized to invest globally in a wide variety of fixed-income assets. The asset allocation within this sleeve varies, based on Mr. G’s judgment.
  • Opportunistic Income, also run by Mr. G., will specialize in mortgage-backed securities. Most analysts argue that this is DoubleLine’s area of core competence, and that it’s contributed much of the alpha to his earlier TCW funds.
  • Tactical Closed-end Fund Income, run by Patrick Galley and the team at RiverNorth, invests in closed-end income funds when (1) they fit into the team’s tactical asset allocation model and (2) they are selling at an unsustainable discount. As investors in the (five-star) RiverNorth Core Opportunity (RNCOX) fund know, CEFs often sell at irrational discounts to their net asset value; that is, you might briefly be able to buy $100 worth of bonds for $80 or less. RiverNorth monitors both sectors and individual fund discounts. It buys funds when the discount is irrational and sells as soon as it returns to a rational level, looking in an arbitrage gain which is largely independent of the overall moves in the market. Ideally, the combination of opportunism and cognizance of volatility and concentration risk will allow the managers to produce a better risk adjusted return (i.e., a higher Sharpe ratio) than the Barclays Aggregate.

The fund’s logic is this: Gundlach’s Core Fixed Income sleeve is going to be rock-solid. If either Gundlach or Galley sees a high-probability, high-alpha opportunity in their respective areas of expertise, they’ll devote a portion of the portfolio to locking in those gains. If they see nothing special, a larger fraction of the fund will remain in the core portfolio. While most of us detest market volatility, Galley and Gundlach seem to be waiting anxiously for it since it gives them an opportunity to reap exceptional profits from the irrationality of other investors. The managers report that their favorite time to buy is “when your hand is shaking [as] you are going to write the check.” The ability to move assets out of Core and into one of the other sleeves means the managers will have the money available to exploit market panics, even if investor panic means the fund isn’t receiving new cash.

The CEF strategy is distinguished from the RNCOX version, which slides between CEFs (when pricing is irrational) and ETFs (when pricing is rational). Based on the managers’ judgment that Mr. Gundlach can consistently add alpha over what comparable ETFs might offer (both in sector and security selection), Mr. Galley will slide his resources between CEFs (when pricing is irrational) and Core Fixed Income (when pricing isn’t).

While there’s no formal “neutral allocation” for the fund, the managers can imagine a world in which about half of the fund is usually in Core Fixed Income and the remainder split between the two alpha-generating strategies. Since the three strategies are uncorrelated, they offer a real prospect of damping the portfolio’s overall volatility while adding alpha. How much alpha? In early February, the managers estimated that their strategies were yielding between the mid single digits (in two sleeves) and low double-digits (in the other).

Bottom Line

In reviewing RiverNorth Core in 2009, I described the case for the fund as “compelling.” Absent a crushing legal defeat for Mr. Gundlach in his ongoing fight with former employer TCW, the same term seems to fit here as well.

I’ve been pondering a question, posed on the board, about a three fund portfolio; that is, if you could own three and only three funds over the long haul, which would they be? Given its reasonable expenses, the managers’ sustained successes, innovative design and risk-consciousness, this might well be one of the three on my list anyway.

Fund website

RiverNorth Funds

RiverNorth/DoubleLine Strategic Income

Fact Sheet

© Mutual Fund Observer, 2011.  All rights reserved.  The information here reflects publicly available information current at the time of publication.  For reprint/e-rights contact [email protected].

FPA Queens Road Value (formerly Queens Road Value), (QRVLX), April 2011

By Editor

At the time of publication, this fund was named Queens Road Value.

Objective

The fund seeks capital appreciation by investing in the stocks or preferred shares of U.S. companies. They look for companies with strong balance sheets and experienced management, and stocks selling at discounted price/earnings and price-to-cash flow ratios. It used to be called Queens Road Large Cap Value, but changed its name to widen the range of allowable investments. Nonetheless, it continues to put the vast majority of its portfolio into large cap value stocks.

Adviser

Bragg Financial Advisors, headquartered in Charlotte, NC. In particular, their offices are on Queens Road. Bragg has been around since the early 1970s, provides investment services to institutions and individuals, and has about $400 million in assets under management. It’s now run by the second generation of the Bragg family.

Manager

Steven Scruggs, CFA. Mr. Scruggs has worked for BFA since 2000 and manages this fund and Queens Road Small Cap Value (QRSVX). That’s about it. No separate accounts, hedge funds or other distractions. On the other hand, he has no research analysts to support him.

Management’s Stake in the Fund

As of the most recent Statement of Additional Information, Mr. Scruggs has invested between $10,000 and $50,000 in his fund. Though small in absolute terms, it’s described as “the vast majority of [his] investable assets.”

Opening date

June 13, 2002.

Minimum investment

$2500 for regular accounts, $1000 for tax-sheltered accounts.

Expense ratio

0.95% on assets of $19 million.

Comments

Steven Scruggs, and his investing partner Benton Bragg, are trying to do a simple, sensible thing well. By their own description, they’re trying to tune out the incessant noise – the market’s down, gold is up, it’s the “new normal,” no, it isn’t, Glenn Beck has investing advice, the Hindenburg’s been spotted, volumes are thin – and focus on what works: “over long periods of time companies are worth the amount of economic profits they earn for their shareholders.” They’re not trying to out-guess the market or make top-down calls. They’re mostly trying to find companies that will make more money over the next five years than they’re making now. When the stocks of those companies are unreasonably cheap, they buy them and hold them for something like 5-7 years. When they don’t find stocks that are unreasonably cheap given their companies’ prospects, they let cash (or gold, a sort of cash substitute) accumulate. As of the last portfolio disclosure, gold is about 3% and cash about 11% of the portfolio. The fund typically holds 50 or so names, which is neither terribly focused nor terribly dilute. He’s been avoiding big banks in favor of insurers. He’s overweighted technology, because many of those companies have remarkably solid financials right now. The manager anticipates slow growth and, it seems, mostly imprudent government intervention. As a result, he’s being cautious in his attempts to find high quality companies with earnings growth potential. All of this has produced a steady ride for the fund’s investors. The fund outperformed its peer group in every quarter of the 2007-09 meltdown and performed particularly well during the market drops in June and August 2010. And it tends to post competitive returns in rising markets. Its ability to handle poor weather places the fund near the top of its large-value cohort for the past one, three and five-year periods, as well as the eight-year period since inception.

Bottom Line

A fund for the times, or for the timid? It might be either. It’s clear that most retail investors have long patience (or courage) and are not willing to embrace high volatility investments. Mr. Scruggs ongoing skepticism about the market and economy, his attention to financially solid firms, and willingness to hold cash likely will serve such investors well.

Fund website

Queens Road Value Fund

© Mutual Fund Observer, 2011.  All rights reserved.  The information here reflects publicly available information current at the time of publication.  For reprint/e-rights contact [email protected].

Prospector Capital Appreciation (PCAFX), April 2011

By Editor

Objective

Seeks capital appreciation by investing globally in a combination of stocks and “equity-related securities,” though they have latitude to invest in a broad array of distressed debt. Their activities are limited to the U.S. “and other developed markets.” They look for firms with good long-term prospects for generating total return (appreciation plus dividends), good managers, good products and some evidence of a catalyst for unlocking additional value.

Adviser

Prospector Partners Asset Management, LLC . Prospector was founded in 1997 and manages about $2 billion in assets, including $70 million in its two mutual funds.

Managers

John Gillespie, Richard Howard and Kevin O’Brien. Mr. Howard, the lead manager, was the storied manager of the storied T. Rowe Price Capital Appreciation Fund (PRWCX, 1989-2001). Mr. Gillespie spent a decade at T. Rowe Price, including a stint as manager of Growth Stock (PRGFX, 1994-96) and New Media (1993-1997). Mr. O’Brien comanaged Neuberger Berman Genesis (NBGNX). All three have extensive experience at White Mountain Insurance, whose investment division has Buffett-like credentials.

Management’s Stake in the Fund

Each of the managers has over $100,000 invested in the fund and into their other charge, Prospector Opportunity, as well. The fund’s officers and board own 17% of the shares of PCAFX. Mr. Gillespie and his family own 20% and Mr. Howard owns almost 7%. They also own a majority of the advisor.

Opening date

9/27/2007

Minimum investment

$10,000 across the board.

Expense ratio

1.26% after waivers on assets of $28.3 million, plus a 2% redemption fee on shares held fewer than 60 days.

Comments

Most investors folks on two sorts of securities — stocks and bonds. The former provides an ownership stake in a firm, the latter provides the opportunity to lend money to the firm with the prospect of repayment with interest. There are, however, other options. One, called convertible securities, are a sort of hybrid. They have bond-like characteristics (fairly high payouts, fairly low volatility) but they are convertible under certain characteristics into shares of company stock. That conversion possibility then creates a set of equity-linked characteristics: because investors know that these things can become stock, their value risks when the value of the firm’s stock rises. As a result, you buy a fraction of the stock’s upside and a fraction of its downside with steady income to boot. The trick, of course, is making sure that the “fraction of upside” is greater than the “fraction of downside.” That is, if you can capture 90% of a stock’s potential gains with only half of its potential losses, you win. Successful convertibles investing is a tricky business, undertaken by durn few funds. The few that do it well have accumulated spectacular risk-adjusted records for their investors. These include Matthews Asian Growth & Income (MACSX), a singularly excellent play on Asian investing, T. Rowe Price Capital Appreciation (PRCWX), which consistently beats 98% of its peers over longer time frames, and, to a lesser extent, FPA Crescent (FPACX). You can now add Prospector Capital Appreciation to that list. Prospector’s prime charms are two: first, it has a sensible strategy for the use of convertibles. The fund starts its investment process by looking at the firm, then seeking convertibles which can offer a large fraction of the gains made by a firm’s stock with substantial downside protection. It buys common stock only if the firm is attractive but no convertible shares are to be had. Six of 10 largest buys in the first half of 2010 were convertibles. Because the market lately has favored lower-quality over higher-quality stocks, the fund has been able to add blue chip names, an occurrence which seems to leave him slightly dumb-struck: “we continue adding recognized high quality stocks to the portfolio . . . this seems almost surreal. We are used to buying mediocre companies that are getting better or good companies that few have heard of, not recognized quality.” At the moment (late 2010) about a quarter of the portfolio is in convertibles, about 13% in international stocks, a bit in bonds and cash, and the remainder in US stocks. The manager’s value orientation led him to include three gold miners in the top ten holdings but to avoid, almost entirely, tech names. The second attraction is the fund’s lead manager, Richard Howard. Mr. Howard guided T. Rowe Price Capital Apprecation is a spectacular performance over 12 years. He turned a $10,000 initial investment into $42,000, which dwarfed his peers’ performance (they averaged $32,000) and gave him one of the best records for any fund in Morningstar’s old “domestic hybrid” category. For much of that time, he kept pace with the hard-charging S&P500, lagging it in the bubble of the late 90s and making up much of the ground before his departure in August 2001. He posted only one small calendar-year losses in 12 years of management. He seems not to have lost his touch. The fund just passed its third anniversary and earned a five star rating from Morningstar, posting “high” returns for “average” risk. Moreover, he’s outperformed his old fund by about a third, lost noticeably less in 2008 and has done so with less volatility.

Bottom Line

Conservative equity investors should look seriously at funds, such as this, which seem to have mastered the use of convertible securities as a tool of risk management and enhanced returns. The investment minimum here is regrettably high and the expense ratio is understandably high. The primary appeal over Price Cap App is two-fold: Mr. Howard’s skills and the tiny asset base, which should give him the availability to establish meaningful positions in securities too small to profit the Price fund.

Fund website

Prospector Capital Appreciation homepage

Fact Sheet

© Mutual Fund Observer, 2011.  All rights reserved.  The information here reflects publicly available information current at the time of publication.  For reprint/e-rights contact [email protected].

Hussman Strategic International Equity (HSIEX), April 2011

By Editor

Hussman Strategic International Equity Fund was liquidated in June, 2023. Information in this profile is provided purely for archival purposes.

Objective

The fund seeks long term capital growth, but with special emphasis on defensive actions during unfavorable market conditions. The portfolio is a mix of individual securities, ETFs (up to 30% of the portfolio) and hedges. In the near term, the hedging strategy will focus on shorting particular markets; the fund can short individual ETFs but “the fund does not intend to use these hedging techniques during the coming year.” The portfolio balance is determined by the manager’s macro-level assessments of world markets. The fund may be fully hedged (that is, the amount long exactly matches the amount short), but it will not be net short.

Adviser

Hussman Econometrics Advisors of beautiful Ellicott City, Maryland. The advisor was founded in 1989 by John Hussman, who is the firm’s President and sole shareholder. Hussman also advises the Hussman Strategic Growth and Hussman Strategic Total Return funds but does not advise any private accounts. Together, those funds hold about $9 billion in assets.

Manager

John Hussman and William Hester. Hussman has a Ph.D. in economics from Stanford, a Masters degree in education and social policy and a B.A. in economics from Northwestern University. Prior to managing the Hussman Funds, he was a adjunct assistant professor of economics and international finance at the University of Michigan and its business school, an options mathematician at the Chicago Board of Trade, and publisher (since ’88) of the Hussman Econometrics newsletter. Mr. Hester has been Hussman’s Senior Research Analyst since 2003, and this will be his first stint at co-managing a fund.

Management’s Stake in the Fund

“Except for a tiny percentage in money market funds, all of Dr. Hussman’s liquid assets are invested in the Hussman Funds,” which translates to over a million in each of his two funds, plus sole ownership of the advisor. Likewise, “The compensation of every member of our Board of Trustees is generally invested directly into the Funds. All of these investments are regular and automatic.”

Opening date

December 31, 2009, sort of. The fund ran for nine months of road-testing, with only the manager’s own money in the fund. It opened to purchases by the public on September 1, 2010.

Minimum investment

$1,000 for regular, $500 for IRA/UGMA accounts and $100 for automatic investing plans.

Expense ratio

Capped at 2.0% through the end of 2012. The fund’s actual operating expenses are around 5.0%, measured against an in-house asset base of $7.5 million. The Strategic Growth Fund, of which this is an offshoot, has expenses around 1%. There’s a 1.5% redemption fee on shares held fewer than sixty days.

Comments

Dr. Hussman’s funds have drawn huge inflows in the past several years. Strategic Total Return (HSTRX) grew from under $200 million in June 2007 to $2.3 billion by June 2010. Strategic Growth (HSGFX) grew from $2.7 billion to $6.7 billion in the same period. The reason’s simple: over the past five years, they’ve made money. Total Return posted a healthy profit in 2008 (7%) and over the entire period of the market crash (an 8% rise from 10/07 – 03/09). In a crash where the Total Stock Market index dropped nearly 50%, Strategic Growth’s 5% decline became phenomenally attractive. And so the money poured in.

Presumably that track record will quickly draw attention, and assets, here.

Mr. Hussman’s success has been driven by his ability to make macro-level assessments of markets and economies, and then to position his funds with varying degrees of defensiveness based on those assessments. He has frequently been right, though that merely means he’s mostly been bearish.

Before investing in the fund, one might consider several reservations:

  1. Mr. Hussman has relatively little experience, at least as measured by portfolio composition, in international investing. Non-U.S. stocks comprise only 5-6% of his other portfolios.
  2. The other Hussman funds could, if Mr. H. found the case compelling, provide substantially more international exposure. At the very least, Strategic Growth’s portfolio contains no explicit limitation on the extent of international exposure in the portfolio.
  3. Mr. Hussman himself is skeptical of the value of international investing. His argument in January 2009 was striking:

    . . . the correlation of returns across various markets increases during recessionary periods. As I noted in November 2007 . . . global diversification is least useful when it’s needed most. And this data shows that not only does the correlation between US and international markets rise during recessions, but that global returns trail US returns during these periods. Lower returns with higher correlation. This data implies that the benefits of international investing and diversification come predominantly during periods of global expansion, and not during bear markets induced by recessions.

  4. Assets under management are ballooning. $2 billion in new – read: “hot” – money in a single year is a lot for a small operation to handle (c.f. Van Wagoner funds), and there’s no immediate sign of a decrease. Encouraging still-more inflows comes at a cost.

Mr. Hussman has done good work. I’ve written, favorably and repeatedly, about his Strategic Total Return fund. I’ve invested in that fund. And I’ve been impressed with his concern about shareholder-friendly policies, including his own financial commitment to the funds. That said, Mr. Hussman has not – so far as I can find – made any public statements explaining the launch of, or reasons behind this new fund.

Bottom Line

I don’t know why you’d want to invest in this fund. The expenses are high, the existing funds can provide international exposure and the manager himself seems skeptical of the rationale for international investing. That’s not an argument that you should run away. It’s a simple observation that the particular advantages of this fund are still undefined.

Fund website

The Hussman Funds. Hussman’s 2009 critique of international investing is also available on his website.

© Mutual Fund Observer, 2011.  All rights reserved.  The information here reflects publicly available information current at the time of publication.  For reprint/e-rights contact [email protected].

Artisan Value (ARTLX), April 2011

By Editor

Objective

Multi-cap value equity. The managers have three broad criteria for equity selection: attractive valuation, sound financial condition and attractive business economics. The managers may invest in turnarounds, companies in transition, and companies that have experienced (short-term) earnings shortfalls. The minimum market cap $1.5 billion. While the primary focus is on U.S. companies, up to 25% of the portfolio can be invested in foreign firms.

Adviser

Artisan Partners, LP. Artisan manages $45 billion in eight mutual funds, including Opportunistic Value and separate accounts. Five of its seven existing funds are closed to new investors. Artisans’ managers are all co-owners of the advisory firm.

Managers

Daniel L. Kane, Thomas A. Reynolds IV, and Craig Inman. 

Opening date

March 27, 2006

Minimum investment

$1000 for both regular and IRA accounts. The minimum is waived for investors establishing an automatic monthly investment of at least $50.

Expense ratio

1.06% on assets of $260 million, as of June 2023. 

David’s comments

There are two concerns before investing in Opportunistic Value. First, is there any reason to believe that the managers have the expertise to invest large caps? That’s a good question and one for which there’s no immediate answer. And, second, with two closed funds and separate account assets already, are they overstretched? The fund assets sit around $5 billion, each has 50% turnover. That’s a lot of money, though certainly not beyond the range of what many multi-cap managers at smaller firms (Ron Muhlenkamp and four analysts handle over $3 billion, Wally Weitz handle $5 billion, the folks at Longleaf handle $9 billion). For both questions, the answer might be “a stretch but not necessarily overstretched.”

Weighed against that

(1) Artisan gets it right. Artisan has a great track record for new fund launches. The company launches a new fund only when two conditions are satisfied: it believes it can add significant value and it has a manager who has the potential to be a “category killer.” Almost all of Artisan’s new funds have had very strong first-year performance (their most recent launches – International Small Cap and International Value – finished in the top 1% and 24%, respectively) and above average long-term performance. All of the managers are risk-conscious, so even the “growth” managers tend toward the “value” end of the spectrum. Beyond that, Artisan tends to charge below average expenses, they don’t pay for marketing, and close their funds early.

(2) Satterwhite gets it right. Before joining Artisan in 1997, the lead manager – Scott Satterwhite – ran a very successful small-value portfolio called Biltmore (later, Wachovia) Special Values. His main charge at Artisan, Small Cap Value (ARTVX), tends to have modest volatility and above average returns. It tends to outperform its peers in rocky markets and trail only slightly in boisterous ones. His newer charge, Midcap Value (ARTQX) has had a phenomenal four-year history despite cooling over the past twelve months.

(3) A tested discipline should help them keep it right. Opportunistic Value will use the same stock selection criteria that have served the managers well for the past decade in their other two funds. As a result, there should be relatively few surprises in store.

Bottom line

For investors interested in a place on the “all cap” bandwagon, this is about as promising as a new offering can get.

Company link

http://www.artisanfunds.com/mutual_funds/artisan_funds/value.cfm

April 1, 2006
© Mutual Fund Observer, 2011.  All rights reserved.  The information here reflects publicly available information current at the time of publication.  For reprint/e-rights contact [email protected].