Category Archives: Charles

Identifying Bear-Market Resistant Funds During Good Times

By Charles Boccadoro

Originally published in April 1, 2015 Commentary
It’s easy enough to look back at the last bear market to see which funds avoided massive drawdown. Unfortunately, portfolio construction of those same funds may not defend against the next bear, which may be driven by different instabilities.

Dodge & Cox Balanced Fund (DODBX) comes to mind. In the difficult period between August 2000 and September 2002, it only drew down 11.6% versus the S&P 500’s -44.7% and Vanguard’s Balanced Index VBINX -22.4%. Better yet, it actually delivered a healthy positive return versus a loss for most balanced funds.

Owners of that fund (like I was and remain) were disappointed then when during the next bear market from November 2007 to February 2009, DODBX performed miserably. Max drawdown of -45.8%, which took 41 months to recover, and underperformance of -6.9% per year versus peers. A value-oriented fund house, D&C avoided growth tech stocks during the 2000 bubble, but ran head-on into the financial bubble of 2008. Indeed, as the saying goes, not all bear markets are the same.

Similarly, funds may have avoided or tamed the last bear by being heavy cash, diversifying into uncorrelated assets, hedging or perhaps even going net short, only to underperform in the subsequent bull market. Many esteemed fund managers are in good company here, including Robert Arnott, John Hussman, Andrew Redleaf, Eric Cinnamond to name a few.

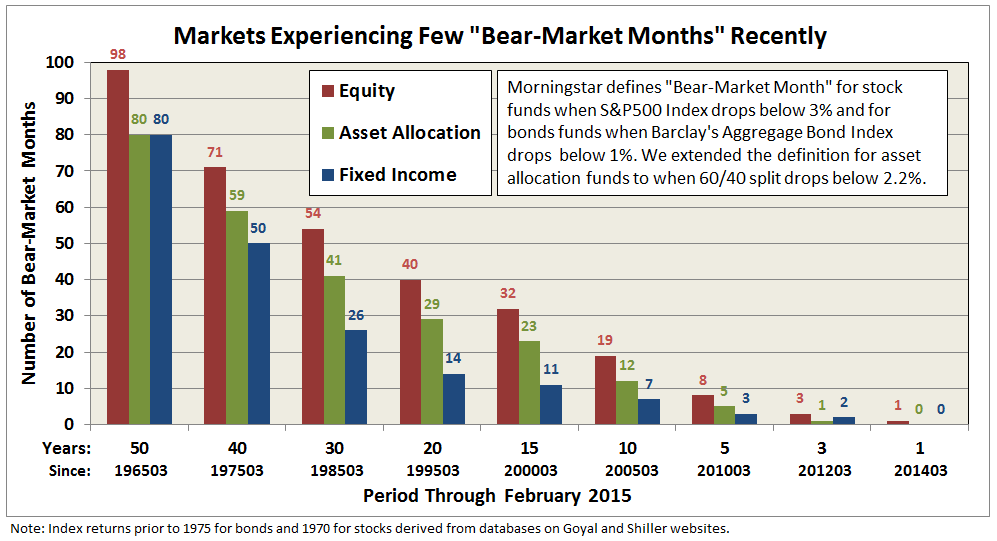
Morningstar actually defines a so-called “bear-market ranking,” although honestly this metric must be one of least maintained and least acknowledged on its website. “Bear-market rankings compare how funds have held up during market downturns over the past five years.” The metric looks at how funds have performed over the past five years relative to peers during down months. Applying the methodology over the past 50 years reveals just how many “bear-market months” investors have endured, as depicted in the following chart:

bmdev_1

The long term average shows that equity funds experience a monthly drop below 3% about twice a year and fixed income funds experience a drop below 1% about three times every two years. There have been virtually no such drops this past year, which helps explain the five-year screening window.

The key question is whether a fund’s performance during these relatively scarce down months is a precursor to its performance during a genuine bear market, which is marked by a 20% drawdown from previous peak for equity funds.

Taking a cue from Morningstar’s methodology (but tailoring it somewhat), let’s define “bear market deviation (BMDEV)” as the downside deviation during bear-market months. Basically, BMDEV indicates the typical percentage decline based only on a fund’s performance during bear-market months. (See Ratings System Definitions and A Look at Risk Adjusted Returns.)

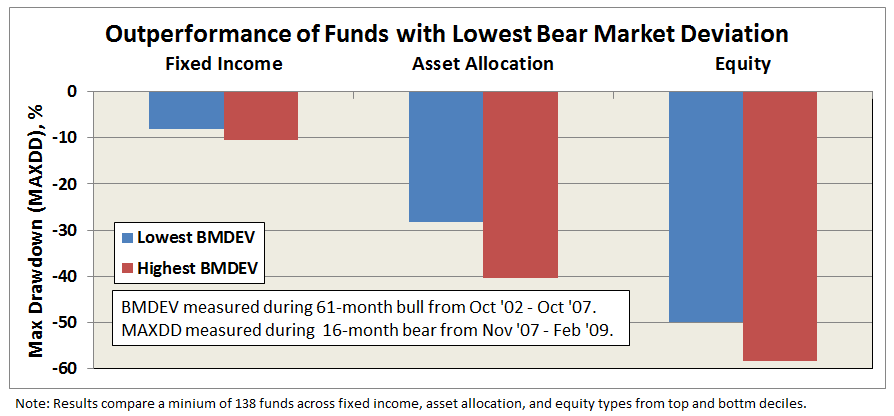
The bull market period preceding 2008 was just over five years, October 2002 through October 2007, setting up a good test case. Calculating BMDEV for the 3500 or so existing funds during that period, ranking them by decile within peer group, and then assessing subsequent bear market performance provides an encouraging result … funds with the lowest bear market deviation (BMDEV) well out-performed funds with the highest bear market deviation, as depicted below.

bmdev_2

Comparing the same funds across the full cycle reveals comparable if not superior absolute return performance of funds with the lowest bear market deviation. A look at the individual funds includes some top performers:  

bmdev_3

The correlation did not hold up in all cases, of course, but it is a reminder that the superior return often goes hand-in-hand with protecting the downside.

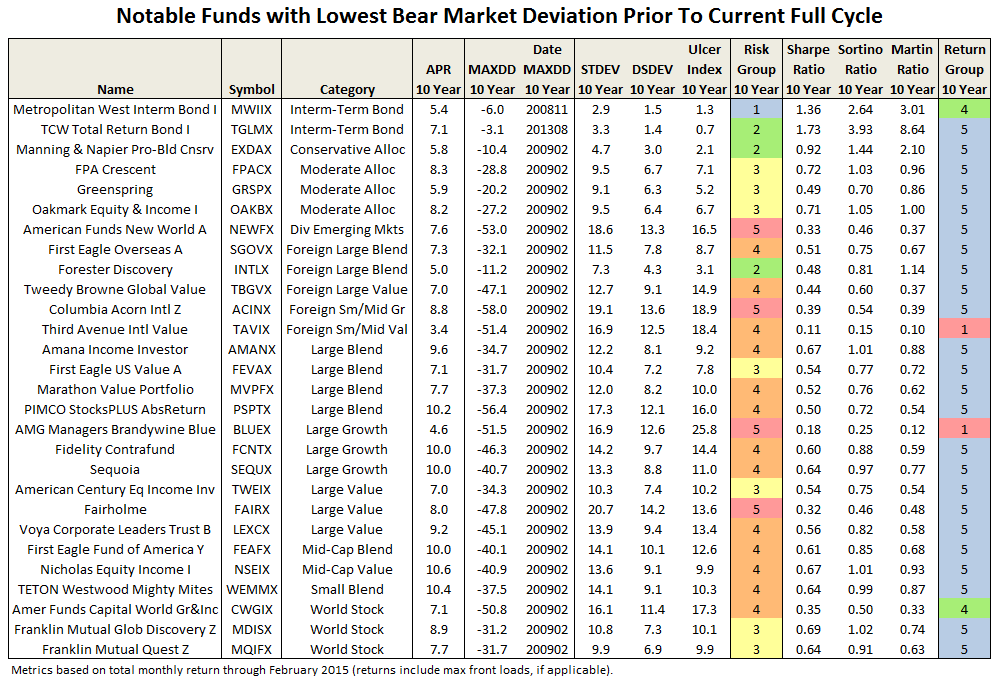
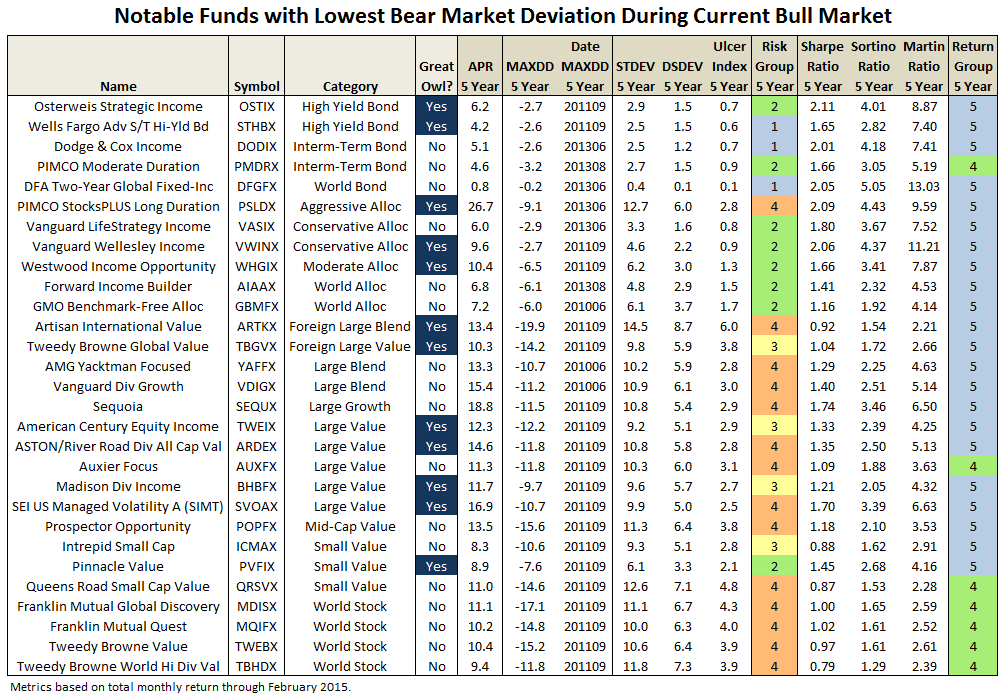
Posturing then for the future, which funds have the lowest bear-market deviation over the current bull market? Evaluating the 5500 or so existing funds since March 2009 produces a list of about 450 funds. Some notables are listed below and the full list can be downloaded here. (Note: The full list includes all funds with lowest decile BMDEV, regardless of load, manager change, expense ratio, availability, min purchase, etc., so please consider accordingly.)

bmdev_4

All of the funds on the above list seem to make a habit of mitigating drawdown, experiencing a fraction of the market’s bear-market months. In fact, a backward look of the current group reveals similar over-performance during the financial crisis when compared to those funds with the highest BMDEV.

Also, scanning through the categories above, it appears quite possible to have some protection against downside without necessarily resorting to long/short, market neutral, tactical allocation, and other so-called alternative investments. Although granted, the time frame for many of the alternatives categories is rather limited.

In any case, perhaps there is something to be said for “bear-market rankings” after all. Certainly, it seems a worthy enough risk metric to be part of an investor’s due diligence. We will work to make available updates of bear-market rankings for all funds to MFO readers in the future.

Meb Faber’s New Book

By Charles Boccadoro

Global-Asset-Allocation-with-border-683x1024Originally published in March 1, 2015 Commentary
Official publication date is tomorrow, March 2.

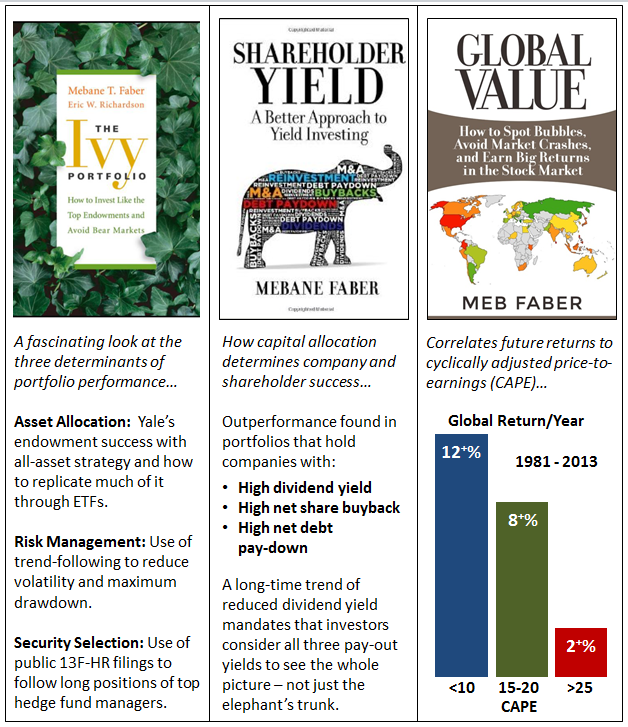
Like his last two books, Shareholder Yield and Global Value, reviewed in last year’s May commentary, his new book “Global Asset Allocation: A Survey of the World’s Top Asset Allocation Strategies” is a self-published ebook available on Amazon for just $2.99.

On his blog, Mr. Faber states “my goal was to keep it short enough to read in one sitting, evidence-based with a basic summary that is practical and easily implementable.”

That description is true of all Meb’s books, including his first published by Wiley in 2009, The Ivy Portfolio. To celebrate he’s making downloads of Shareholder Yield and Global Value available for free.

We will review his new book next time we check-in on Cambria’s ETF performance.


Here appears to be its Table of Contents:

INTRODUCTION

CHAPTER 1 – A History of Stocks, Bonds, and Bills

CHAPTER 2 – The Benchmark Portfolio: 60/40

CHAPTER 3 – Asset Class Building Blocks

CHAPTER 4 – The Risk Parity and All Seasons Portfolios

CHAPTER 5 – The Permanent Portfolio

CHAPTER 6 – The Global Market Portfolio

CHAPTER 7 – The Rob Arnott Portfolio

CHAPTER 8 – The Marc Faber Portfolio

CHAPTER 9 – The Endowment Portfolio: Swensen, El-Erian, and Ivy

CHAPTER 10 – The Warren Buffett Portfolio

CHAPTER 11 – Comparison of the Strategies

CHAPTER 12 – Implementation (ETFs, Fees, Taxes, Advisors)

CHAPTER 13 – Summary

APPENDIX A – FAQs

Whitebox Tactical Opportunities 4Q14 Conference Call

By Charles Boccadoro

wbmix_logo

Originally published in March 1, 2015 Commentary
Portfolio managers Andrew Redleaf and Dr. Jason Cross, along with Whitebox Funds’ President Bruce Nordin and Mike Coffey, Head of Mutual Fund Distribution, hosted the 4th quarter conference call for their Tactical Opportunities Fund (WBMIX) on February 26. Robert Vogel and Paul Twitchell, the fund’s third and fourth portfolio managers, did not participate.

Prolific MFO board contributor Scott first made us aware of the fund in August 2012 with the post “Somewhat Interesting Tiny Fund.” David profiled its more market neutral and less tactical (less directionally oriented) sibling WBLFX in April 2013. I discussed WBMIX in the October 2013 commentary, calling the fund proper “increasingly hard to ignore.” Although the fund proper was young, it possessed the potential to be “on the short list … for those who simply want to hold one all-weather fund.”

WBMIX recently pasted its three year mark and at $865M AUM is no longer tiny. Today’s question is whether it remains an interesting and compelling option for those investors looking for alternatives to the traditional 60/40 balanced fund at a time of interest rate uncertainty and given the two significant equity drawdowns since 2000.

Mr. Redleaf launched the call by summarizing two major convictions:

  • The US equity market is “expensive by just about any measure.” He noted examples like market cap to GDP or Shiller CAPE, comparing certain valuations to pre great recession and even pre great depression. At such valuations, expected returns are small and do not warrant the downside risk they bear, believing there is a “real chance of 20-30-40 even 50% retraction.” In short, “great risk in hope of small gain.”
  • The global markets are fraught with risk, still recovering from the great recession. He explained that we were in the “fourth phase of government action.” He called the current phase competitive currency devaluation, which he believes “cannot work.” It provides temporary relief at best and longer term does more harm than good. He seems to support only the initial phase of government stimulus, which “helped markets avert Armageddon.” The last two phases, which included the zero interest rate policy (ZIRP), have done little to increase top-line growth.

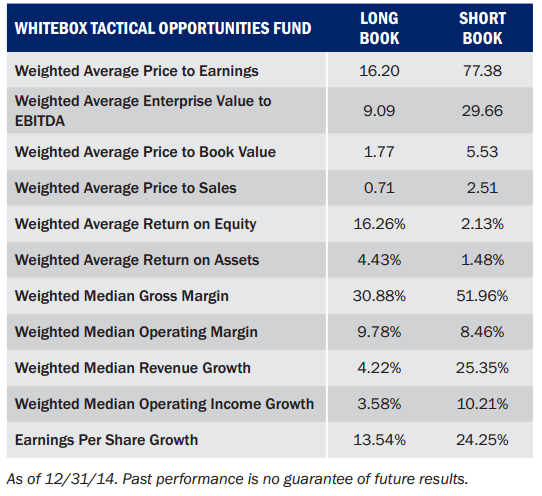
Consequently, toward middle of last year, Tactical Opportunities (TO) moved away from its long bias to market neutral. Mr. Redleaf explained the portfolio now looks to be long “reasonably priced” (since cheap is hard to find) quality companies and be short over-priced storybook companies (some coined “Never, Nevers”) that would take many years, like 17, of uninterrupted growth to justify current prices.

The following table from its recent quarterly commentary illustrates the rationale:

wbmix_0

Mr. Redleaf holds a deep contrarian view of efficient market theory. He works to exploit market irrationalities, inefficiencies, and so-called dislocations, like “mispriced securities that have a relationship to each other,” or so-called “value arbitrage.” Consistently guarding against extreme risk, the firm would never put on a naked short. Its annual report reads “…a hedge is itself an investment in which we believe and one that adds, not sacrifices returns.”

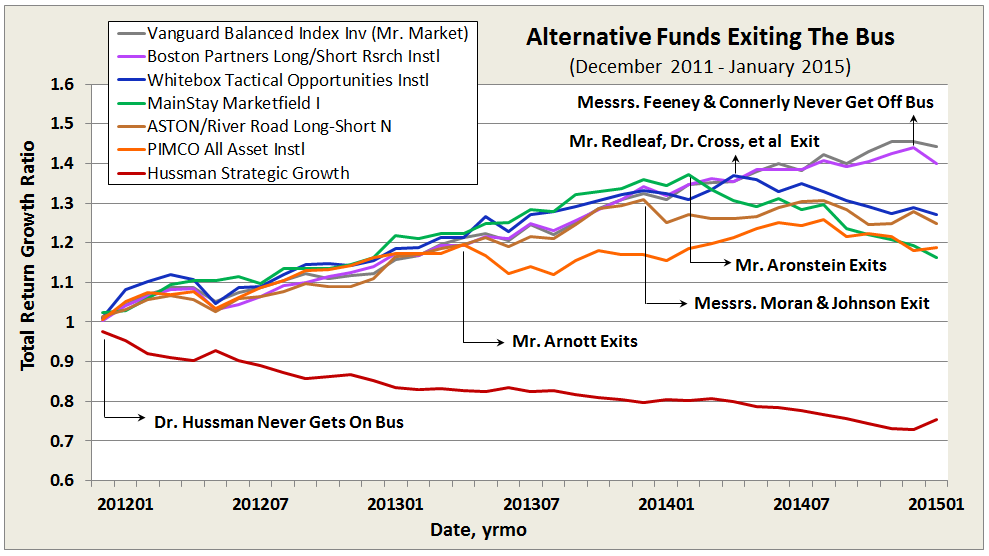
But that does not mean it will not have periods of underperformance and even drawdown. If the traditional 60/40 balanced fund performance represents the “Mr. Market Bus,” Whitebox chose to exit middle of last year. As can be seen in the graph of total return growth since WBMIX inception, Mr. Redleaf seems to be in good company.

wbmix_1

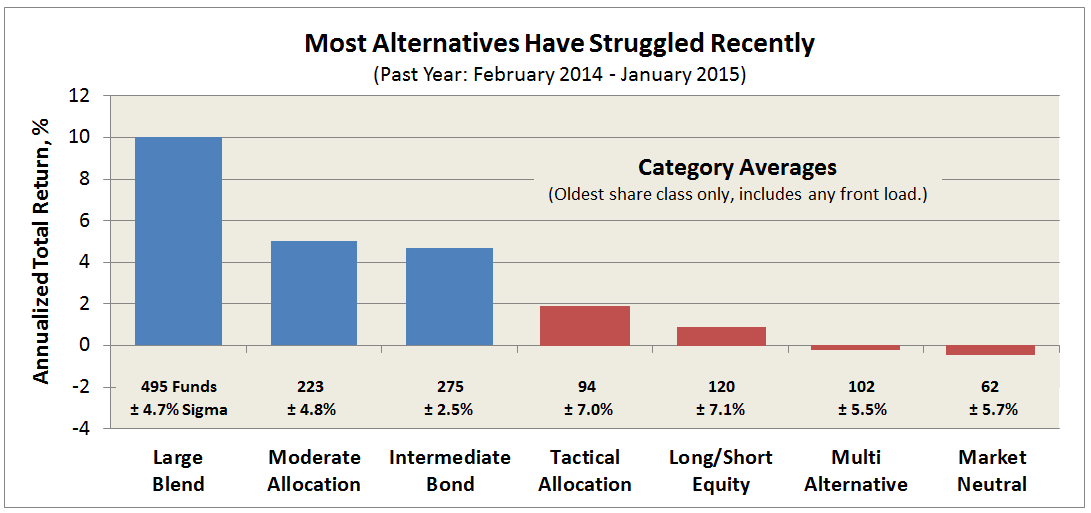
Whether the “exit” was a because of deliberate tactical moves, like a market-neutral stance, or because particular trades, especially long/short trades went wrong, or both … many alternative funds missed-out on much of the market’s gains this past year, as evidenced in following chart:

wbmix_2

But TO did not just miss much of the upside, it’s actually retracted 8% through February, based on month ending total returns, the greatest amount since its inception in December 2011; in fact, it has been retracting for ten consecutive months. Their explanation:

Our view of current opportunity has been about 180 degrees opposite Mr. Market’s. Currently, we love what we’d call “intelligent value” while Mr. Market apparently seems infatuated with what we’d call “unsustainable growth.”

Put bluntly, the stocks we disfavored most (and were short) were among the stocks investors remained enamored with.

A more conservative strategy would call for moving assets to cash. (Funds like ASTON RiverRoad Independent Value, which has about 75% cash. Pinnacle Value at 50%. And, FPA Crescent at 44%.) But TO is more aggressive, with attendant volatilities above 75% of SP500, as it strives to “produce competitive returns under multiple scenarios.” This aspect of the fund is more evident now than back in October 2013.

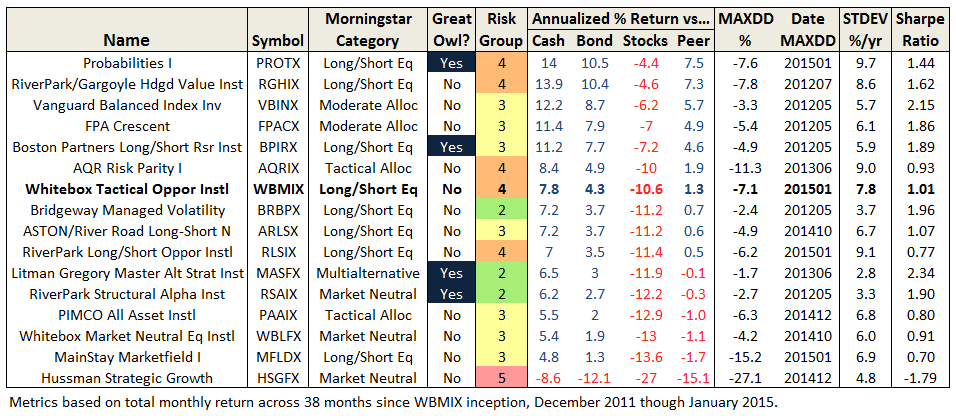
Comparing its performance since launch against other long-short peers and some notable alternatives, WBMIX now falls in the middle of the pack, after a strong start in 2012/13 but disappointing 2014:

wbmix_3

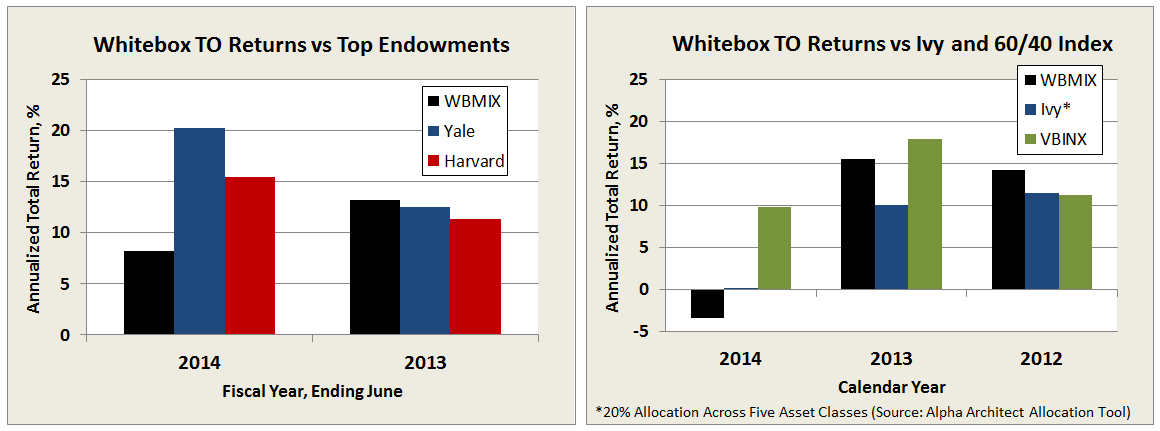
From the beginning, Mr. Redleaf has hoped TO would be judged in comparison to top endowments. Below are a couple comparisons, first against Yale and Harvard, which report on fiscal basis, and second against a simple Ivy asset allocation (computed using Alpha Architect’s Allocation Tool) and Vanguard’s 60/40 Balanced Index. Again, a strong showing in 2012/13, but 2014 was a tough year for TO (and Ivy).

wbmix_4

Beyond strategy and performance, the folks at Whitebox continue to distinguish themselves as leaders in shareholder friendliness – a much welcomed and refreshing attribute, particularly with former hedge fund shops now offering the mutual funds and ETFs. Since last report:

  • They maintain a “culture of transparency and integrity,” like their name suggests providing timely and thoughtful quarterly commentaries, published on their public website, not just for advisors. (In stark contrast to other firms, like AQR Funds, which in the past have stopped publishing commentaries during periods of underperformance, no longer make commentaries available without an account, and cater to Accredited Investors and Qualified Eligible Persons.)
  • They now benchmark against SP500 total return, not just SPX.
  • They eliminated the loaded advisor share class.
  • Their expense ratio is well below peer average. Institutional shares, available at some brokerages for accounts with $100K minimum, have been running between 1.25-1.35%. They impose a voluntary cap of 1.35%, which must be approved by its board annually, but they have no intention of ever raising … just the opposite as AUM grows, says Mr. Coffey. (The cap is 1.6% for investor shares, symbol WBMAX.)

These ratios exclude the mandatory reporting of dividend and interest expense on short sales and acquired fund fees, which make all long/short funds inherently more expensive than long only equity funds. The former has been running about 1%, while the latter is minimal with selective index ETFs.

  • They do not charge a short-term redemption fee.

All that said, they could do even better going forward:

  • While Mr. Redleaf has over $1M invested directly with the fund, the most recent SAI dated 15 January 2015, indicates that the other three portfolio managers have zero stake. A spokesman for the fund defends “…as a smaller company, the partners’ investment is implicit rather than explicit. They have ‘Skin in the game,’ as a successful Tac Ops increases Whitebox’s profitability and on the other side of the coin, they stand to lose.”

David, of course, would argue that there is an important difference: Direct shareholders of a fund gain or lose based on fund performance, whereas firm owners gain or lose based on AUM.

Ed, author of two articles on “Skin in the Game” (Part I & Part II), would warn: “If you want to get rich, it’s easier to do so by investing the wealth of others than investing your own money.”

  • Similarly, the SAI shows only one of its four trustees with any direct stake in the fund.
  • They continue to impose a 12b-1 fee on their investor share class. A simpler and more equitable approach would be to maintain a single share class eliminating this fee and continue to charge lowest expenses possible.
  • They continue to practice a so-called “soft money” policy, which means the fund “may pay higher commission rates than the lowest available” on broker transactions in exchange for research services. Unfortunately, this practice is widespread in the industry and investors end-up paying an expense that should be paid for by the adviser.

In conclusion, does the fund’s strategy remain interesting? Absolutely. Thoughtfulness, logic, and “arithmetic” are evident in each trade, in each hedge. Those trades can include broad asset classes, wherever Mr. Redleaf and team deem there are mispriced opportunities at acceptable risk.

Another example mentioned on the call is their longstanding large versus small theme. They believe that small caps are systematically overpriced, so they have been long on large caps while short on small caps. They have seen few opportunities in the credit markets, but given the recent fall in the energy sector, that may be changing. And, finally, first mentioned as a potential opportunity in 2013, a recent theme is their so-called “E-Trade … a three‐legged position in which we are short Italian and French sovereign debt, short the euro (currency) via put options, and long US debt.”

Does the fund’s strategy remain compelling enough to be a candidate for your one all-weather fund? If you share a macro-“market” view similar to the one articulated above by Mr. Redleaf, the answer to that may be yes, particularly if your risk temperament is aggressive and your timeline is say 7-10 years. But such contrarianism comes with a price, shorter-term at least.

During the call, Dr. Cross addressed the current drawdown, stating that “the fund would rather be down 8% than down 30% … so that it can be positioned to take advantage.” This “positioning” may turn out to be the right move, but when he said it, I could not help but think of a recent post by MFO board member Tampa Bay:

“Far more money has been lost by investors preparing for corrections, or trying to anticipate corrections, than has been lost in corrections themselves.” – Peter Lynch 

Mr. Redleaf is no ordinary investor, of course. His bet against mortgages in 2008 is legendary. Whitebox Advisers, LLC, which he founded in 1999 in Minneapolis, now manages more than $4B.

He concluded the call by stating the “path to victory” for the fund’s current “intelligent value” strategy is one of two ways: 1) a significant correction from current valuations, or 2) a fully recovered economy with genuine top-line growth.

Whitebox Tactical Opportunities is facing its first real test as a mutual fund. While investors may forgive not making money during an upward market, they are notoriously unforgiving losing money (eg., Fairholme 2011), perhaps unfairly and perhaps to their own detriment, but even over relatively short spans and even if done in pursuit of “efficient management of risk.”

Newest ETFs from Cambria Funds and AlphaArchitect

By Charles Boccadoro

Originally published in January 1, 2015 Commentary
header-logo
Cambria Funds recently launched two ETFs, as promised by its CIO Mebane Faber, who wants to “disrupt the traditional high fee mutual fund and hedge fund business, mostly through launching ETFs.” The line-up is now five funds with assets under management totaling more than $350M:

  • Cambria Shareholder Yield ETF (SYLD)
  • Cambria Foreign Shareholder Yield ETF (FYLD)
  • Cambria Global Value ETF (GVAL)
  • Cambria Global Momentum ETF (GMOM)
  • Cambria Global Asset Allocation ETF (GAA)

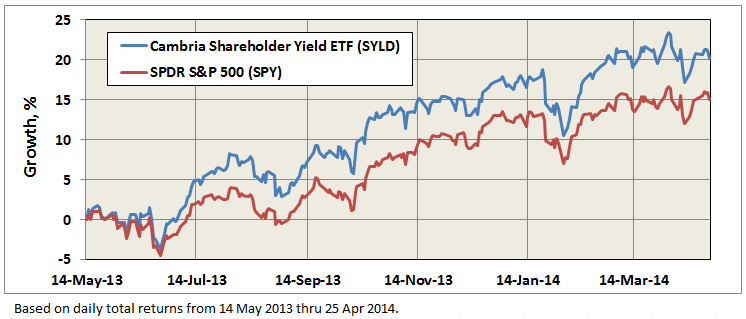
We wrote about the first three in “The Existential Pleasures of Engineering Beta” this past May. SYLD is now the largest actively managed ETF among the nine categories in Morningstar’s equity fund style box (small value to large growth). It’s up 12% this year and 32% since its inception May 2013.

GMOM and GAA are the two newest ETFs. Both are fund of funds.

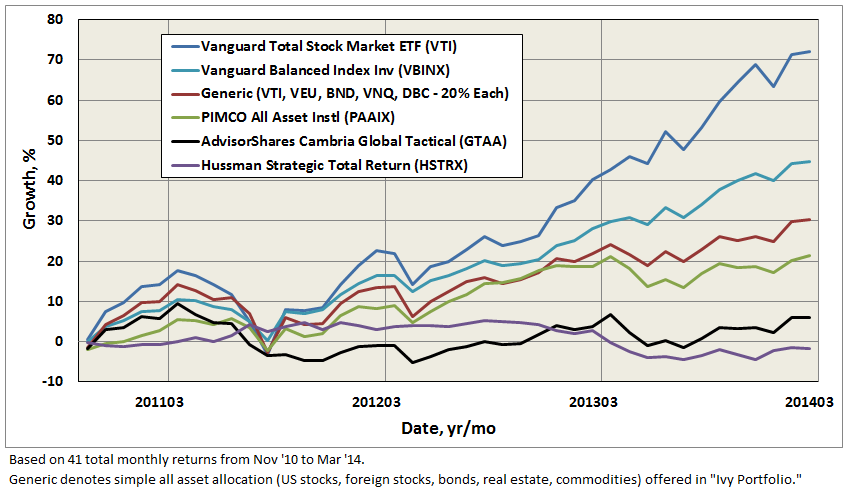
GMOM is based on Mebane’s definitive paper “A Quantitative Approach To Tactical Asset Allocation” and popular book “The Ivy Portfolio: How to Invest Like the Top Endowments and Avoid Bear Markets.” It appears to be an in-house version of AdvisorShares Cambria Global Tactical ETF (GTAA), which Cambria stopped sub-advising this past June. Scott, a frequent and often profound contributor to our discussion board, describes GTAA in one word: “underwhelming.” (You can find follow some of the debate here.) The new version GMOM sports a much lower expense ratio, which can only help. Here is link to fact sheet.

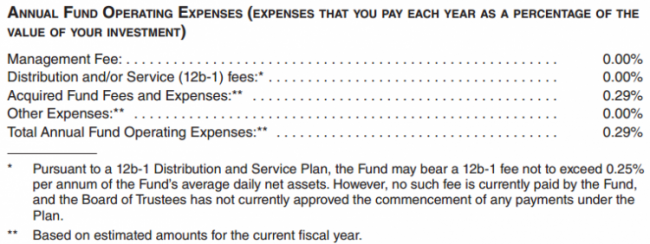
GAA is something pretty cool. It is an all-weather strategic asset allocation fund constructed for global exposure across diverse asset classes, but with lower volatility than your typical long term target allocation fund. It is a “one fund for a lifetime” offering. (See DailyAlts “Meb Faber on the Genesis of Cambria’s Global Tactical ETF.”) It is the first ETF to have a permanent 0% management fee. Its annual expense ratio is 0.29%. From its prospectus:

GAA_1

Here’s is link to fact sheet, and below is snapshot of current holdings:

GAA_2

In keeping with the theme that no good deed goes unpunished. Chuck Jaffe referenced GAA in his annual “Lump of Coal Awards” series. Mr. Jaffe warned “investors should pay attention to the total expense ratio, because that’s what they actually pay to own a fund or ETF.” Apparently, he was irked that the media focused on the zero management fee. We agree that it was pretty silly of reporters, members of Mr. Jaffe’s brotherhood, to focus so narrowly on a single feature of the fund and at the same time celebrate the fact that Mr. Faber’s move lowers the expenses that investors would otherwise bear.

aa_icon
Wesley Gray announced the launch of ValueShares International Quantitative Value ETF (IVAL) on 19 December, his firm’s second active ETF. IVAL is the international sister to ValueShares Quantitative Value ETF (QVAL), which MFO profiled in December. Like QVAL, IVAL seeks the cheapest, highest quality value stocks … within the International domain. These stocks are selected in quant fashion based on value and quality criteria grounded in investing principles first outlined by Ben Graham and validated empirically through academic research.

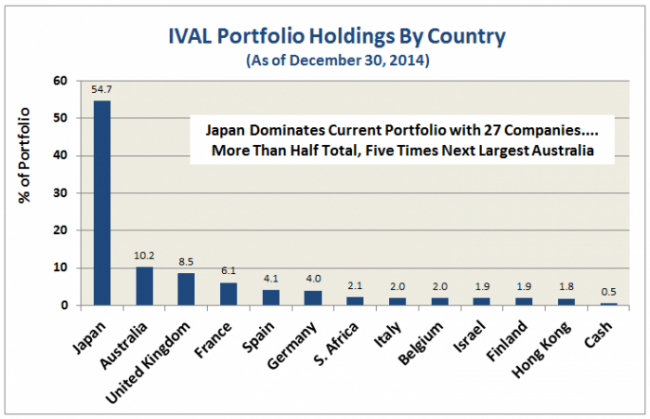
The concentrated portfolio currently invests in 50 companies across 14 countries. Here’s breakout:

IVAL_Portfolio

As with QVAL, there is no sector diversification constraint or, in this case, country constraint. Japan dominates current portfolio. Once candidate stocks pass the capitalization, liquidity, and quality screens, value is king.

Notice too no Russia or Brazil.

Wesley explains: “We only trade in liquid tradeable names where front-running issues are minimized. We also look at the custodian costs. Russia and Brazil are insane on both the custodial costs and the frontrunning risks so we don’t trade ’em. In the end, we’re trading in developed/developing markets. Frontier/emerging don’t meet our criteria.”

Here is link to IVAL overview. Dr. Gray informs us that the new fund’s expense ratio has just been reduced by 20bps to 0.79%.

Where In The World Is Your Fund Adviser?

By Charles Boccadoro

Originally published in January 1, 2015 Commentary
When our esteemed colleague Ed Studzinski shares his views on an adviser or fund house, he invariably mentions location.

I’ve started to take notice.

Any place but Wall Street
Some fund advisers seem to identify themselves with their location. Smead Capital Management, Inc., which manages Smead Value Fund (SMVLX), states: ”Our compass bearings are slightly Northwest of Wall Street…” The firm is headquartered in Seattle.

location_1a

SMVLX is a 5-year Great Owl sporting top quintile performance over the past 5-, 3-, and even 1-year periods (ref. Ratings Definitions):

Bill Smead believes the separation from Wall Street gives his firm an edge.

location_b

Legendary value investor Bruce Berkowitz, founder of Fairholme Capital Management, LLC seems to agree. Fortune reported that he moved the firm from New Jersey to Florida in 2006 in order to … ”put some space between himself and Wall Street … no matter where he went in town, he was in danger of running into know-it-all investors who might pollute his thinking. ’I had to get away,’ he says.”

In 2002, Charles Akre of Akre Capital Management, LLC, located his firm in Middleburg, Virginia. At that time, he was sub-advising Friedman, Billings, Ramsey & Co.’s FBR Focus Fund, an enormously successful fund. The picturesque town is in horse country. Since 2009, the firm’s Akre Focus Fund (AKREX/AKRIX) is a top-quintile performer and another 5-year Great Owl:

location_c

location_d

Perhaps location does matter?

Tales of intrigue and woe
Unfortunately, determining an adviser’s actual work location is not always so apparent. Sometimes it appears downright labyrinthine, if not Byzantine.

Take Advisors Preferred, LLC. Below is a snapshot of the firm’s contact page. There is no physical address. No discernable area code. Yet, it is the named adviser for several funds with assets under management (AUM) totaling half a billion dollars, including Hundredfold Select Alternative (SFHYX) and OnTrack Core Fund (OTRFX).

location_e

Advisors Preferred turns out to be a legal entity that provides services for sub-advisers who actually manage client money without having to hassle with administrative stuff … an “adviser” if you will by name only … an “Adviser for Hire.” To find addresses of the sub-advisers to these funds you must look to the SEC required fund documents, the prospectus or the statement of additional information (SAI).

Hunderdfold Funds is sub-advised by Hunderdfold Funds, LLC, which gives its sub-advisory fees to the Simply Distribute Charitable Foundation. Actually, the charity appears to own the sub-adviser. Who controls the charity? The people that control Spectrum Financial Inc., which is located, alas, in Virginia.

The SAI also reveals that the fund’s statutory trust is not administered by the adviser, Advisors Preferred, but by Gemini Funds Services, LLC. The trust itself is a so-called shared or “series trust” comprised of independent funds. Its name is Northern Lights Fund Trust II. (Ref. SEC summary.) The trust is incorporated in Delaware, like many statutory trusts, while Gemini is headquartered in New York.

Why use a series trust? According to Gemini, it’s cheaper. “Rising business costs along with the increased level of regulatory compliance … have magnified the benefits of joining a shared trust in contrast to the expenses associated with registering a standalone trust.”

How does Hundredfold pass this cost savings on to investors? SFHYX’s latest fact sheet shows a 3.80% expense ratio. This fee is not a one-time load or performance based; it is an annual expense.

OnTrack Funds is sub-advised by Price Capital Management, Inc, which is located in Florida. Per the SEC Filing, it actually is run out of a residence. Its latest fact sheet has the expense ratio for OTRFX at 2.95%, annually. With $130M AUM, this expense translates to $3.85M per year paid by investors the people at Price Capital (sub adviser), Gemini Funds (administrator), Advisors Preferred (adviser), Ceros Financial (distributer), and others.

What about the adviser itself, Advisors Preferred? It’s actually controlled by Ceros Financial Services, LLC, which is headquartered in Maryland. Ceros is wholly-owned by Ceros Holding AG, which is 95% owned by Copiaholding AG, which is wholly-owned by Franz Winklbauer.  Mr. Winklbauer is deemed to indirectly control the adviser. In 2012, Franz Winklbauer resigned as vice president of the administrative board from Ceros Holding AG. Copiaholding AG was formed in Switzerland.

location_f

Which is to say … who are all these people?

Where do they really work?

And, what do they really do?

Maybe these are related questions.

If it’s hard to figure out where advisers work, it’s probably hard to figure out what they actually do for the investors that pay them.

Guilty by affiliation
Further obfuscating adviser physical location is industry trend toward affiliation, if not outright consolidation. Take Affiliated Managers Group, or more specifically AMG Funds LLC, whose main office location is Connecticut, as registered with the SEC. It currently is the named adviser to more than 40 mutual funds with assets under management (AUM) totaling $42B, including:

  • Managers Intermediate Duration Govt (MGIDX), sub advised by Amundi Smith Breeden LLC, located in North Carolina,
  • Yacktman Service (YACKX), sub advised by Yacktman Asset Management, L.P. of Texas, and
  • Brandywine Blue (BLUEX), sub advised by Friess Associates of Delaware, LLC, located in Delaware (fortunately) and Friess Associates LLC, located in Wyoming.

All of these funds are in process of being rebranded with the AMG name. No good deed goes unpunished?

AMG, Inc., the corporation that controls AMG Funds and is headquartered in Massachusetts, has minority or majority ownership in many other asset managers, both in the US and aboard. Below is a snapshot of US firms now “affiliated” with AMG. Note that some are themselves named advisers with multiple sub-advisers, like Aston.

location_g

AMG describes its operation as follows: “While providing our Affiliates with continued operational autonomy, we also help them to leverage the benefits of AMG’s scale in U.S. retail and global product distribution, operations and technology to enhance their growth and capabilities.”

Collectively, AMG boasts more than $600B in AUM. Time will tell whether its affiliates become controlled outright and re-branded, and more importantly, whether such affiliation ultimately benefits investors. It currently showcases full contact information of its affiliates, and affiliates like Aston showcase contact information of its sub-advisers.

Bottom line
Is Bill Smead correct when he claims separation from Wall Street gives his firm an edge? Does location matter to performance? Whether location influences fund performance remains an interesting question, but as part of your due diligence, there should be no confusion about knowing where your fund adviser (and sub-adviser) works.

Alpha Architect US Quantitative Value (QVAL), December 2014

By Charles Boccadoro

At the time of publication, this fund was named ValueShares US Quantitative Value.

Objective and Strategy

The ValueShares US Quantitative Value (QVAL) strategy seeks long-term capital appreciation by investing in a concentrated portfolio of 40 or so US exchange traded stocks of larger capitalizations, which the adviser determines to be undervalued but possess strong economic moats and financial strength. In a nutshell: QVAL buys “the cheapest, highest quality value stocks.”

The fund attempts to actively capture returns in excess of the so-called “value anomaly” or premium, first identified in 1992 by Professors Fama and French. Basically, stocks with lower valuation (and smaller size) deliver greater than excess returns than the overall market. Using valuation and quality metrics based on empirically vetted academic research, the adviser believes QVAL will deliver positive alpha – higher returns than can be explained by the high-book-to-market value factor.

The adviser implements the QVAL strategy in strictly systematic and quant fashion, because it believes that stock picking based on fundamentals, where value managers try to exploit qualitative signals (e.g., Ben Graham’s cigar butts), is fraught with behavioral biases that “lead to predictable underperformance.”

Adviser

Alpha Architect, LLC maintains the QVAL ETF Trust. Empowered Funds, LLC, which does business as Alpha Architect, is the statutory adviser. Alpha Architect is an SEC-registered investment advisor and asset management firm based in Broomall, Pennsylvania. It offers separately managed accounts (SMAs) for high net worth individuals, family offices, and exchange-traded funds (ETFs). It does not manage hedge funds. There are eight full-time employees, all owner/operators. A ninth employee begins 1 January.

Why Broomall, Pennsylvania? The adviser explains it “is the best value in the area–lowest tax, best prices, good access…the entire team lives 5-10 minutes away and we all hate commuting and have a disdain for flash.” It helps too that it’s close to Drexel University Lebow School of Business and University of Pennsylvania Wharton School of Business, since just about everyone on the team has ties to one or both of these schools. But the real reason, according to two of the managing members: “We both have roots in Colorado, but our wives are both from Philadelphia. We each decided to ‘compromise’ with our wives and settled on Philadelphia.”

Currently, the firm manages about $200M. Based on client needs, the firm employs various strategies, including “quantitative value,” which is the basis for QVAL, and robust asset allocation, which employs uncorrelated (or at least less correlated) asset allocation and trend following like that described in The Ivy Portfolio.

QVAL is the firm’s first ETF.  It is a pure-play, long-only, valued-based strategy. Three other ETFs are pending. IVAL, an international complement to QVAL, expected to launch in the next few weeks.  QMOM will be a pure-play, long-only, momentum-based strategy, launching middle of next year. Finally, IMOM, international complement to QMOM.

ValueShares is the brand name of Alpha Architect’s two value-based ETFs. MomentumShares will be the brand name for its two momentum-based ETFs. The adviser thoroughly appreciates the benefits and pitfalls of each strategy, but mutual appreciation is not shared by each investor camp, hence the separate brand names.

With their active ETF offerings, Alpha Architect is challenging the investment industry as detailed in the recent post “The Alpha Architect Proposition.” The adviser believes that:

  • The investment industry today thrives “on complexity and opaqueness to promote high-priced, low-value add products to confuse investors who are overwhelmed by financial decisions.”
  • “…active managers often overcharge for the expected alpha they deliver. Net of fees/costs/taxes, investors are usually better served via low-cost passive allocations.”
  • “Is it essentially impossible to generate genuine alpha in closet-indexing, low-tracking error strategies that will never get an institutional manager fired.”

Its goal is “to disrupt this calculus…to deliver Affordable Active Alpha for those investors who believe that markets aren’t perfectly efficient.”

The table below depicts how the adviser sees current asset management landscape and the opportunity for its new ETFs. Notice that Active Share, Antti Petajisto’s measure of active portfolio management (ref. “How Active Is Your Fund Manager? A New Measure That Predicts Performance”) is a key tenant. David Snowball started including this metric in MFO fund profiles last March.

qval_1v2

Managers

Wesley Gray, John Vogel and Brandon Koepke. 

Dr. Gray is the founder of Alpha Architect. He earned an BA and a PhD in Finance from the University of Chicago, rose to the rank of captain in the US Marine Corps, and was a finance professor at Drexel University. He is the author of Quantitative Value: A Practitioner’s Guide (2016). Dr. Vogel is a Managing Member of Empowered Funds, LLC and Empiritrage, where he heads the research department.  Dr. Vogel earned a Ph.D. in Finance from Drexel University and served as a research assistant there. Mr. Koepke serves as Chief Technology Officer & Portfolio Manager. Drs. Gray and Vogel has managed the fund since inception, Mr. Koepke joined the team in 2020.

Strategy capacity and closure

As structured currently, QVAL has the capacity for about $1B. The adviser has done a lot of research that shows, from a quant perspective, larger scale would come with attendant drop in expected annualized return “~100-150bps, but gives us capacity to $5-10B.”

Active share

74.5. “Active share” measures the degree to which a fund’s portfolio differs from the holdings of its benchmark portfolio, which for QVAL is S&P500 Total Return index.

In response to our inquiry, the adviser provided an Active Share spread-sheet for several value funds. It shows, for example, Dodge & Cox Fund has an Active Share of 68.7.

MFO has tried to collect and maintain this metric for various funds on our Active Share webpage. Antti Petajisto’s website only provides data through 2009. Morningstar holds the current values close. Only a few fund houses (e.g., FPA) publish them on their fact sheets.

So, we were excited to learn that Alpha Architect is building a tool to compute Active Share for all funds using the most current 13F filings.  The tool will be part of its 100% free (but registration required) DIY Investing webpage.

Management’s Stake in the Fund

Neither Dr. Gray nor Dr. Vogel has a recorded investment in the fund. Mr. Koepke has invested between $10,000 – 50,000 in it.

Opening date

October 22, 2014. In its very short history through November 28, 2014, it has quickly amassed $18.4M in AUM.

Minimum investment

QVAL is an ETF, which means it trades like a stock. At market close on November 28, 2014, the share price was $26.13.

Expense ratio

0.39% with AUM of $222.4 million, as of June 2023. There is no 12b-1 fee.

As of October 2014, a review of US long-only, open-ended mutual funds (OEFs) and ETFs across the nine Morningstar domestic categories (small value to large growth) shows just over 2500 unique offerings, including 269 ETFs, but only 19 ETFs not following an index. Average er of these ETFs not following an index is 0.81%. Average er for index-following ETFs is 0.39%. Average er of the OEFs is 1.13%, with sadly about one third of these charging front-loads of nominally 5.5%. (This continuing practice never ceases to disappoint me.) Average er of OEFs across all share classes in this group is 1.25%.

QVAL appears to be just under the average of its “active” ETF peers, in between a couple other notables: Cambria Shareholder Yield ETF (SYLD) at 0.59% and AdvisorShares TrimTabs Float Shrink ETF (TTFS) at 0.99%.

But there is more…

The adviser informs us that there are “NO SOFT DOLLARS” in the QVAL fee structure.

What’s that mean? The SEC defines soft dollars in its 1998 document “Inspection Report on the Soft Dollar Practices of Broker-Dealers, Investment Advisers and Mutual Funds.”

Advisers that use soft dollars agree to pay higher commissions to broker-dealers to execute its trades in exchange for things like Bloomberg terminals and research databases, things that the adviser could choose to pay out of its own pocket, but rarely does. The higher commissions translate to higher transactions fees that are passed onto investors, effectively increasing er through a “hidden” fee.

“Hidden” outside the er, but disclosed in the fine print. To assess whether your fund’s adviser imposes a “soft dollar” fee, look in its SAI under the section typically entitled “Brokerage Selection” or “Portfolio Transactions and Brokerage.” Here’s how the disclosure reads, something like:

To the extent Adviser obtains brokerage and research services from a broker-dealer that it otherwise would acquire at its own expense, Adviser may have an incentive pay higher commissions than would otherwise be the case.

Here’s how the QVAL SAI reads:

Adviser does not currently use soft dollars.

Comments

Among the many great ideas and anecdotes conveyed in the book Quantitative Value, one is about the crash of the B-17 Flying Fortress during a test flight at Wright Air Field in Dayton, Ohio. The year was 1935. The incident took the life of Army Air Corps’ chief test pilot Major Ployer Hill, a very experienced pilot. Initially, people blamed the plane. That must have failed mechanically, or it was simply too difficult to fly. But the investigation concluded “pilot error” caused the accident. “It turned out the Flying Fortress was not ‘too much airplane for one man to fly,’ it was simply too much airplane for one man to fly from memory.”

In response to the incident, the Army Air Corps successfully instituted checklists, which remain intrinsic to all pilot and test pilot procedures today. The authors of Quantitative Value and the adviser of QVAL believe that the strategy becomes the checklist.

The following diagram depicts the five principal steps in the strategy “checklist” the adviser employs to systematically invest in “the cheapest, highest quality value stocks.” A more detailed description of each step is offered in the post “Our Quantitative Value Philosophy,” which is a much abbreviated version of the book.

qval_2

The book culminates with results showing the qualitative value strategy beating S&P500 handily between 1974 through 2011, delivering much higher annualized returns with lower drawdown and volatility. Over the same period, it also bested Joel Greenblatt’s similar Magic Formula strategy made popular in The Little Book That Beats The Market. Finally, between 1991 and 2011, it outperformed three of the top activity managed funds of the period – Sequoia, Legg Mason Value, and Third Avenue Value. Sequoia, one of the greatest funds ever, is the only one that closely competed based on basic risk/reward metrics.

The quantitative value strategy has evolved over the past 12 years. Wesley states that, “barring some miraculous change in human psychology or a ‘eureka’ moment on the R&D side,” it is pretty much set for the foreseeable future.

Before including QVAL in your portfolio, which is based on the strategy outlined in the book, a couple precautions to consider…

First, it is long only, always fully invested, and does not impose an absolute value constraint.  It takes the “cheapest 10%,” so there will always be stocks in its portfolio even if the overall market is rocketing higher, perhaps irrationally higher. It applies no draw down control. It never moves to cash.

While it may use Ben Graham’s distillation of sound investing, known as “margin of safety,” to good effect, if the overall market tanks, QVAL will likely tank too. An investor should therefore allocate to QVAL based on investment timeline and risk tolerance.

More conservative investors could also use the strategy to create a more market neutral portfolio by going long QVAL and dynamically shorting S&P 500 futures – a DIY hedge fund for a lot less than 2/20 and a lot more tax-efficient. “In this structure you get to spread bet between deep value and the market, which has been a good bet historically,” Wesley explains.

Second, it has no sector diversification constraint. So, if an entire sector heads south, like energy has done lately, the QVAL portfolio will likely be heavy the beaten-down sector. Wesley defends this aspect of the strategy: “Sector diversification simply prevents good ideas (i.e., true value investing) from working. We’ve examined this and this is also what everyone else does. And just because everyone else is doing it, doesn’t mean it is a good idea.”

Bottom Line

The just launched ValueShares US Quantitative Value (QVAL) ETF appears to be an efficient, transparent, well formulated, and systematic vehicle to capture the value premium historically delivered by the US market…and maybe more. Its start-up adviser, Alpha Architect, is a well-capitalized firm with minimalist needs, a research-oriented academic culture, and passionate leadership. It is actually encouraging its many SMA customers to move to ETFs, which have inherently lower cost and no minimums.

If the concept of value investing appeals to you (and it should), if you believe that markets are not always efficient and offer opportunities for active strategies to exploit them, and if you are tired of scratching your head trying to understand ad hoc actions of your current portfolio manager while paying high expenses (you really should be), then QVAL should be on your very short list.

Fund website

The team at Alpha Architect pumps a ton of educational content on its website, which includes white papers, DIY investing tools, and its blog.

Fund Information

© Mutual Fund Observer, 2014. All rights reserved. The information here reflects publicly available information current at the time of publication. For reprint/e-rights contact us.

Mediocrity and Frustration

By Charles Boccadoro

Originally published in November 1, 2014 Commentary
I’ve been fully invested in the market for the past 14 years with little to show for it, except frustration and proclamations of even more frustration ahead. During this time, basically since start of 21st century, my portfolio has returned only 3.9% per year, substantially below historical return of the last century, which includes among many other things The Great Depression.

I’ve suffered two monster drawdowns, each halving my balance. I’ve spent 65 months looking at monthly statements showing retractions of at least 20%. And, each time I seem to climb-out, I’m greeted with headlines telling me the next big drop is just around the corner (e.g., “How to Prepare for the Coming Bear Market,” and “Are You Prepared for a Stock Selloff ?“)

I have one Nobel Prize winner telling me the market is still overpriced, seeming every chance he gets. And another telling me that there is nothing I can do about it…that no amount of research will help me improve my portfolio’s performance.

Welcome to US stock market investing in the new century…in the new millennium.

The chart below depicts S&P 500 total return, which includes reinvested dividends, since December 1968, basically during the past 46 years. It uses month-ending returns, so intra-day and intra-month fluctuations are not reflected, as was done in a similar chart presented in Ten Market Cycles. The less frequent perspective discounts, for example, bear sightings from bear markets.

mediocrity_1

The period holds five market cycles, the last still in progress, each cycle comprising a bear and bull market, defined as a 20% move opposite preceding peak or trough, respectively. The last two cycles account for the mediocre annualized returns of 3.9%, across 14-years, or more precisely 169 months through September 2014.

Journalist hyperbole about how “share prices have almost tripled since the March 2009 low” refers to the performance of the current bull market, which indeed accounts for a great 21.9% annualized return over the past 67 months. Somehow this performance gets decoupled from the preceding -51% return of the financial crisis bear. Cycle 4 holds a similar story, only investors had to suffer 40 months of protracted 20% declines during the tech bubble bear before finally eking out a 2% annualized return across its 7-year full cycle.

Despite advances reflected in the current bull run, 14-year annualized returns (plotted against the secondary axis on the chart above) are among the lowest they been for the S&P 500 since September 1944, when returns reflected impacts of The Great Depression and World War II.

Makes you wonder why anybody invests in the stock market.

I suspect all one needs to do is see the significant potential for upside, as witnessed in Cycles 2-3. Our current bull pales in comparison to the truly remarkable advances of the two bull runs of 1970-80s and 1990s. An investment of $10,000 in October 1974, the trough of 1973-74, resulted in a balance of $610,017 by August 2000 – a 6000% return, or 17.2% for nearly 26 years, which includes the brief bear of 1987 and its coincident Black Monday.

Here’s a summary of results presented in the above graph, showing the dramatic differences between the two great bull markets at the end of the last century with the first two of the new century, so far:

mediocrity_2

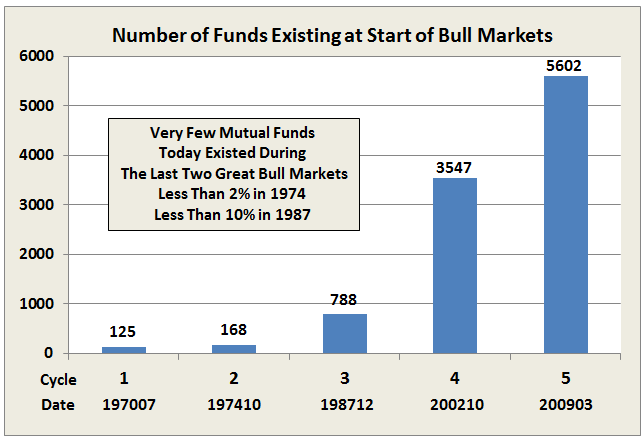
But how many funds were around to take advantage 40 years ago? Answer: Not many. Here’s a count of today’s funds that also existed at the start of the last five bull markets:

mediocrity_3

Makes you wonder whether the current mediocrity is simply due to too many people and perhaps too much money chasing too few good ideas?

The long-term annualized absolute return for the S&P 500 is 10%, dating back to January 1926 through September 2014, about 89 years (using database derived from Goyal and Shiller websites). But the position held currently by many value oriented investors, money-managers, and CAPE Crusaders is that we will have to suffer mediocre returns for the foreseeable future…at some level to make-up for excessive valuations at the end of the last century. Paying it seems for sins of our fathers.

Of course, high valuation isn’t the only concern expressed about the US stock market. Others believe that the economy will face significant headwinds, making it hard to repeat higher market returns of years past. Rob Arnott describes the “3-D Hurricane Force Headwind” caused by waves of Deficit spending, which artificially props-up GDP, higher than published Debt, and aging Demographics.

Expectations for US stocks for the next ten years is very low, as depicted in the new risk and return tool on Research Affiliates’ website (thanks to Meb Faber for heads-up here). Forecast for large US equities? Just 0.7% total return per year. And small caps? Zero.

Good grief.

What about bonds?

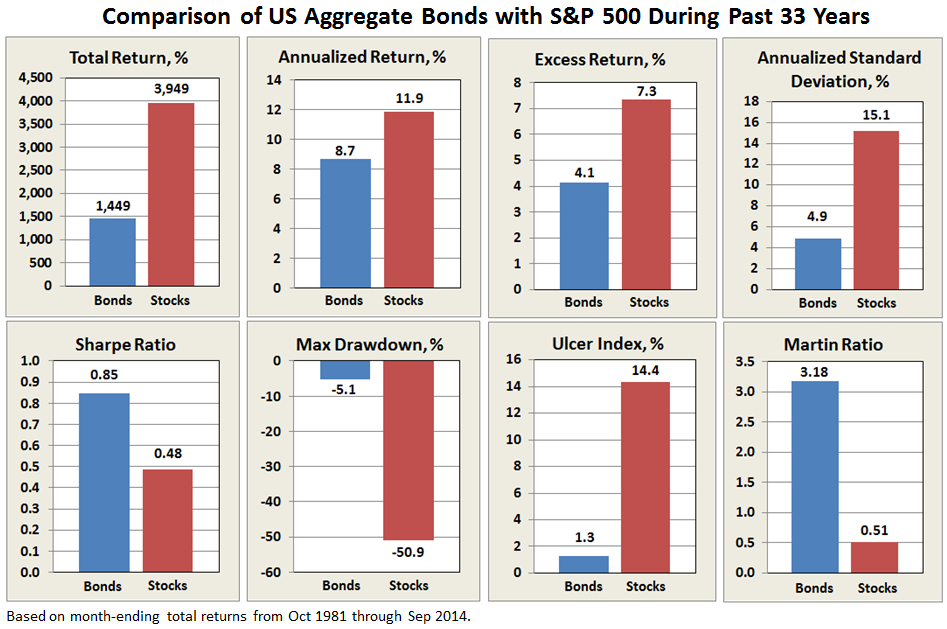
Plotted also on the first chart above is 10-year average T-Bill interest rate. While it has trended down since the early 1980’s, if there is a correlation between it and stock performance, it is not obvious. What is obvious is that since interest rates peaked in 1981, US aggregate bonds have been hands-down superior to US stocks for healthy, stable, risk-adjusted returns, as summarized below:

mediocrity_4

Sure, stocks still triumphed on absolute return, but who would not take 8.7% annually with such low volatility? Based on comparisons of absolute return and Ulcer Index, bonds returned more than 70% of the gain with just 10% of the pain.

With underlining factors like 33 years of declining interest rates, it is no wonder that bond funds proliferated during this period and perhaps why some conservative allocation funds, like the MFO Great Owl and Morningstar Gold Metal Vanguard Wellesley Income Fund (VWINX), performed so well. But will they be as attractive the next 33 years, or when interest rates rise?

As Morningstar’s Kevin McDevitt points out in his assessment of VWINX, “the fund lagged its average peer…from July 1, 1970, through July 1, 1980, a period of generally rising interest rates.” That said, it still captured 85% of the S&P500 return over that period and 76% during the Cycle 2 bull market from October 1974 through August 1987.

Of course, predicting interest rates will rise and interest rates actually rising are two different animals, as evidenced in bond returns YTD. In fact, our colleague Ed Studzinski recently pointed out the long term bonds have done exceptionally well this year (e.g., Vanguard Extended Duration Treasury ETF up 26.3% through September). Who would have figured?

I’m reminded of the pop quiz Greg Ip presents in his opening chapter of “Little Book of Economics”: The year is 1990. Which of the following countries has the brighter future…Japan or US? In 1990, many economists and investors picked Japan. Accurately predicting macroeconomics it seems is very hard to do. Some say it is simply not possible.

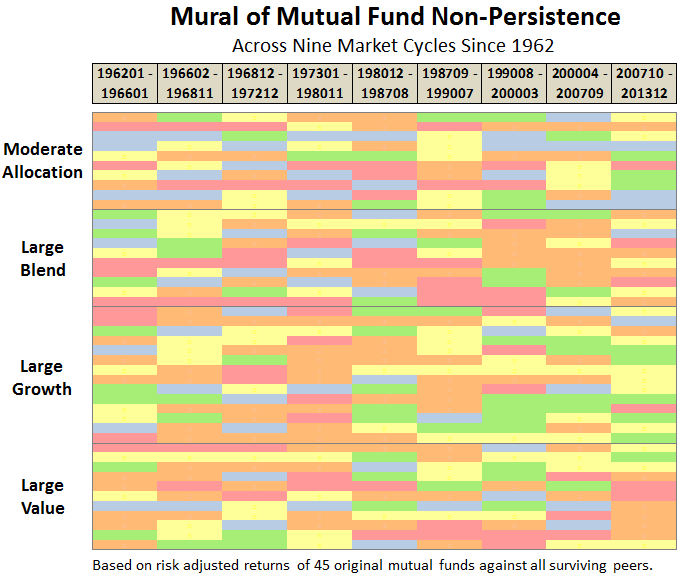
Similarly, the difficulty mutual funds have to consistently achieve top-quintile performance, either across fixed time periods or market cycles, or using absolute or risk-adjusted measures, is well documented (e.g., The Persistence Scorecard – June 2014, Persistence is a Killer, In Search of Persistence, and Ten Market Cycles). It does not happen. Due to the many underlying technical and psychological variables of the market place, if not the shear randomness of events.

In his great book “The Most Important Thing,” Howard Marks describes the skillful defensive investor as someone who does not lose much when the market goes down, but gains a fair amount when the market goes up. But this too appears very hard to do consistently.

Vanguard’s Convertible Securities Fund (VCVSX), sub-advised by OakTree Capital Management, appears to exhibit this quality to some degree, typically capturing 70-100% of upside with 70-80% of downside across the last three market cycles.

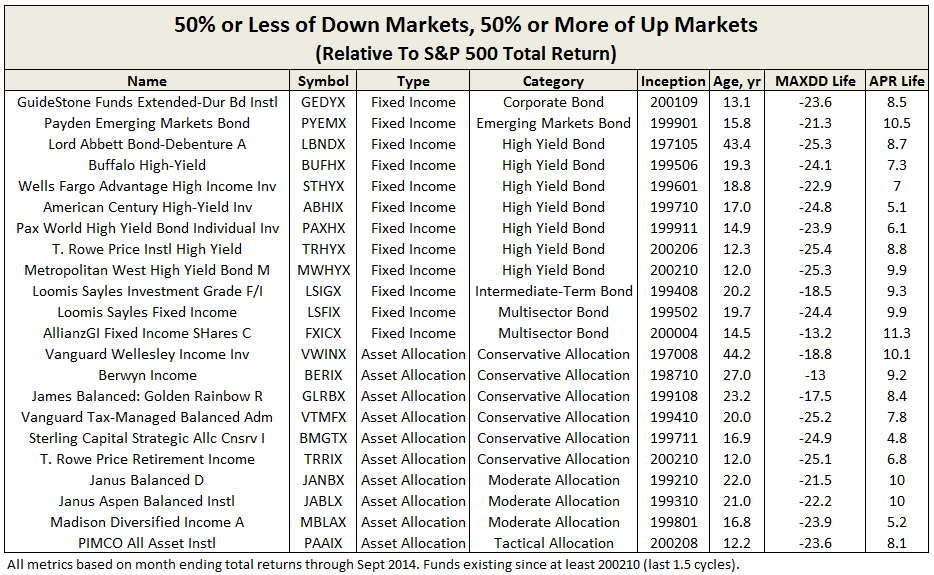
Since bull markets tend to last much longer than bear markets and produce returns well above the average, capturing a “fair amount” does not need to be that high. Examining funds that have been around for at least 1.5 cycles (since October 2002, oldest share class only), the following delivered 50% or more total return during bull markets, while limiting drawdowns to 50% during bear markets, each relative to S&P 500. Given the 3500 funds evaluated, the final list is pretty short.

mediocrity_5

VWINX is the oldest, along with Lord Abbett Bond-Debenture Fund (LBNDX). Both achieved this result across the last four full cycles. As a check against performance exceeding the 50% threshold during out-of-cycle or partial-cycle periods, all funds on this list achieved the same result over their lifetimes.

For moderately conservative investors, these funds have not been mediocre or frustrating at all, quite the contrary. For those with an appetite for higher returns and possess the attendant temperament and investing horizon, here is a link to similar funds with higher thresholds: MFO Pain-To-Gain Funds.

We can only hope to have it so good going forward.

Morningstar ETF Conference Notes

By Charles Boccadoro

Originally published in October 1, 2014 Commentary

MStar_Conf_1

The pre-autumnal weather was perfect. Blue skies. Warm days. Cool nights. Vibrant city scene. New construction. Breath-taking architecture. Diverse eateries, like Lou Malnati’s deep dish pizza. Stylist bars and coffee shops. Colorful flower boxes on The River Walk. Shopping galore. An enlightened public metro system that enables you to arrival at O’Hare and 45 minutes later be at Clark/Lake in the heart of downtown. If you have not visited The Windy City since say when the Sears Tower was renamed the Willis Tower, you owe yourself a walk down The Magnificent Mile.

MStar_Conf_2

At the opening keynote, Ben Johnson, Morningstar’s director responsible for coverage of exchange traded funds (ETFs) and conference host, noted that ETFs today hold $1.9T in assets versus just $700M only five years ago, during the first such conference. He explained that 72% is new money, not just appreciation.

The conference had a total of 671 attendees, including 470 registered attendees (mostly financial advisors, but this number also includes PR people and individual attendees), 123 sponsor attendees, 43 speakers, and 35 journalists, but not counting a very helpful M* staff and walk-ins. Five years ago? Just shy of 300 attendees.


The Dirty Words of Finance

AQR’s Ronen Israel spoke of Style Premia, which refers to source of compelling returns generated by certain investment vehicle styles, specifically Value, Momentum, Carry (the tendency for higher-yielding assets to provide higher returns than lower-yielding assets), and Defensive (the tendency for lower-risk and higher-quality assets to generate higher risk-adjusted returns). He argues that these excess returns are backed by both theory, be it efficient market or behavioral science, and “decades of data across geographies and asset groups.”

He presented further data that indicate these four styles have historically had low correlation. He believes that by constructing a portfolio using these styles across multiple asset classes investors will yield more consistent returns versus say the tradition 60/40 stocks/bond balanced portfolio. Add in LSD, which stands for leverage, shorting and derivatives, or what Mr. Israel jokingly calls “the dirty word of finance,” and you have the basic recipe for one of AQR’s newest fund offerings: Style Premia Alternative (QSPNX). The fund seeks long-term absolute (positive) returns.

Shorting is used to neutralize market risk, while exposing the Style Premia. Leverage is used to amplify absolute returns at defined portfolio volatility. Derivatives provide most efficient vehicles for exposure to alternative classes, like interest rates, currencies, and commodities.

When asked if using LSD flirted with disaster, Mr. Israel answered it could be managed, alluding to drawdown controls, liquidity, and transparency.

(My own experience with a somewhat similar strategy at AQR, known as Risk Parity, proved to be highly correlated and anything but transparent. When bonds, commodities, and EM equities sank rapidly from May through June 2013, AQR’s strategy sank with them. Its risk parity flagship AQRNX drew down 18.1% in 31 trading days…and the fund house stopped publishing its monthly commentary.)

When asked about the size style, he explained that their research showed size not to be that robust, unless you factored in liquidity and quality, alluding to a future paper called “Size Matters If You Control Your Junk.”

When asked if his presentation was available on-line or in-print, he answered no. His good paper “Understanding Style Premia” was available in the media room and is available at Institutional Investor Journals, registration required.

Launched in October 2013, the young fund has generated nearly $300M in AUM while slightly underperforming Vanguard’s Balanced Index Fund VBINX, but outperforming the rather diverse multi-alternative category.

QSPNX er is 2.36% after waivers and 1.75% after cap (through April 2015). Like all AQR funds, it carries high minimums and caters to the exclusivity of institutional investors and advisors, which strikes me as being shareholder unfriendly. Today, AQR offers 27 funds, 17 launched in the past three years. They offer no ETFs.

MStar_Conf_3


In The Shadow of Giants

PIMCO’s Jerome Schneider took over the short-term and funding desk from legendary Paul McCulley in 2010. Two years before, he was at Bear Stearns. Today, think popular active ETF MINT. Think PAIUX.

During his briefing, he touched on 2% being real expected growth rate. Of new liquidly requirements for money market funds, which could bring potential for redemption gates and fees, providing more motivation to look at low duration bonds as an alternative to cash. He spoke of 14 year old cars that needed to be replaced and expected US housing recovery.

He anticipates capital expenditure will continue to improve, people will get wealthier, and for US to provide a better investment outlook than rest of world, which was a somewhat contrarian view at the conference. He mentioned global debt overhang, mostly in the public sector. Of working age population declining. And, of geopolitical instability. He believes bonds still play a role in one’s portfolio, because historically they have drawn down much less than equities.

It was all rather disjointed.

Mostly, he talked about the extraordinary culture of active management at PIMCO. With time tested investment practices. Liquidity sensitivity. Risk management. Credit research capability, including 45 analysts across the globe that he begins calling at 03:45…the start of his work day. He touted PIMCO’s understanding of tools of the trade and trading acumen. “Even Bill Gross still trades.” He displayed a picture of himself that folks often mistook for a young Paul McCulley.

Cannot help but think what an awkward time it must be for the good folks at PIMCO. And be reminded of another giant’s quote: “Only when the tide goes out do you discover who’s been swimming naked.”


MStar_Conf_4
Youthful Hosts

Surely, it is my own graying hair, wrinkled bags, muddled thought processes, and inarticulate mannerisms that makes me notice something extraordinary about the people hosting and leading the conference’s many panels, workshops, luncheons, keynotes, receptions, and sidebars. They all look very young! In addition to being clear thinkers, articulate public speakers, helpful and gracious hosts.

It would not be too much of a stretch to say that the combined ages of M*’s Ben Johnson, Ling-Wei Hew, and Samuel Lee together add up to one Eugene Fama.  Indeed, when Mr. Johnson sat across from Nobel laureate Professor Fama, during a charming lunch time keynote/interview, he could have easily been an undergraduate from University of Chicago.

Is it because the ETF industry itself is young? Or, is it as a colleague explains: “Morningstar has hard time holding on to good talent because it is a stepping stone to higher paying jobs at places like BlackRock.”

Whatever the reason, if we were all as knowledgeable about investing as Mr. Lee and the rest of the youthful staff, the world of investing would be a much better place.


Damp & Disappointing

That’s how JP Morgan’s Dr. David Kelly, Chief Global Strategist, describes our current recovery. While I did not agree with everything, it was hands-down the best talk of the conference. At one point he said that he wished he could speak for another hour. I wished he could have too.

“Damp and disappointing, like an Irish summer,” he explained.

Short term US prospects are good, but long term not good. “In the short run, it’s all about demand. But in the long run, it’s all about supply, which will be adversely impacted by labor and productivity.” The labor force is not growing. Baby boomers are retiring en masse. He also showed data that productivity was likely not growing, blaming lack of capital expenditure. (Hard to believe since we seem to work 24/7 these days thanks to amazing improvements communications, computing, information access, manufacturing technology, etc. All the while, living longer.)

Dr. Kelly offered up fixes: 1) corporate tax reform, including 10% flat rate, and 2) immigration reform, that allows the world’s best, brightest, and hardest working continued entry to the US. But since congress only acts in crisis, he concedes his forecast prepares for slowing US growth longer term.

Greater opportunity for long term growth is overseas. Manufacturing momentum is gaining around world. Cyclical growth will be higher than US while valuations remain lower and work force is younger. Simply put, they have more room to grow. Unfortunately, US media bias “always gives impression that the rest of the world is in flames…it shows only bad news.”

JP Morgan remains underweight fixed income, since monetary policy remains abnormal, and cautiously over weight US equities. The thing about Irish summers is…everything is green. Low interest rates. Higher corporate margins. Normal valuation. Although he takes issue with the phrase “All the easy money has been made in equities.” He asks “When was it ever easy?”

MStar_Conf_5


Alpha Architect

Dr. Wesley Gray is a former US Marine Captain, a former assistant and now adjunct professor at Drexel University, co-author of Quantitative Value: A Practitioner’s Guide to Automating Intelligent Investment and Eliminating Behavioral Errors, and founder of AlphaArchitect, LLC.

He earned his MBA and Finance PhD from University of Chicago, where Professor Fama was on his doctoral committee. He offers a fresh perspective in the investment community. Straight talking and no holds barred. My first impression – a kind of amped-up, in-your-face Mebane Faber. (They are friends.)

In fact, he starts his presentation with an overview of Mr. Faber’s book “The Ivy Portfolio,” which at its simplest form represents an equal allocation strategy across multiple and somewhat uncorrelated investment vehicles, like US stocks, world stocks, bonds, REITS, and commodities.

Dr. Gray argues that simple, equal allocation remains tough to beat. No model works all the time; in fact, the simple equal allocation strategy has under-performed the past four years, but precisely because forces driving markets are unstable, the strategy will reward investors with satisfactory returns over the long run. “Complexity does not add value.”

He seems equally comfortable talking efficient market theory and how to maximize a portfolio’s Sharpe ratio as he does explaining why the phycology of dynamic loss aversion creates opportunities in the market.

When Professor Fama earlier in the day dismissed a question about trend-following, answering “No evidence that this works,” Dr. Gray wished he would have asked about the so-called “Prime anomaly…momentum. Momentum is pervasive.”

When Dr. Gray was asked, “Will your presentation would be made available on-line?” He answered “Absolutely.” Here is link to Beware of Geeks Bearing Formulas.

His firm’s web site is interesting, including a new tools page, free with an easy registration. They launch their first ETF aptly called Alpha Architect’s Quantitative Value (QVAL) on 20 October, which will follow the strategy outlined in the book. Basically, buy cheap high-quality stocks that Wall Street hates using systematic decision making in a transparent fashion. Definitively a candidate MFO fund profile.


Trends Shaping The ETF Market

Ben Johnson hosted an excellent overview ETF trends. The overall briefings included Strategic Beta, Active ETFs (like BOND and MINT), and ETF Managed Portfolios.

Points made by Mr. Johnson:

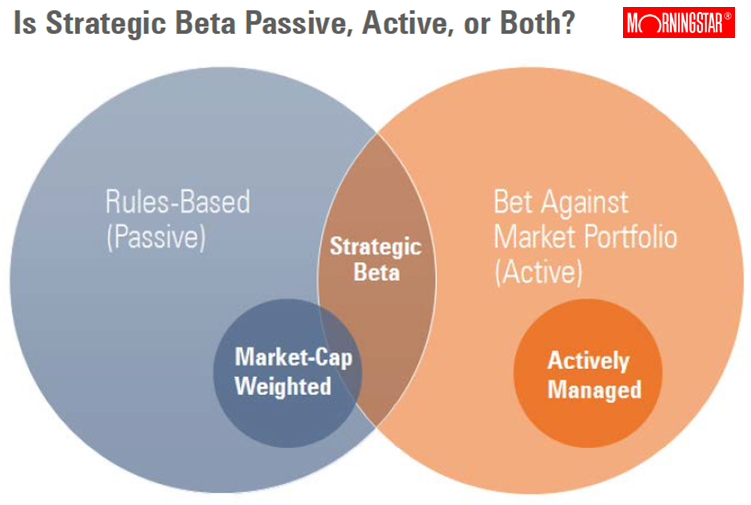
1. Active vs passive is a false premise. Today’s ETFs represent a cross-section of both approaches.

2. “More assets are flowing into passive investment vehicles that are increasingly active in their nature and implementation.”

3. Smart beta is a loaded term. “They will not look smart all the time” and investors need to set expectations accordingly.

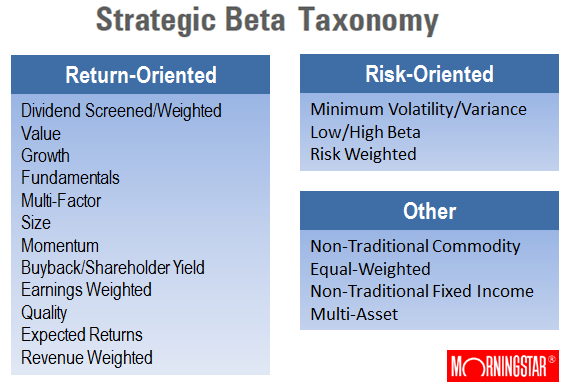
4. M* assigns the term “Strategic Beta” to a growing category of indexes and exchange traded products (ETPs) that track them. “These indexes seek to enhance returns or minimize risk relative to traditional market cap weighted benchmarks.” They often have tilts, like low volatility value, and are consistently rules-based, transparent, and relatively low-cost.

MStar_Conf_6

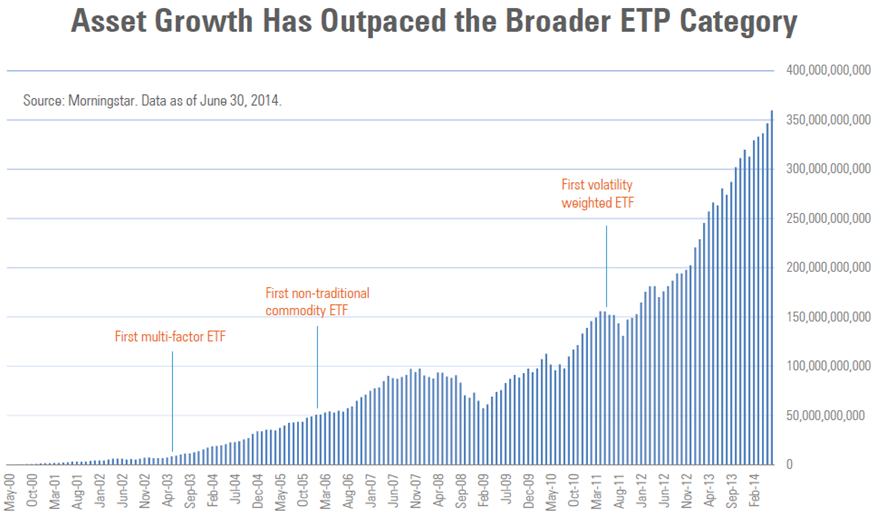
5. Strategic Beta subset of ETPs has been explosive in recent years with 374 listed in US as of 2Q14 or 1/4 of all ETPs, while amassing $360M, or 1/5th of ETP AUM. Perhaps more telling is that 31% of new cash flows for ETPs in 2013 went into Strategic Beta products.

MStar_Conf_7

6. Reduction or fees and a general disillusionment with active managers are two of several reasons behind the growth in these ETFs.  These quasi active funds charge a fraction of traditional fees. A disillusionment with active managers is evidenced in recent surveys made by Northern Trust and PowerShares.

M* is attempting to bring more neutral attention to these ETFs, which up to now has been driven by product providers. In doing so, M* hopes to help set expectation management, or ground rules if you will, to better compare these investment alternatives. With ground rules set, they seek to highlight winners and call out losers. And, at the end of the day, help investors “navigate this increasingly complex landscape.”

They’ve started to develop the following taxonomy that is complementary to (but not in place of) existing M* categories.

MStar_Conf_8

Honestly, I think their coverage of this area is M* at its best.


Welcomed Moderation

Mr. Koesterich gave the conference opening keynote. He is chief investment strategist for BlackRock. The briefing room was packed. Several hundred people. Many standing along wall. The reception afterward was just madness. His briefing was entitled “2014 Mid-Year Update – What to Know / What to Do.”

He threaded a somewhat cautiously reassuring middle ground. Things aren’t great. But, they aren’t terrible either. They are just different. Different, perhaps, because the fed experiment is untested. No one really knows how QE will turn out. But in mean time, it’s keeping things together.

Different, perhaps, because this is first time in 30-some years where investors are facing a rising interest rate environment. Not expected to be rapid. But rather certain. So bonds no longer seem as safe and certainly not as high yield as in recent decades.

To get to the punch-line, his advice is: 1) rethink bonds – seek adaptive strategies, look to EM, switch to terms less interest rate sensitive, like HY, avoiding 2-5 year maturities, look into muni’s on taxable accounts, 2) generate income, but don’t overreach – look for flexible approaches, proxies to HY, like dividend equities, and 3) seek growth, but manage volatility – diversify to unconstrained strategies

More generally, he thinks we are in a cyclical upswing, but slower than normal. Does not expect US to achieve 3.5% annual GDP growth (post WWII normal) for next decade. Reasons: high debt, aging demographics, and wage stagnation (similar to Rob Arnott’s 3D cautions).

He cited stats that non-financial debt has actually increased 20-30%, not decreased, since financial crisis. US population growth last year was zero. Overall wages, adjusted for inflation, same as late ’90s. But for men, same as mid ‘70s. (The latter wage impact has been masked by more credit availability, more women working, and lower savings.) All indicative of slower growth in US for foreseeable future, despite increases in productivity.

Lack of volatility is due to fed, keeping interest rates low, and high liquidity. Expects volatility to increase next year as rates start to rise. He believes that lower interest rates so far is one of year’s biggest surprises. Explains it due to pension funds shifting out of equities and into bonds and that US 10 year is pretty good relative to Japan and Europe.

On inflation, he believes tech and aging demographics tend to keep inflation in check.

BlackRock continues to like large cap over small cap. Latter will be more sensitive to interest rate increases.

Anything cheap? Stocks remain cheaper than bonds, because of extensive fed purchases during QE. Nothing cheap on absolute basis, only on relative basis. “All asset classes above long term averages, except a couple niche areas.”

“Should we all move to cash?” Mr. Koesterich answers no. Just moderate our expectations going forward. Equities are perhaps 10-15% above long term averages. But not expensive compared to prices before previous drops.

One reason is company margins remain high. For couple of same reasons: low credit interest and low wages. Plus higher productivity, which later appeared contrary to JP Morgan’s perspective.

He advises investors be selective in equities. Look for value. Like large over small. More cyclical companies. He likes tech, energy, manufacturing, financials going forward. This past year, folks have driven up valuations of “safe” equities like utilities, staples, REITS. But those investments tend to work well in recessions…not so much in rising interest rate environment. EM relatively inexpensive, but fears they are cheap for reason. Lots of divided arguments here at BlackRock. Japan likely good trade for next couple years due to Japanese pension funds shifting to organic assets.

He closed by stating that only New Zealand is offering a 10 year sovereign return above 4%. Which means, bond holders must take on higher risk. He suggests three places to look: HY, EM, muni’s.

Again, a moderate presentation and perhaps not much new here. While I personally remain more cautiously optimistic about US economy, compared to mounting predictions of another big pull-back, it was a welcomed perspective.

MStar_Conf_9


Beta Central

I’m hard-pressed to think of someone who has done more to enlighten investors about the benefits of ETF vehicles and opportunities beyond buy-and-hold US market cap than Mebane Faber. At this conference especially, he represents a central figure helping shape investment opportunities and strategies today.

He was kind enough to spend a few minutes before his panel on dividend investing and ETFs, which he held with Morningstar’s Josh Peters and Samuel Lee.

He shared that Cambria recently completed a funding campaign to expand its internal operations using the increasingly popular “Crowd Funding” approach. They did not use one of the established shops, like EquityNet, simply because of cost.  A couple hundred “accredited investors” quickly responded to Cambria’s request to raise $1-2M. The investors now have a private stake in the company. Mebane says they plan to use the funds to increase staff, both research and marketing. Indeed, he’s hiring: “If you are an A+ candidate, incredibly sharp, gritty, and super hungry, come join us!”

The new ETF Global Momentum (GMOM), which we mentioned in the July commentary, is due out soon, he thinks this month. Several others are in pipeline: Global Income and Currency Strategies ETF (FXFX), Emerging Shareholder Yield ETF (EYLD), Sovereign High Yield Bond ETF (SOVB), and Value and Momentum ETF (VAMO), which will make for a total of eight Cambria ETFs. The initial three ETFs (SYLD, FYLD, and GVAL) have attracted $365M in their young lives.

He admitted being surprised that Mark Yusko of Morgan Creek Funds agreed to take over AdvisorShares Global Tactical ETF GTAA, which now has just $20M AUM.

He was also surprised and disappointed to read about the SEC’s probe in F2 Investments, which alleges overstated performance results. F2 specializes in strategies “designed to protect investors from severe losses in down markets while providing quality participation in rising markets” and they sub-advise several Virtus ETFs. When WSJ reported that F2 received a so-called Wells notice, which portends a civil case against the company, Mebane posted “first requirement for anyone allocating to separate account investment advisor – GIPS audit. None? Move on.” I asked, “What’s GIPS?” He explains it stands for Global Investment Performance Standards and was created by the CFA Institute.

Mebane continues to write, has three books in work, including one on top hedge funds. Speaking of insight into hedge funds, subscribers joining his The Idea Farm after 31 December will pay a much elevated $499 annually.

Why Am I Rebalancing?

By Charles Boccadoro

Originally published in September 1, 2014 Commentary

Long-time MFO discussion board member AKAFlack emailed me recently wondering how much investors have underperformed during the current bull market due to the practice of rebalancing their portfolios.

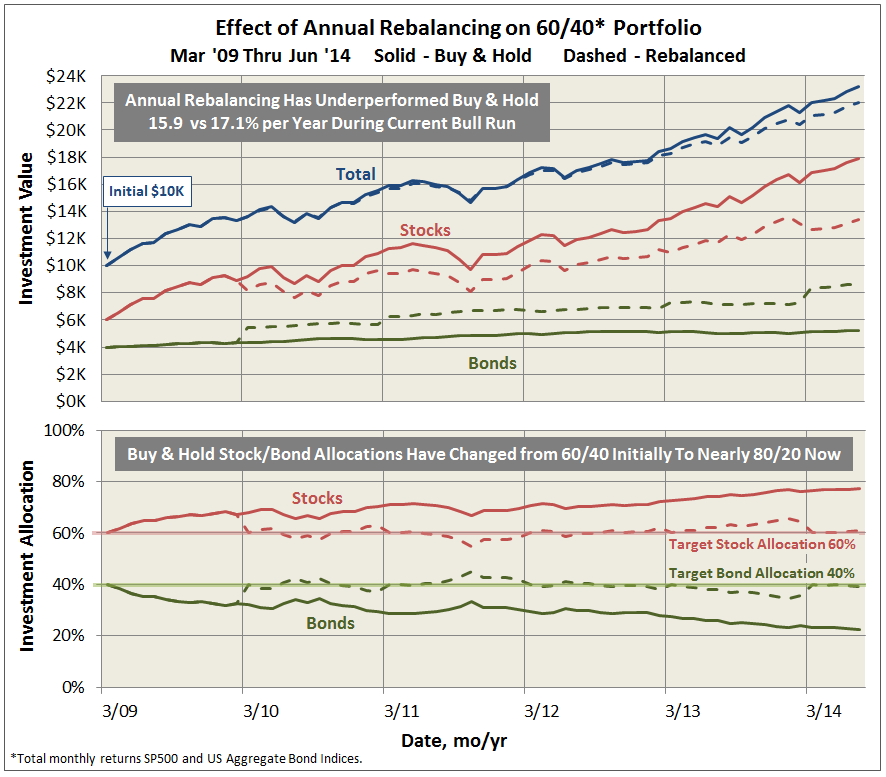
For those that rebalance annually, the answer is…almost 12% in total return from March 2009 through June 2014. Not huge given the healthy gains, but certainly noticeable. The graph below compares performance for a buy & hold and an annually rebalanced portfolio, assuming an initial investment of $10,000 allocated 60% to stocks and 40% to bonds.

rebalancing_1

So why rebalance?

According to a good study by Vanguard, entitled “Best practices for portfolio rebalancing,” the answer is not to maximize return. “If the sole objective is to maximize return regardless of risk, then the investor should select a 100% equity portfolio.”

The purpose of rebalancing, whether done periodically or by threshold deviation, is to keep a portfolio risk composition consistent with an investor’s tolerance, as defined by their target allocation. Otherwise, investors “can end up with a portfolio that is over-weighted to equities and therefore more vulnerable to equity-market corrections, putting the investors’ portfolios at risk of larger losses compared with their target portfolios.” This situation is evidenced in the allocation shown above for the buy & hold portfolio, which is now at nearly 80/20 stocks/bonds.

In this way, rebalancing is one way to keep loss aversion in check and the attendant consequences of selling and buying at all the wrong times, often chronicled in Morningstar’s notorious “Investor Return” tracking metric.

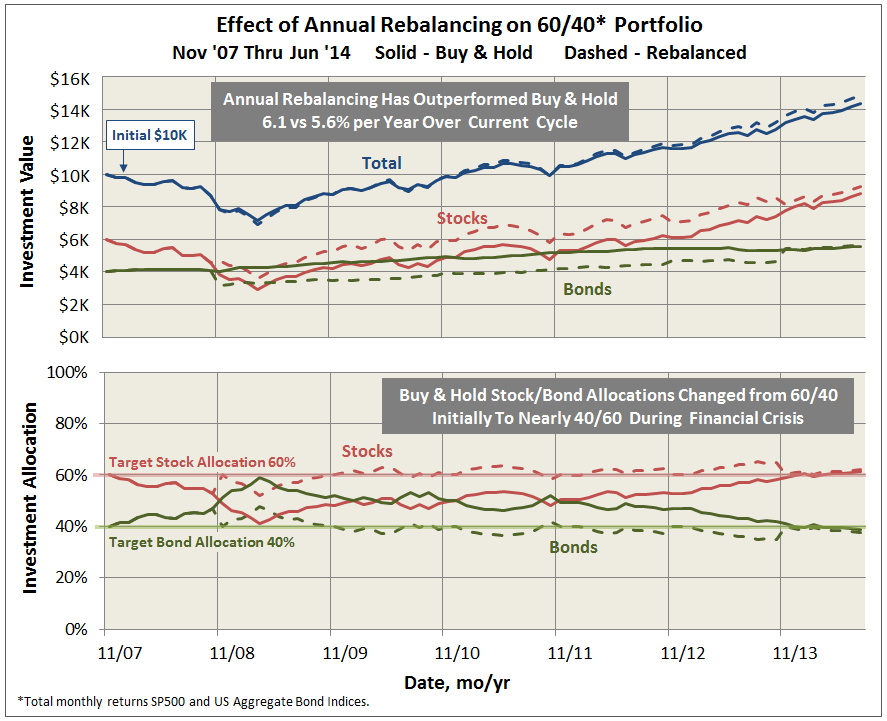
Balancing makes up ground, however, when equities are temporarily undervalued, like was the case in 2008. The same comparison as above but now across the most current full market cycle, beginning in November 2007, shows that annual balancing actually slighted outperformed the buy & hold portfolio.

rebalancing_2

In his book “The Ivy Portfolio,” Mebane Faber presents additional data to support that “there is a clear advantage to rebalancing sometime rather than letting the portfolio drift. A simple rebalance can add 0.1 to 0.2 to the Sharpe Ratio.”

If your first investment priority is risk management, occasional rebalancing to your target allocation is one way to help you sleep better at night, even if it means underperforming somewhat during bull markets.

Recovery Time

By Charles Boccadoro

Originally published in August 1, 2014 Commentary

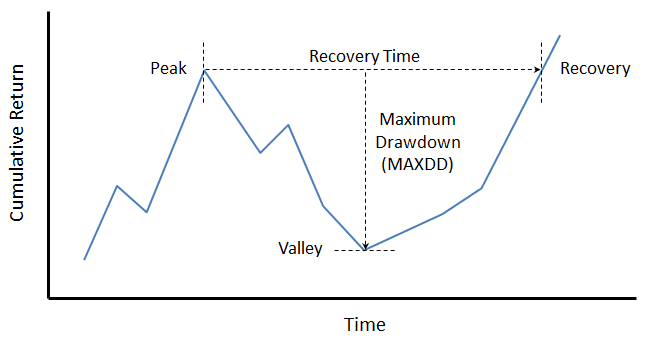
In the book “Practical Risk-Adjusted Performance Measurement,” Carl Bacon defines recovery time or drawdown duration as the time taken to recover from an individual or maximum drawdown to the original level. In the case of maximum drawdown (MAXDD), the figure below depicts recovery time from peak. Typically, for equity funds at least, the descent from peak to valley happens more quickly than the ascent from valley to recovery level.

maxdur1

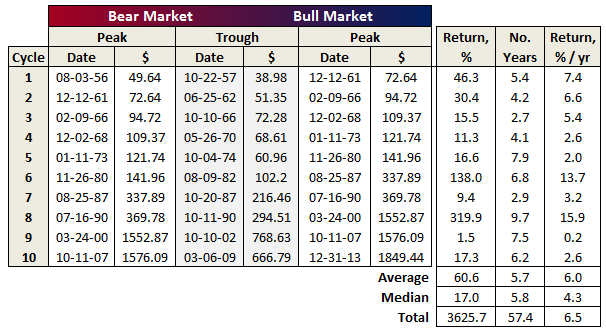
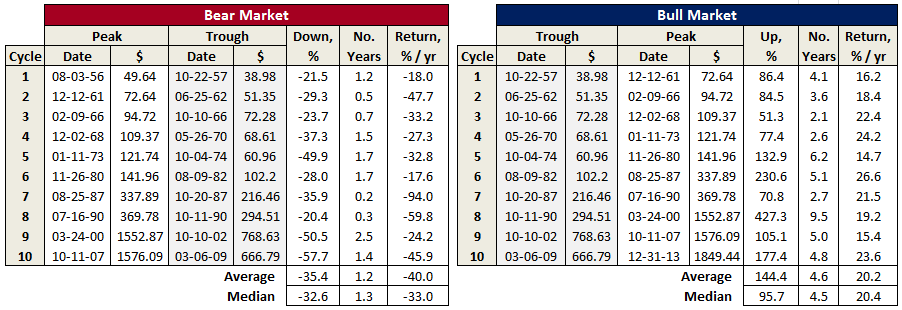
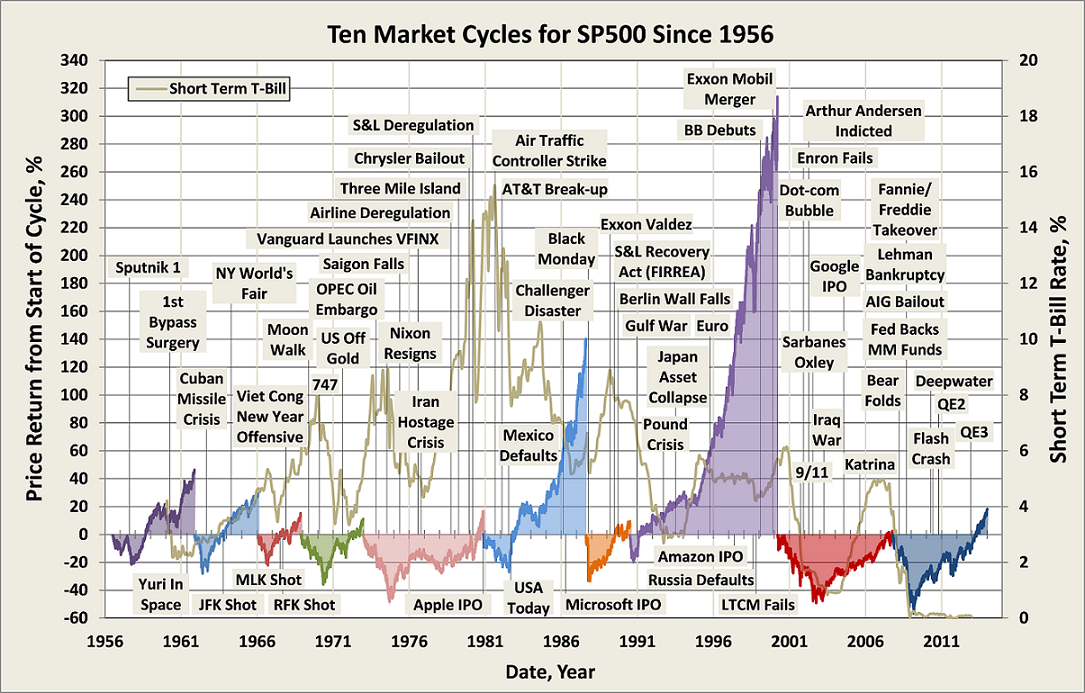
An individual’s risk tolerance and investment timeline certainly factor into expectations of maximum drawdown and recovery time. As evidenced in “Ten Market Cycles” from our April commentary, 20% drawdowns are quite common. Since 1956, the SP500 has fallen nearly 30% or more eight times. And, three times – a gut wrenching 50%. Morningstar advises that investors in equity funds need “investment horizons longer than 10 years.”

Since 1962, SP500’s worst recovery time is actually a modest 53 months. Perhaps more surprising is that aggregate bonds experienced a similar duration, before the long bull run.  The difference, however, is in the drawdown level itself.

maxdur2

 During the past 20 years, bonds have recovered much more quickly, even after the financial crisis.

maxdur3

Long time MFO board contributor Bee posted recently:

MAXDD or Maximum Drawdown is to me only half of the story.

Markets move up and down. Typically the more aggressive the fund the more likely it is to have a higher MAXDD. I get that. What I find “knocks me out of a fund” in a down market is the fund’s inability to bounce back.

Ulcer Index, as defined by Peter Martin and central to MFO’s ratings system, does capture both the MAXDD and recovery time, but like most indices, it is most easily interpreted when comparing funds over same time period. Shorter recovery times will have lower UIcer Index, even if they experience the same absolute MAXDD. Similarly, the attendant risk-adjusted-return measure Martin Ratio, which is excess return divided by Ulcer Index, will show higher levels.

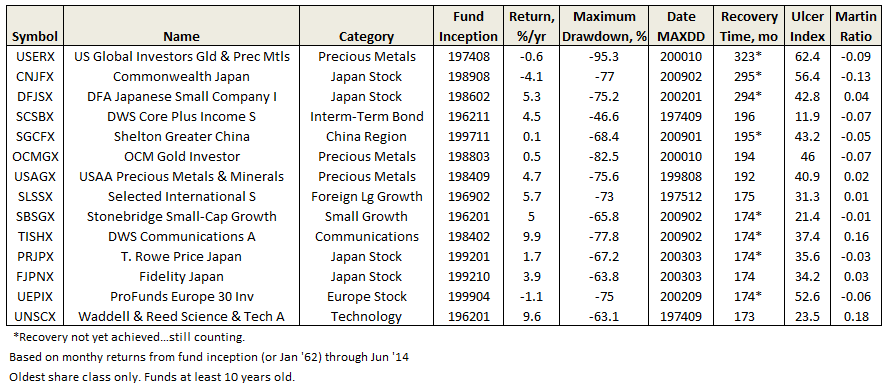
But nothing hits home quite like maximum drawdown and recovery time, whose absolute levels are easily understood. A review of lifetime MAXDD and recoveries reveals the following funds with some dreadful numbers, representing a cautionary tale at least:

maxdur4

In contrast, some notable funds, including three Great Owls, with recovery times at 1 year or less:

maxdur5

On Bee’s suggestion, we will be working to make fund recovery times available to MFO readers.

Update – Meb Faber gets it right in interesting ways

By Charles Boccadoro

Originally published in July 1, 2014 Commentary

A quick follow-up to our feature on Mebane Faber in the May commentary, entitled “The Existential Pleasure of Engineering Beta.”

On May 16, Mebane posted on his blog “Skin in the Game – My Portfolio,” which states that he invests 100% of his liquid net worth in his firm’s funds: Global Tactical Hedge Fund (private), Global Value ETF (GVAL), Shareholder Yield ETF (SYLD), Foreign Shareholder Yield ETF (FYLD) – all offered by Cambria Investment Management.

His disclosure meets the “Southeastern Asset Management” rule, as coined and proposed by our colleague Ed Studzinski. It would essentially mandate that all employees of an investment firm limit their investments to funds offered by the firm. Ed proposes such a rule to better attune “investment professionals to what should be their real concern – managing risk with a view towards the potential downside, rather than ignoring risk with other people’s money.”

While Mr. Faber did not specify the dollar amount, he did describe it as “certainly meaningful.” The AdvisorShares SAI dated December 30, 2013, indicated he had upwards of $1M invested in his first ETF, Global Tactical ETF (GTAA), which was one of largest amounts among sub-advisors and portfolio managers at AdvisorShares.

Then, on June 5th, more clarity: “The two parties plan on separating, and Cambria will move on” from sub-advising GTAA and launch its own successor Global Momentum ETF (GMOM) at a full 1% lower expense ratio. Here’s the actual announcement:

2014-06-30_1838

Same day, AdvisorShares announced: “After a diligent review and careful consideration, we have decided to propose a change of GTAA’s sub-advisor. At the end of the day, our sole focus remains our shareholders’ best interests…” The updated SAI indicates the planned split is to be effective end of July.

2014-06-30_1841

Given the success of Cambria’s own recently launched ETFs, which together represent AUM of $357M or more than 10 times GTAA, the split is not surprising. What’s surprising is that AdvisorShares is not just shuttering GTAA, but chose instead to propose a new sub-advisor, Mark Yusko of Morgan Creek Capital Management.

On the surface, Mr. Yusko and Mr. Faber could not be more different. The former writes 25 page quarterly commentaries without including a single data graph or table. The latter is more likely to give us 25 charts and tables without a single paragraph.

When Mebane does write, it is casual, direct, and easily understood, while Mr. Yusko seems to read from the corporate play book: “We really want to think differently. We really want to embrace alternative strategies. Not alternative investments but alternative strategies. To gain access to the best and brightest. To invest on that global basis. To take advantage of where we see biggest return opportunities around the world.”

When we asked Mebane for a recent photo to use in the May feature, he did not have one and sent us a self-photo taken with his cell phone. In contrast, Mark Yusko offers a professionally produced video introducing himself and his firm, accompanied with scenes of a lovely creek (presumably Morgan’s) and soft music.   

Interestingly, Morgan Creek launched its first retail fund last September, aptly named Morgan Creek Tactical Allocation Fund (MAGTX/MIGTX). MAGTX carries a 5.75% front-load with a 2% er. (Gulp.) But, the good news is institutional share class MIGTX waives load on $1M minimum and charges only 1.75% er.

Mr. Yusko says “I don’t mind paying [egregious] fees as long as my net return is really high.” While Mr. Faber made a point during the recent Wine Country Conference that a goal for Cambria is to “disrupt the traditional high fee mutual fund and hedge fund business, mostly through launching ETFs.”

The irony here is that GTAA was founded on the tenants described in Mebane’s first book “The Ivy Portfolio,” which includes attempting to replicate Yale’s endowment success with all-asset strategy using an ETF.

Mr. Yusko’s earned his reputation managing the endowments at Notre Dame and University of North Carolina, helping to transform them from traditional stock/bond/cash portfolios to alternative hedge fund/venture capital/private investment portfolios. But WSJ reports that he was asked to step-down last year as CIO of the $3.5B Endowment Fund, which also attempted to mimic endowments like Yale’s. He actually established the fund in partnership with Salient Partners LP in 2004. “After nearly a decade of working with our joint venture partner in Texas, we found ourselves differing on material aspects of how to best run an endowment portfolio and run the business…” Perhaps with AdvisorShares, Mark Yusko will once again be able to see eye-to-eye.

As for Mebane? We will look forward with interest to the launch of GMOM, his continued insights and investment advice shared generously, and wish him luck in his attempts to disrupt the status quo. 

30Jun14/Charles

How Good Is Your Fund Family?

By Charles Boccadoro

family_1Originally published in June 1, 2014 Commentary

Question: How many funds at Dodge & Cox beat their category average returns since inception?

Answer: All of them.

In the case of Dodge & Cox, “all” is five funds:  DODBX, DODFX, DODGX, DODIX, and DODWX. Since inception, or at least as far back as January 1962, through March 2014, each has beaten its category average.

Same is true for these families: First Eagle, Causeway, Marsico, and Westwood.

For purposes of this article, a “fund family” comprises five funds or more, oldest share class only, with each fund being three years or older.

Obviously, no single metric should be used or misused to select a fund. In this case, fund lifetimes are different. Funds can perform inconsistently across market cycles. Share class representing “oldest” can be different. Survivorship bias and category drift can distort findings. Funds can be mis-categorized or just hard to categorize, making comparisons less meaningful.

Finally, metrics based on historical performance may say nothing of future returns, which is why analysis houses (e.g., Morningstar) examine additional factors, like shareholder friendliness, experience, and strategy to identify “funds with the highest potential of success.”

In the case of Marsico, for example, its six funds have struggled recently. The family charges above average expense ratios, and it has lost some experienced fund managers and analysts. While Morningstar acknowledges strong fund performance within this family since inception, it gives Marsico a negative “Parent” rating.

Nonetheless, these disclaimers acknowledged, prudent investors should know, as part of their due diligence, how well a fund family has performed over the long haul.

So, question: How many funds at Pacific Life beat category average returns since inception?

Applying the same criteria as above, the sad truth is: None of them.

PL funds are managed by Pacific Life Fund Advisors LLC, a wholly owned subsidiary of Pacific Life Insurance Company of Newport Beach, CA. Here from their web-site:

family_2

Got that?

Same sad truth for these families: AdvisorOne, Praxis, Integrity, Oak Associates, Arrow Funds, Pacific Financial, and STAAR.

In the case of Oak Associates, its seven funds have underperformed against their categories by 2.4% every year for almost 15 years! (They also experience maximum drawdown of -70.0% on average, or 13.1% worse than their categories.) Yet it proudly advertises recent ranking recognition by US News and selection to Charles Schwab’s OneSource. Its motto: “A Focus on Growth.”

To be clear, my colleague Professor Snowball has written often about the difficulties of beating benchmark indices for those funds that actually try. The headwinds include expense ratios, loads, transaction fees, commissions, and redemption demands. But the lifetime over- and under-performance noted above are against category averages of total returns, which already reflect these headwinds.

Overview. Before presenting performance results for all fund families, here’s is an overall summary, which will put some of the subsequent metrics in context:

family_3

It remains discouraging to see half the families still impose front load, at least for some share classes – an indefensible and ultimately shareholder unfriendly practice. Three quarters of families still charge shareholders a 12b-1 fee. All told shareholders pay fund families $12.3 billion every year for marketing. As David likes to point out, there are more funds in the US today than there are publically traded US companies. Somebody must pay to get the word out.

Size. Fidelity has the most number of funds. iShares has the most ETFs. But Vanguard has the largest assets under management.

family_4

Expense. In last month’s MFO commentary, Edward Studzinski asked: “It Costs How Much?

As a group, fund families charge shareholders $83.3 billion each year for management fees and operating costs, which fall under the heading “expense ratio.” ER includes marketing fees, but excludes transaction fees, loads, and redemption fees.

family_5

It turns out that no fund family with an average ER above 1.58% ranks in the top performance quintile, as defined below, and most families with an average ER above 2.00 end up in the bottom quintile.

While share class does not get written about very often, it helps reveal inequitable treatment of shareholders for investing in the same fund. Typically, different share classes charge different ERs depending on initial investment amount, load or transaction fee, or association of some form. American has the largest number of share classes per fund with nearly five times the industry average.

Rankings. The following tables summarize top and bottom performing families, based on the percentage of their funds with total returns that beat category averages since inception:

family_6

family_7

As MFO readers would expect, comparison of top and bottom quintiles reveals the following tendencies:

  • Top families charge lower ER, 1.06 versus 1.45%, on average
  • Fewer families in top quintile impose front loads, 21 versus 55%
  • Fewer families in top quintile impose 12b-1 fees, 64 versus 88%

For this sample at least, the data also suggests:

  • Top families have longer tenured managers, if slightly, 9.6 versus 8.2 years
  • Top families have fewer share classes, if slightly (1.9 versus 2.3 share class ratio, after 6 sigma American is removed as an outlier; otherwise, just 2.2 versus 2.3)

The complete set of metrics, including ER, AUM, age, tenure, and rankings for each fund family, can be found in MFO Fund Family Metrics, a downloadable Google spreadsheet. (All metrics were derived from Morningstar database found in Steel Mutual Fund Expert, dated March 2014.)

A closer look at the complete fund family data also reveals the following:

family_8

Some fund families, like Oakmark and Artisan, have beaten their category averages by 3-4% every year for more than 10 years running, which seems quite extraordinary. Whether attributed to alpha, beta, process, people, stewardship, or luck…or all the above. Quite extraordinary.

While others, frankly too many others, have done just the opposite. Honestly, it’s probably not too hard to figure out why.

31May14/Charles

The Existential Pleasures of Engineering Beta

By Charles Boccadoro

Originally published in May 1, 2014 Commentary

Mebane Faber is a quant.MF_1

He is a student of financial markets, investor behavior, trend-following, and market bubbles. He pursues absolute return, value, and momentum strategies. And, he likes companies that deliver cash to shareholders.

He recognizes alpha is elusive, so instead focuses on engineering beta, which promises a more pragmatic and enduring reward.

In a field full of business majors and MBAs, he holds degrees in engineering and biology.

He distills a wealth of financial literature, research, and conditions into concise and actionable investing advice, shared through books, his blog, and lectures.

Given low-cost ETFs and mutual funds available today, he thinks people generally should no longer need to hire advisors, or “brokers back in the day,” at 1-2% fees to tell them how to allocate buy-and-hold portfolios. “It kind of borderlines on criminal,” he tells Michael Covel in a recent interview, since such advisors “do not do enough to justify their fees.”

He is a portfolio manager and CIO of Cambria Investment Management, L.P., which he co-founded along with Eric Richardson in 2006. It is located in El Segundo, CA.

His down-to-earth demeanor is at once confident and refreshingly approachable. He cites philosopher Henry David Thoreau: “There is no more fatal blunderer than he who consumes the greater part of his life getting his living.”

The Paper. Mebane (pronounced “meb-inn”) started his career as biotech equity analyst during the genome revolution and internet bubble. While at University of Virginia, he attended an advanced seminar in security analysis taught by the renowned hedge fund manager John Griffin of Blue Ridge Capital. In fulfillment of the Chartered Market Technician program, Mebane drafted a paper that became the basis for “A Quantitative Approach To Tactical Asset Allocation,” published in the Journal of Wealth Management in 2007.

The paper originally included the words “market timing,” but he soon discovered that to a lot of people, the phrase comes with “enormous emotional baggage” and “can immediately shut-down all synapses in their brains.” Similar to Ed Thorp’s experience with his first academic paper on winning at blackjack, Mebane had to change the title to get it published. (It continues to stimulate synapses, as discussed in David’s July 2013 commentary, “Timing Method Performance Over Ten Decades” and periodically on the MFO discussion board.)

He attributes the paper’s ultimate popularity to 1) its simple presentation and explanation of the compelling results, and 2) the fortuitous timing of the publication itself – just before the financial meltdown of 2008/9. Practitioners of the method during that period were rewarded with a maximum drawdown of only -2% through versus -51% for the S&P 500.

The Books. There are three. All insightful, concise, and well-received:

MF_2

As summarized above, each contains straight-forward strategies that investors can follow on their own using publically available information. That said, each also forms the basis of ETFs launched by Cambria Investment Management.

The First Fund. Last December, Mebane tweeted “Diversification was deworseification in 2013.” To understand what he meant, just compare US stock return against just about all other asset classes – it trounced them. Several all-asset strategies have underperformed during the current bull market, as seen in the comparison below, including AdvisorShares Cambria Global Tactical ETF Fund (GTAA). GTAA was Cambria’s first ETF, launched in November 2010, as a sub-advisor through ETF house AdvisorShares, and based on the strategy outlined in “The Ivy Portfolio.”

MF_3b

If it helps, Mebane is in good company. Rob Arnott’s all asset and John Hussman’s total return strategies have not received much love lately either. In fact, since GTAA’s inception, the “generic” all-asset allocation of US stocks, foreign stocks, bonds, REITs, and broad commodities has underperformed US equity index by 40% and traditional 60/40 balanced index by 15%.

GTAA’s actual portfolio currently shows more than 50 holdings, virtually all ETFs. Looking back, the fund has held substantial cash at times, approaching 40% in mid-2013…”assuming a defensive posture and utilizing cash as an alternative to its long positions.”

Market volatility has likely hurt GTAA as well. Its timing strategy, shown to thrive in trending markets, can struggle with short-term gyrations, which have been present in commodity, foreign equity, and real estate markets during this time. Finally, AdvisorShares’ high expense ratio, even after waivers, only adds to the headwind.  At the 3.5-year mark, GTAA remains at $36M assets under management (AUM).

The New Funds. Cambria has since launched three other ETFs, based on the strategies outlined in Mebane’s two new books, but this time the funds were kept in-house to have “control over the process and charge reasonable fees.” Each fund invests in some 100 companies with capitalizations over $200M. And, each has quickly attracted AUM, rather remarkably given the proliferation of ETFs today. They are:

GVAL is the newest and actually tracks to a Cambria-developed index, maintained daily. It focuses on companies that trade 1) below their assessed intrinsic value, and 2) in countries with the most undervalued markets determined by parameters like CAPE, as depicted in earlier figure. These days, Mebane believes that means outside the US. “We certainly don’t think the [US] market is in a bubble, rather, valuations will be a headwind. There are much better opportunities abroad.

SYLD is actively managed and focuses primarily on US companies that exhibit strong characteristics of returning free cash flow to their shareholders; specifically, “shareholder yield,” which comprises dividend payments, share buybacks, and debt pay-down. FYLD seeks the same types of companies, but in developed foreign countries and it passively tracks to Cambria’s FYLD index.

Mebane believes that these are the first ETFs to incorporate the shareholder yield strategy. And, based on their reception in the crowded ETF market, he seems pretty pleased: “I certainly think alpha is possible…lots of jargon across smart beta, alpha, etc., but beating a market cap index is a great first step.” Morningstar’s Samuel Lee noted them among best new ETFs of 2013. Approaching its first year, SYLD is certainly off to a strong start:

MF_4

Interestingly, none of these three ETFs employ explicit draw-down control or trend-following, like GTAA, although GVAL does “start moving to cash if markets don’t pass an absolute valuation filter … no sense in buying what is cheapest when everything is expensive,” Mebane explains. SYLD too has the discretion to take the entire portfolio to “Temporary Defensive Positions.”

When asked if his approach to risk management is changing, given the incorporation of more traditional strategies, he asserts that he’s “still a firm believer in trend-following and future funds will have trend components.” (Other funds in pipeline at Cambria include Global Momentum ETF and Value and Momentum ETF).

Mebane remains one of the largest shareholders on record among the portfolio managers at AdvisorShares. His overall skin-in-the-game? “100% of my investable net worth is in our funds and strategies.”

The Blog. mebfaber.com (aka “World Beta”) started in November 2006. It is a pleasant blend of perspective, opinion, results from his and other’s research – quantitative and factual, images, and references. He shares generously on  both personal and professional levels, like in the recent posts “My Investing Mentor” and “How to Start an ETF.”

There is a great reading list and blogroll. There are sources for data, references, and research papers. It’s free, with occasional plugs, but no annoying pop-ups. For the more serious investors, fund managers, and institutions, he offers a premium subscription to “The Idea Farm.”

He once wrote actively for SeekingAlpha, but stopped in 2010, explaining: “I find the quality control of the site is poor, and the respect for authors to be low.  Also, [it] becomes a compliance risk and headache.”

He strikes me as having the enviable ability to absorb enormous about of information, from past lessons to today’s water-hose of publications, blogs, tweets, and op-eds, then distill it all down to chart a way forward. Asked whether this comes naturally or does he use a process, he laughs: “I would say it comes unnaturally and painfully!”

29Apr14/Charles

Ten Market Cycles

By Charles Boccadoro

Originally published in April 1, 2014 Commentary
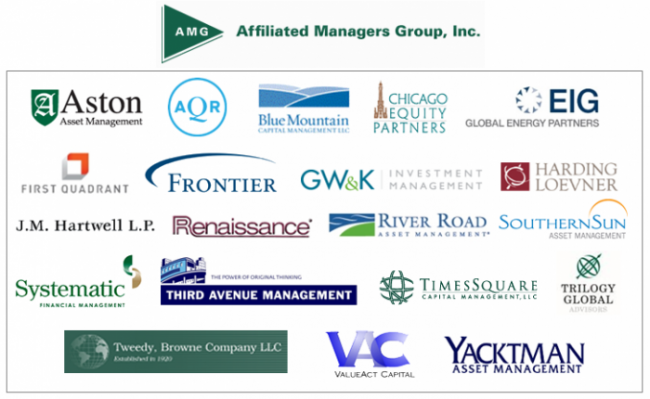
In response to the article In Search of Persistence, published in David’s January commentary, NumbersGirl posted the following on the MFO board:
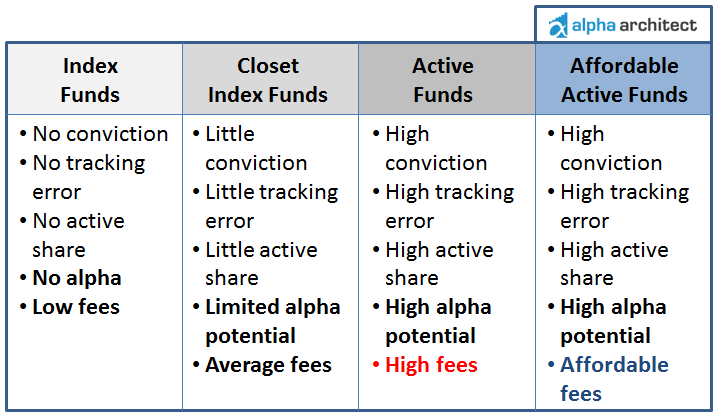
I am not enamored of using rolling 3-year returns to assess persistence.

A 3-year time period will often be all up or all down. If a fund manager has an investing personality or philosophy then I would expect strong relative performance in a rising market to be negatively correlated with poor relative performance in a falling market, etc.

It seems to me that the best way to measure persistence is over 1 (or better yet more) market cycles.

There followed good discussion about pros and cons of such an assessment, including lack of consistent definition of what constitutes a market cycle.

Echoing her suggestion, fund managers also often ask to be judged “over full cycle” when comparing performance against their peers.

A quick search of literature (eg., Standard & Poor’s Surviving a Bear Market and Doug Short’s Bear Markets in the S&P since 1950) shows that bear markets are generally “defined as a drop of 20% or more from the market’s previous high.” Here’s how the folks at Steele Mutual Fund Expert define a cycle:

Full-Cycle Return: A full cycle return includes a consecutive bull and bear market return cycle.

Up-Market Return (Bull Market): A Bull market in stocks is defined as a 20% rise in the S&P 500 Index from its previous trough, ending when the index reaches its peak and subsequently declines by 20%.

Down-Market Return (Bear Market): A Bear market in stocks is defined as a 20% decline in the S&P 500 Index from its previous peak, and ends when the index reaches its trough and subsequently rises by 20%.

Applying this definition to the SP500 intraday price index indicates there have indeed been ten such cycles, including the current one still in process, since 1956: 

tencycles_1

The returns shown are based on price only, so exclude dividends. Note that the average duration seems to match-up pretty well with so-called “short term debt cycle” (aka business cycle) described by Bridgewater’s Ray Dalio in the charming How the Economic Machine Works – In 30 Minutes video.

Here’s break-out of bear and bull markets:

tencycles_2 
The graph below depicts the ten cycles. To provide some historic context, various events are time-lined – some good, but more bad. Return is on left axis, measured from start of cycle, so each builds where previous left off. Short-term interest rate is on right axis.  

tencycles_3a

Note that each cycle resulted in a new all-time market high, which seems rather extraordinary. There were spectacular gains for the 1980 and 1990 bull markets, the latter being 427% trough-to-peak! (And folks worry lately that they may have missed-out on the current bull with its 177% gain.) Seeing the resiliency of the US market, it’s no wonder people like Warren Buffett advocate a buy-and-hold approach to investing, despite the painful -50% or more drawdowns, which have occurred three times over the period shown.
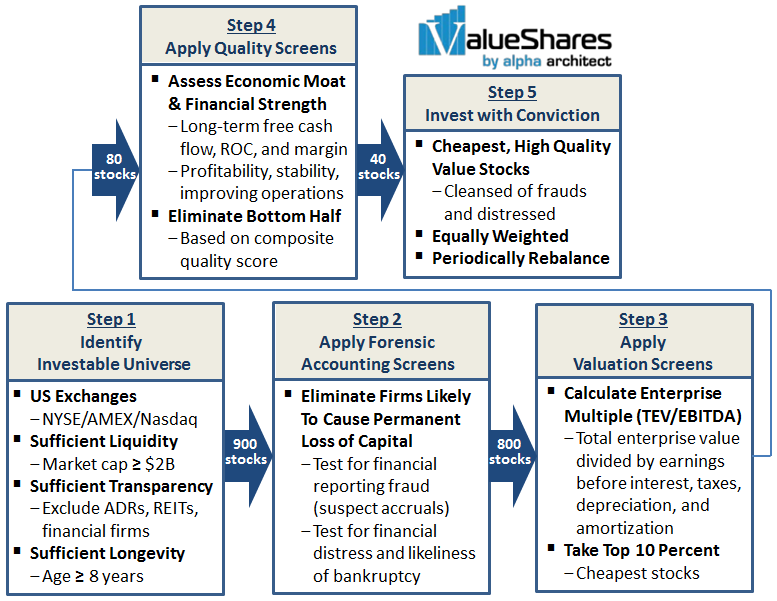
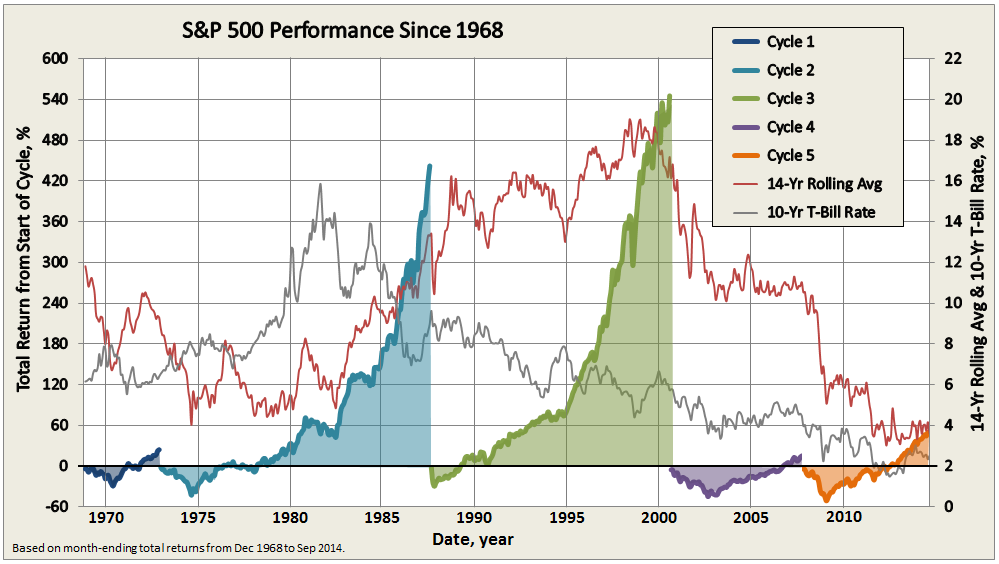
Having now defined the market cycles, which for this assessment applies principally to US stocks, we can revisit the question of mutual fund persistence (or lack of) across them.

Based on the same methodology used to determine MFO rankings, the chart below depicts results across nine cycles since 1962:

tencycles_4

Blue indicates top quintile performance, while red indicates bottom quintile. The rankings are based on risk adjusted return, specifically Martin ratio, over each full cycle. Funds are compared against all other funds in the peer group. The number of funds was rather small back in 1962, but in the later cycles, these same funds are competing against literally hundreds of peers.

(Couple qualifiers: The mural does not account for survivorship-bias or style drift. Cycle performance is determined using monthly total returns, including any loads, between the peak-to-peak dates listed above, with one exception…our database starts Jan 62 and not Dec 61.)

Not unexpectedly, the result is similar to previous studies (eg., S&P Persistence Scorecard) showing persistence is elusive at best in the mutual fund business. None of the 45 original funds in four categories delivered top-peer performance across all cycles – none even came close.

Looking at the cycles from 1973, a time when several now well know funds became established, reveals a similar lack of persistence – although one or two come close to breaking the norm. Here is a look at some of the top performing names:

tencycles_5

MFO Great Owls Mairs & Powers Balanced (MAPOX) and Vanguard Wellington (VWELX) have enjoyed superior returns the last three cycles, but not so much in the first. The reverse is true for legendary Fidelity Magellan (FMAGX).

Even a fund that comes about as close to perfection as possible, Sequoia (SEQUX), swooned in the late ‘90s relative to other growth funds, like Fidelity Contrafund (FCNTX), resulting in underperformance for the cycle. The table below details the risk and return metrics across each cycle for SEQUX, showing the -30% drawdown in early 2000, which marked the beginning of the tech bubble. In the next couple years, many other growth funds would do much worse.

tencycles_6

So, while each cycle may rhyme, they are different, and even the best managed funds will inevitably spend some time in the barrel, if not fall from favor forever.

We will look to incorporate full-cycle performance data in the single-ticker MFO Risk Profile search tool. As suggested by NumbersGirl, it’s an important piece of due diligence and risk cognizance for all mutual fund investors.

26Mar14/Charles

Morningstar’s Risk Adjusted Return Measure

By Charles Boccadoro

Originally published in March 1, 2014 Commentary
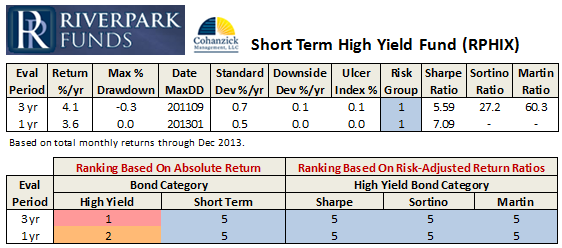
Central to any fund rating system is the performance measure used to determine percentile rank order. MFO uses Martin ratio, as described Rating System Definitions. Morningstar developed its own risk adjusted return (MRAR), which Nobel Laureate William Sharpe once described as a measure that “…differs significantly from more traditional ones such as various forms of the Sharpe ratio.” While the professor referred to an earlier version of MRAR, the same holds true today.

Here is how Morningstar describes MRAR on its Data FAQ page: Morningstar adjusts for risk by calculating a risk penalty for each fund based on “expected utility theory,” a commonly used method of economic analysis. Although the math is complex, the basic concept is relatively straightforward. It assumes that investors are more concerned about a possible poor outcome than an unexpectedly good outcome and that those investors are willing to give up a small portion of an investment’s expected return in exchange for greater certainty. A “risk penalty” is subtracted from each fund’s total return, based on the variation in its month-to-month return during the rating period, with an emphasis on downward variation. The greater the variation, the larger the penalty. If two funds have the exact same return, the one with more variation in its return is given the larger risk penalty.

For the curious and mathematically inclined, the detailed equations are well documented in The Morningstar Rating Methodology. The following figure illustrates how MRAR behaves for three hypothetical funds over a 3 year period ending Dec 2013:

hypothetical fundsfund012

Each fund in the illustration delivers the same total return, but with varying levels of volatility. The higher the volatility, the lower the risk adjusted return. Fund 0 delivers consistent returns every month with zero volatility; consequently, it receives the highest MRAR, which in this case is the fund’s annualized total return minus the risk-free T-Bill (i.e., it’s the annualized “excess” return).

Morningstar computes MRAR for all funds over equivalent periods, and then percentile ranks them within their respective categories to assign appropriate levels, 1 star for those funds in the lowest group and the coveted 5 star rating for the highest.

It also computes a risk measure MRisk and performs a similar ranking to designate “low” to “high” risk funds within each category. MRisk is simply the difference between the annualized excess return of the fund and its MRAR.

The following figure provides further insight into how MRAR behaves for funds of varying volatility. This time, fund total returns have been scaled to match their category averages, again for the 3 year period ending Dec 2013. The figure includes results from several categories showing MRAR versus the tradition volatility measure, annualized standard deviation.

mrar sensitivity

Once again we see that funds with higher volatility generally receive lower MRARs and that the highest possible MRAR is equal to a fund’s annualized excess return, which occurs at zero standard deviation.

A consequence of Morningstar’s methodology is that low volatility funds with below average returns can quite possibly be out-ranked by average volatility funds with average returns. Put another way, the methodology generally penalizes funds with high volatility more so than it rewards funds with low volatility, since with the latter the benefit is “capped.”

This behavior is different from other risk adjusted return measures based on say Sharpe ratio, as can be seen in the figure below. Here the same funds from above are plotted against Sharpe, but now funds with low volatility are rewarded handsomely, even if they have below average total returns.

sharpe sensitivity

Revisiting the Morningstar risk measure MRisk, one finds another observation: it appears to correlate rather satisfactorily against a simple function based on standard deviation (up to about 30% for funds of positive total return without load):
morningstar risk

Which means that Morningstar’s risk adjusted return can be estimated from the following:

morningstar mrar

This simple approximation may come in handy, like when David wonders: “Why do RPHIX and ICMYX, which have superior 3 year Sharpe ratios, rate a very inferior 1 star by Morningstar?” He can use the above calculation to better understand, as illustrated here:

mrar approximation

While both do indeed have great 3 year Sharpe ratios – RPHIX is highest of any US fund – they both have below average total returns relative to their current peer group, as represented by say VWEHX, a moderate risk and average returning high yield bond “reference” fund.

Their low volatilities simply get no love from Morningstar’s risk adjusted return measure.

27Feb2014/Charles

Impact of Category on Fund Ratings

By Charles Boccadoro

Originally published in February 1, 2014 Commentary
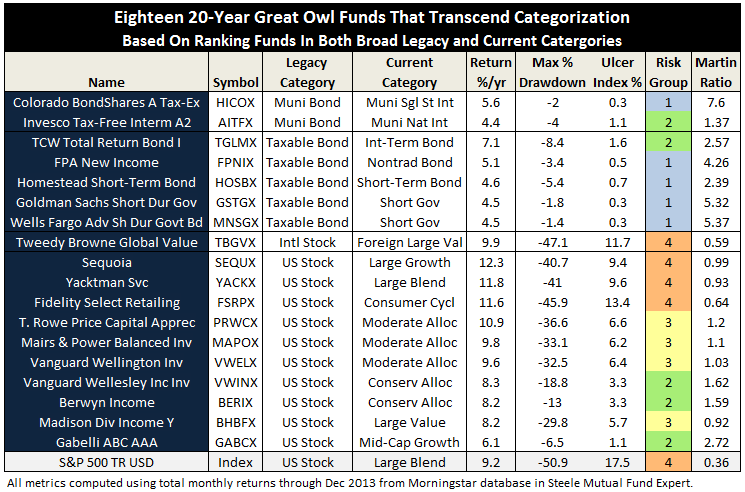
The results for MFO’s fund ratings through quarter ending December 2013, which include the latest Great Owl and Three Alarm funds, can be found on the Search Tools page. The ratings are across 92 fund categories, defined by Morningstar, and include three newly created categories:

Corporate Bond. “The corporate bond category was created to cull funds from the intermediate-term and long-term bond categories that focused on corporate bonds,” reports Cara Esser.  Examples are Vanguard Interm-Term Invmt-Grade Inv (VFICX) and T. Rowe Price Corporate Income (PRPIX).

Preferred Stock. “The preferred stock category includes funds with a majority of assets invested in preferred stock over a three-year period. Previously, most preferred share funds were lumped in with long-term bond funds because of their historically high sensitivity to long-term yields.” An example is iShares US Preferred Stock (PFF).

Tactical Allocation. “Tactical Allocation portfolios seek to provide capital appreciation and income by actively shifting allocations between asset classes. These portfolios have material shifts across equity regions and bond sectors on a frequent basis.” Examples here are PIMCO All Asset All Authority Inst (PAUIX) and AQR Risk Parity (AQRIX).

An “all cap” or “all style” category is still not included in the category definitions, as explained by John Rekenthaler in Why Morningstar Lacks an All-Cap Fund Category. The omission frustrates many, including BobC, a seasoned contributor to the MFO board:

Osterweis (OSTFX) is a mid-cap blend fund, according to M*. But don’t say that to John Osterweis. Even looking at the style map, you can see the fund covers all of the style boxes, and it has about 20% in foreign stocks, with 8% in emerging countries. John would tell you that he has never managed the fund to a style box. In truth he is style box agnostic. He is looking for great companies to buy at a discount. Yet M* compares the fund with others that are VERY different.

In fairness, according to the methodology, “for multiple-share-class funds, each share class is rated separately and counted as a fraction of a fund within this scale, which may cause slight variations in the distribution percentages.” Truth is, fund managers or certainly their marketing departments are sensitive to what category their fund lands-in, as it can impact relative ratings for return, risk, and price.

As reported in David’s October commentary, we learned that Whitebox Funds appealed to the Morningstar editorial board to have its Tactical Opportunities Fund (WBMIX) changed from aggressive allocation to long/short equity. WBMIX certainly has the latitude to practice long/short; in fact, the strategy is helping the fund better negotiate the market’s rough start in 2014. But its ratings are higher and price is lower, relatively, in the new category.

One hotly debated fund on the MFO board, ASTON/River Road Independent Small Value (ARIVX), managed by Eric Cinnamond, would also benefit from a category change. As a small cap, the fund rates a 1 (bottom quintile) for 2013 in the MFO ratings system, but when viewed as a conservative or tactical allocation fund – because of significant shifts to cash – the ratings improve. Here is impact on return group rank for a couple alternative categories:

2014-01-26_1755

Of course, a conservative tactical allocation category would be a perfect antidote here (just kidding).

Getting It Wrong. David has commented more than once about the “wildly inappropriate” mis-categorization of Riverpark Short Term High Yield Fund (RPHIX), managed by David Sherman, which debuted with just a single star after its first three years of operation. The MFO community considers the closed fund more of a cash alternative, suited best to the short- or even ultrashort-term bond categories, but Morningstar placed it in the high yield bond category.

Exacerbating the issue is that the star system appears to rank returns after deducting for a so-called “risk penalty,” based on the variation in month-to-month return during the rating period. This is good. But it also means that funds like RPHIX, which have lower absolute returns with little or no downside, do not get credit for their very high risk-adjusted return ratios, like Sharpe, Sortino, or Martin.

Below is the impact of categorization, as well as return metrics, on its performance ranking. The sweet irony is that its absolute return even beat the US bond aggregate index!

2014-01-28_2101

RPHIX is a top tier fund by just about any measure when placed in a more appropriate bond category or when examined with risk-adjusted return ratios. (Even Modigliani’s M2, a genuinely risk-adjusted return, not a ratio, that is often used to compare portfolios with different levels of risk, reinforces that RPHIX should still be top tier even in the high yield bond category.) Since Morningstar states its categorizations are “based strictly on portfolio statistics,” and not fund names, hopefully the editorial board will have opportunity to make things right for this fund at the bi-annual review in May.

A Broader View. Interestingly, prior to July 2002, Morningstar rated funds using just four broad asset-class-based groups: US stock, international stock, taxable bond, and municipal bonds. It switched to (smaller) categories to neutralize market tends or “tailwinds,” which would cause, for example, persistent outperformance by funds with value strategies.

A consequence of rating funds within smaller categories, however, is more attention goes to more funds, including higher risk funds, even if they have underperformed the broader market on a risk-adjusted basis. And in other cases, the system calls less attention to funds that have outperformed the broader market, but lost an occasional joust in their peer group, resulting in a lower rating.

Running the MFO ratings using only the four board legacy categories reveals just how much categorization can alter the ratings. For example, the resulting “US stock” 20-year Great Owl funds are dominated by allocation funds, along with a high number of sector equity funds, particularly health. But rate the same funds with the current categories (Great Owl Funds – 4Q2013), and we find more funds across the 3 x 3 style box, plus some higher risk sector funds, but the absence of health funds.

Fortunately, some funds are such strong performers that they appear to transcend categorization. The eighteen funds listed below have consistently delivered high excess return while avoiding large drawdown and end-up in the top return quintile over the past 20, 10, 5, and 3 year evaluation periods using either categorization approach:

2014-01-28_0624 Roy Weitz grouped funds into only five equity and six specialty “benchmark categories” when he established the legacy Three Alarm Funds list. Similarly, when Accipiter created the MFO Miraculous Multi-Search tool, he organized the 92 categories used in the MFO rating system into 11 groups…not too many, not too few. Running the ratings for these groupings provides some satisfying results:
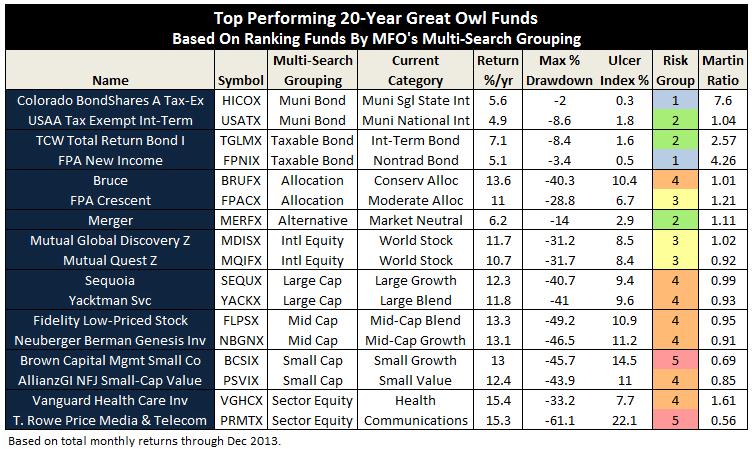
2014-01-28_1446_001

A more radical approach may be to replace traditional style categories altogether! For example, instead of looking for best performing small-cap value funds, one would look for the best performing funds based on a risk level consistent with an investor’s temperament. Implementing this approach, using Risk Group (as defined in ratings system) for category, identifies the following 20-year Great Owls:

2014-01-28_1446

Bottom Line. Category placement can be as important to a fund’s commercial success as its people, process, performance, price and parent. Many more categories exist today on which peer groups are established and ratings performed, causing us to pay more attention to more funds. And perhaps that is the point. Like all chambers of commerce, Morningstar is as much a promoter of the fund industry, as it is a provider of helpful information to investors. No one envies the enormous task of defining, maintaining, and defending the rationale for several dozen and ever-evolving fund categories. Investors should be wary, however, that the proliferation may provide a better view of the grove than the forest.

28Jan2014/Charles

In Search of Persistence

By Chip

Originally published in January 1, 2014 Commentary

It’s 1993. Ten moderate allocation funds are available that have existed for 20 years or more. A diligent, well intended investor wants to purchase one of them based on persistent superior performance. The investor examines rolling 3-year risk-adjusted returns every month during the preceding 20 years, which amounts to 205 evaluation periods, and delightfully discovers Virtus Tactical Allocation (NAINX).

It outperformed nearly 3/4ths of the time, while it under-performed only 5%. NAINX essentially equaled or beat its peers 194 out of 205 periods. Encouraged, the investor purchases the fund making a long-term commitment to buy-and-hold.

It’s now 2013, twenty years later. How has NAINX performed? To the investor’s horror, Virtus Tactical Allocation underperformed 3/4ths of the time since purchased! And the fund that outperformed most persistently? Mairs & Power Balanced (MAPOX), of course.

Back to 1993. This time a more aggressive investor applies the same methodology to the large growth category and finds an extraordinary fund, named Fidelity Magellan (FMAGX).  This fund outperformed nearly 100% of the time across 205 rolling 3-year periods over 20 years versus 31 other long-time peers. But during the next 20 years…? Not well, unfortunately. This investor would have done better choosing Fidelity Contrafund (FCNTX). How can this be? Most industry experts would attribute the colossal shift in FMAGX performance to the resignation of legendary fund manager Peter Lynch in 1990.

virtus fidelity

MJG, one of the heavy contributors to MFO’s discussion board, posts regularly about the difficulty of staying on top of one’s peer group, often citing results from Standard & Poor’s Index Versus Active Indexing (SPIVA) reports. Here is the top lesson-learned from ten years of these reports:

“Over a five-year horizon…a majority of active funds in most categories fail to outperform indexes. If an investing horizon is five years or longer, a passive approach may be preferable.”

The December 2013 SPIVA “Persistence Scorecard” has just been published, which Joshua Brown writes insightfully about in “Persistence is a Killer.” The scorecard once again shows that only a small fraction of top performing domestic equity mutual funds remain on top across any 2, 3, or 5 year period.

What does mutual fund non-persistence look like across 40 years? Here’s one depiction:

mutual fund mural

The image (or “mural”) represents monthly rank by color-coded quintiles of risk-adjusted returns, specifically Martin Ratio, for 101 funds across five categories. The funds have existed for 40 years through September 2013. The calculations use total monthly returns of oldest share class only, ignoring any load, survivor bias, and category drift.  Within each category, the funds are listed alphabetically.

There are no long blue/green horizontal streaks. If anything, there seem to be more extended orange/red streaks, suggesting that if mutual fund persistence does exist, it’s in the wrong quintiles! (SPIVA actually finds similar result and such bottom funds tend to end-up merged or liquated.)

Looking across the 40 years of 3-year rolling risk-adjusted returns, some observations:

  • 98% of funds spent some periods in every rank level…top, bottom, and all in-between
  • 35% landed in the bottom two quintiles most of the time…that’s more than 1/3rd of all funds
  • 13% were in the top two bottom quintiles…apparently harder to be persistently good than bad
  • Sequoia (SEQUX) was the most persistent top performer…one of greatest mutual funds ever
  • Wall Street (WALLX) was the most persistent cellar dweller…how can it still exist?

sequoia v wall street

The difference in overall return between the most persistent winner and loser is breathtaking: SEQUX delivered 5.5 times more than SP500 and 16 times more than WALLX. Put another way, $10K invested in SEQUX in October 1973 is worth nearly $3M today. Here’s how the comparison looks:

sequx wallx sp500

So, while attaining persistence may be elusive, the motivation to achieve it is clear and present.

The implication of a lack of persistence strikes at the core of all fund rating methodologies that investors try to use to predict future returns, at least those based only on historical returns. It is, of course, why Kiplinger, Money, and Morningstar all try to incorporate additional factors, like shareholder friendliness, experience, and strategy, when compiling their Best Funds lists. An attempt, as Morningstar well states, to identify “funds with the highest potential of success.”

The MFO rating system was introduced in June 2013. The current 20-year Great Owls, shown below for moderate allocation and large growth categories, include funds that have achieved top performance rank over the past 20, 10, 5, and 3 year evaluation periods. (See Rating Definitions.)

20 year GOs

But will they be Great Owls next year? The system is strictly quantitative based on past returns, which means, alas, a gentle and all too ubiquitous reminder that past performance is not a guarantee of future results. (More qualitative assessments of fund strategy, stewardship, and promise are provided monthly in David’s fund profiles.) In any case and in the spirit of SPIVA, we will plan to publish periodically a Great Owl “Persistence Scorecard.”

31Dec2013/Charles

Three Alarm Funds Redux

By Charles Boccadoro

Originally published in December 1, 2013 Commentary

alarm bellsRoy Weitz first published the legacy Three Alarm fund list in 1996. He wanted to help investors decide when to sell mutual funds. Being on the list was not an automatic sell, but a warning signal to look further and see why.

“I liken the list to the tired old analogy of the smoke detector. If it goes off, your house could be on fire. But it could also be cobwebs in the smoke detector, in which case you just change the batteries and go back to sleep,” he explained in a 2002 interview.

Funds made the list if they trailed their benchmarks for the past 1, 3, and 5 year periods. At the time, he grouped funds into only five equity (large-cap, mid-cap, small-cap, balanced, and international) and six specialty “benchmark categories.” Instead of pure indices, he used actual funds, like Vanguard 500 Index Fund VFINX, as benchmarks. Occasionally, the list would catch some heat because “mis-categorization” resulted in an “unfair” rating. Some things never change.

At the end of the day, however, Mr. Weitz wanted “to highlight the most serious underperformers.” In that spirit, MFO will resurrect the Three Alarm fund list, which will be updated quarterly along with the Great Owl ratings. Like the original methodology, inclusion on the list will be based entirely on absolute, not risk-adjusted, returns over the past 1, 3, and 5 year periods.

Since 1996, many more fund categories exist. Today Morningstar assigns over 90 categories across more than 7500 unique funds, excluding money market, bear, trading, volatility, and specialized commodity. MFO will rate the new Three Alarm funds using the Morningstar categories. We acknowledge that “mis-categorization” may occasionally skew the ratings, but probably much less than if we tried to distill all rated funds into just 11 or so categories.

For more than two-thirds of the categories, one can easily identify a reasonable “benchmark” or reference fund, thanks in part to the proliferation of ETFs. Below is a sample of these funds, sorted first by broad investment Type (FI – Fixed Income, AA – Asset Allocation, EQ – Equity), then Category:

benchmarks

Values in the table include the 3-year annualized standard deviation percentage (STDEV), as well as annualized return percentages (APR) for the past 1, 3, and 5 year periods.

A Return Rating is assigned based how well a fund performs against other funds in the same category during the same time periods. Following the original Three Alarm nomenclature, best performing funds rate a “2” (highlighted in blue) and the worst rate a “-2” (red).

As expected, most of the reference funds rate mid range “0” or slightly better. None produce top or bottom tier returns across all evaluation periods. The same is true for all 60 plus category reference funds. Selecting reference funds in the other 30 categories remains difficult because of their diversity.

To “keep it simple” MFO will include funds on the Three Alarm list if they have the worst returns in their categories across all three evaluation periods. More precisely, Three Alarm Funds have absolute returns in the bottom quintile of their categories during the past 1, 3, and 5 years. Most likely, these funds have also under-performed their “benchmarks” over the same three periods.

There are currently 316 funds on the list, or fewer than 6% of all funds rated. Here are the Three Alarm Funds in the balanced category, sorted by 3 year annualized return:

balanced

Like in the original Three Alarm list, a fund’s Risk Rating is assigned based a “potential bad year” relative to other funds in the same category. A Risk Rating of “2” (highlighted in red) goes to the highest risk funds, while “-2” (blue) goes to the lowest risk funds. (Caution: This rating measures a fund’s risk relative to other funds in same category, so a fund in a high volatility category like energy can have high absolute risk relative to market, even if it has a low risk rating in its category.)

“Risk” in this case is based on the 3 year standard deviation and return values. Specifically, two standard deviations are subtracted from the return value. The result is then compared with other funds in the category to assign a rating. The rating is a little more sensitive to downside than the original measure as investors have experienced two 50% drawdowns since the Three Alarm system was first published.

While never quite as popular as the Three Alarm list, Mr. Weitz also published an Honor Roll list. In the redux system, Honor Roll funds have returns in the top quintile of their categories in the past 1, 3, and 5 years. There are currently 339 such funds.

The Three Alarm, Honor Roll, and Reference funds can all be found here.

06Nov2013/Charles

Comparing Lists of “Best Funds”

By Charles Boccadoro

Originally published in November 1, 2013 Commentary

Last month David pointed out how little overlap he found between three popular mutual fund lists: Kiplinger 25, Money 70, and Morningstar’s Fantastic 51. David mused: “You’d think that if all of these publications shared the same sensible goal – good risk-adjusted returns and shareholder-friendly practices – they’d also be stumbling across the same funds. You’d be wrong.”

He found only one fund, Dodge & Cox International Fund DODFX, on all three lists. Just one! Although just one is a statistically better outcome than randomly picking three such lists from the 6600 or so mutual funds and 1000 ETFs, it does seem surprisingly small. 

Opening up the field a little, by replacing the Fantastic 51 with a list of 232 funds formed from Morningstar’s current “Gold-Rated Funds” and “Favorite ETFs,” the overlap does not improve much. Just two funds appear in all three publications: DODFX and Habor Bond Institutional HABDX. Just two!

While perhaps not directly comparable, the table below provides a quick summary of the criteria used by each publication. Money 70 criteria actually include Morningstar’s so-called stewardship grade, which must be one of the least maintained measures. For example, Morningstar awarded Bruce Berkowitz Fund Manager of the Decade, but it never published a stewardship grade for Fairholme.

comparison

Overall, however, the criteria seem quite similar, or as David described “good risk-adjusted returns and shareholder-friendly practices.”  Add in experienced managers for good measure and one would expect the lists to overlap pretty well. But again, they don’t.

How do the “forward-looking” recommendations in each of these lists fare against Morningstar’s purely quantitative “backward-looking” performance rating system? Not as well as you might think. There are just seven 5-star funds on Money’s list, or 1-in-10. Kiplinger does the best with six, from a percentage perspective, or almost 1-in-4. (They must have peeked.) Morningstar’s own list includes 44 5-star funds, or about 1-in-5. So, as well intentioned and “forward looking” as these analysts certainly try to be, only a small minority of their “best funds” have delivered top-tier returns.

On the other hand, they each do better than picking funds arbitrarily, if not unwittingly, since Morningstar assigns 5 stars to only about 1-in-17 funds. Neither of the two over-lapping funds that appear on all three lists, DODFX and HABDX, have 5 stars. But both have a commendable 4 stars, and certainly, that’s good enough.

Lowering expectations a bit, how many funds appear on at least two of these lists? The answer: 38, excluding the two trifectas. Vanguard dominates with 14. T. Rowe Price and American Funds each have 4. Fidelity has just one. Most have 4 stars, a few have 3, like SLASX, probably the scariest.

But there is no Artisan. There is no Tweedy. There is no Matthews. There is no TCW or Doubleline. There are no PIMCO bond funds. (Can you believe?) There is no Yacktman. Or Arke. Or Sequoia. There are no funds less than five years old. In short, there’s a lot missing.

There are, however, nine 5-star funds among the 38, or just about 1-in-4. That’s not bad. Interestingly, not one is a fixed income fund, which is probably a sign of the times. Here’s how they stack-up in MFO’s own “backward looking” ratings system, updated through September:

3q

Four are moderate allocation funds: FPACX, PRWCX, VWELX, and TRRBX. Three are Vanguard funds: VWELX, VDIGX, and VASVX. One FMI fund FMIHX and one Oakmark fund OAKIX. Hard to argue with any of these funds, especially the three Great Owls: PRWCX, VWELX, and OAKIX.

These lists of “best funds” are probably not a bad place to start, especially for those new to mutual funds. They tend to expose investors to many perfectly acceptable, if more mainstream, funds with desirable characteristics: lower fees, experienced teams, defensible, if not superior, past performance.

They probably do not stress downside potential enough, so any selection needs to also take risk tolerance and investment time-frame into account. And, incredulously, Morningstar continues to give Gold ratings to loaded funds, about 1-in-7 actually.

The lists produce surprisingly little overlap, perhaps simply because there are a lot of funds available that satisfy the broad screening criteria. But within the little bit of overlap, one can find some very satisfying funds.

 Money 70 and Kiplinger 25 are free and online. Morningstar’s rated funds are available for a premium subscription. (Cheapest path may to subscribe for just one month each year at $22 while performing an annual portfolio review.)

As for a list of smaller, less well known mutual funds with great managers and intriguing strategies? Well, of course, that’s the niche MFO aspires to cover.

23Oct2013/Charles

Permanent Loss of Capital

By Charles Boccadoro

Originally published in November 1, 2013 Commentary

The father of value investing, Benjamin Graham, employed the concept of “Margin of Safety” to minimize risk of permanent loss. His great student, Warren Buffett, puts it like this: “Rule No. 1: never lose money; rule No. 2: don’t forget rule No. 1.”

Zachary Wydra, portfolio manager of the 5-star Beck Mack & Oliver Partners (BMPEX) fund, actually cited Mr. Buffett’s quote during the recent MFO conference call.

But a look at Berkshire Hathaway, one of the great stocks of all time, shows it dropped 46% between December 2007 and February of 2009. And, further back, it dropped about the same between June 1998 and February 2002. So, is Mr. Buffett not following his own rule? Similarly, a look at BMPEX shows an even steeper decline in 2009 at -54%, slightly worse than the SP500.

The distinction, of course, is that drawdown does not necessarily mean loss, unless one sells at what is only a temporary loss in valuation – as opposed to an unrecoverable loss, like experienced by Enron shareholders. Since its 2009 drawdown, BMPEX is in fact up an enviable 161%, beating the SP500 by 9%.

Robert Arnott, founder of Research Associates, summarizes as follows: “Temporary losses of value are frequent; at times they can become so frightening that they become permanent—for those that sell.” Distinguishing between temporary drawdown and permanent loss of capital (aka “the ultimate risk”) is singularly the most important, if unnerving, aspect of successful value investing.

Mr. Wydra explains his strategy is to target stocks that have an upside potential over the next three years of at least 50% and will not lose value over that time. Translation: “loss,” as far as BMPEX is concerned, equates to no drawdown over a three year period. A very practical goal indeed, since any longer period would likely not be tolerated by risk adverse investors.

And yet, it is very, very hard to do, perhaps even impossible for any fund that is primarily long equities.

Here is downside SP500 total return performance looking back about 52 years:

sp5003yr

It says that 3-year returns fall below zero over nearly 30% of the time….and fall below 20% nearly half of that time. If we compare returns against consumer price index (CPI), the result is even worse. But for simplicity (and Pete’s) sake, we will not. Fact is, over this time frame, one would need to have invested in the SP500 for nearly 12 years continuously to guarantee a positive return. 12 years!

How many equity or asset allocation funds have not experienced a drawdown over any three year period? Very few. In the last 20 years, only four, or about 1-in-1000. Gabelli ABC (GABCX) and Merger (MERFX), both in the market neutral category and both focused on merger arbitrage strategies. Along with Permanent Portfolio (PRPFX) and Midas Perpetual Portfolio (MPREX), both in the conservative allocation category and both with large a percentage of their portfolios in gold. None of these four beat the SP500. (Although three beat bonds and GABCX did so with especially low volatility.)

nodrawdown
So, while delivering equity-like returns without incurring a “loss” over a three year period may simply prove too high a goal to come true, it is what we wish was true.

29Oct2013/Charles