Category Archives: Charles

Meb Faber Podcast

By Charles Boccadoro

mebfaber_podcast

Meb recently debuted his new podcast about investing with the same casual, refreshing, and insightful perspective we’ve come to respect and appreciate, since first profiling him in May 2014 with The Existential Pleasures of Engineering Beta.  

The podcast is definitely worth tuning into. The first five episodes are now on iTunes, available for free. You can subscribe here. They are:

  1. Global Asset Allocation – Investing 101
  2. Patrick O’Shaughnessy – An Unexpected Drop-in from Patrick O’Shaughnessy
  3. Jeff Remsburg – Where Are the Best Global Values Right Now?
  4. Wes Gray – “Even God Would Get Fired as an Active Investor”
  5. EJared Dillian – “If You Think 2016 is the Opposite of 1981, then You Should Do the Opposite”

Material referenced during the podcast is nicely provided on Meb’s website, like here from Episode 1. 

On Financial Planners

By Charles Boccadoro

A family friend recently asked me to look at his mutual fund investments. He contributes to these investments periodically through his colleague, a Certified Financial Planner at a long-time neighborhood firm that provides investment services. The firm advertises it’s likely more affordable than other firms thanks to changes in how clients are billed, so it does not “charge hefty annual advisor fees of 1% or more.”

I queried the firm and planner on FINRA’s BrokerCheck site and fortunately found nothing of concern. FINRA stands for Financial Industry Regulatory Authority and is a “not-for-profit organization authorized by Congress to protect America’s investors by making sure the securities industry operates fairly and honestly.”

A couple recent examples of its influence: FINRA Fines Raymond James $17 Million for Systemic Anti-Money Laundering Compliance Failures and FINRA Sanctions Barclays Capital, Inc. $13.75 Million for Unsuitable Mutual Fund Transactions and Related Supervisory Failures.

The BrokerCheck site should be part of the due-diligence for all investors. Here for example is the type of allegations and settlements disclosed against the firm Edward Jones in 2015: “The firm was censured and agreed to pay $13.5 million including interest in restitution to eligible customers … that had not received available sales charge waivers … since 2009, approximately 18,000 accounts purchased mutual fund shares for which an available sales charge waiver was not applied.”

And, here an example of experience listed for an “Investment Adviser Representative” …

ej_qual

But I’m getting sidetracked, so back to my friend’s portfolio review.  Here’s what I found:

  • He has 5 separate accounts – 2 Traditional IRAs, 2 Roth IRAs, and one 529.
  • All mutual funds are American Funds, accessed directly through American Funds website.
  • He owns 34 funds, across the 5 accounts.
  • Adjusting for different share classes (both front-loaded A, and back-loaded B … no longer offered), he owns 8 unique funds.
  • The 8 “unique” funds are not all that unique. Many hold the very same stocks. Amazon was held in 6 different funds. Ditto for Phillip Morris, Amgen, UnitedHealth Group, Home Depot, Broadcom, Microsoft, etc.
  • The 8 funds are, in order of largest allocation (A class symbols for reference): Growth Fund of America (AGTHX), Capital World Growth & Income (CWGIX), Capital Income Builder (CAIBX), American Balanced (ABALX), AMCAP (AMCPX), EuroPacific Growth (AEPGX), New Perspective (ANWPX), and New Economy (CNGAX).

After scratching my head a bit at the sheer number of funds and attendant loads, annual expense ratios, and maintenance fees, I went through the exercise of establishing a comparable portfolio using only Vanguard index funds.

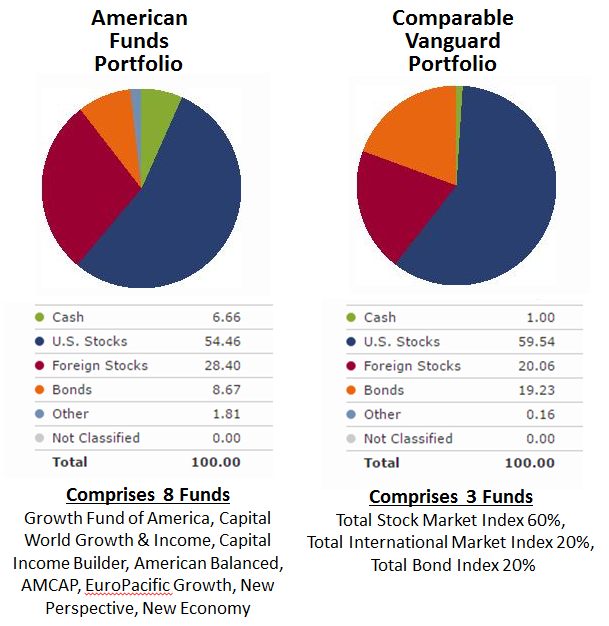
I used Morningstar’s asset allocation tool to set allocations, as depicted below. Not exact, but similar, while exercising a desire to minimize number of funds and maintain simple allocations, like 60/40 or 80/20. I found three Vanguard funds would do the trick: Total Stock Market Index 60%, Total International Market Index 20%, and Total Bond Index 20%.

af_vanguard_alloc

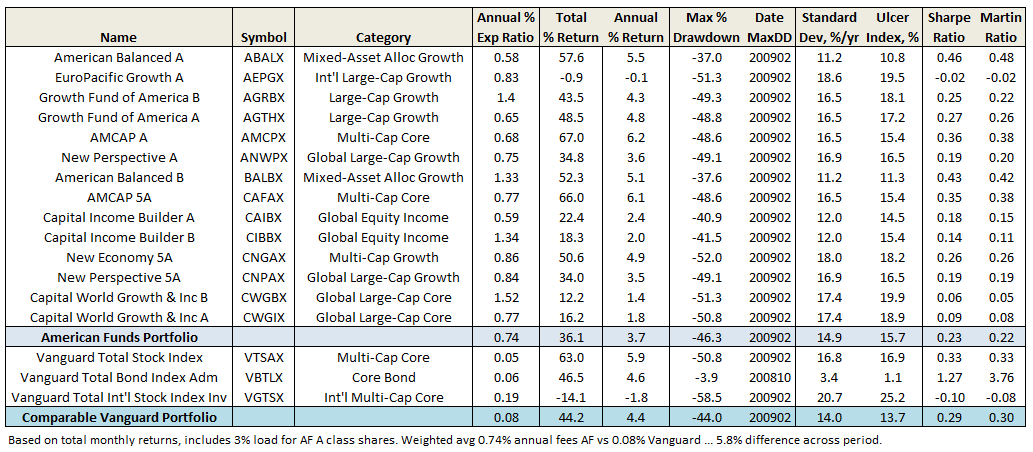
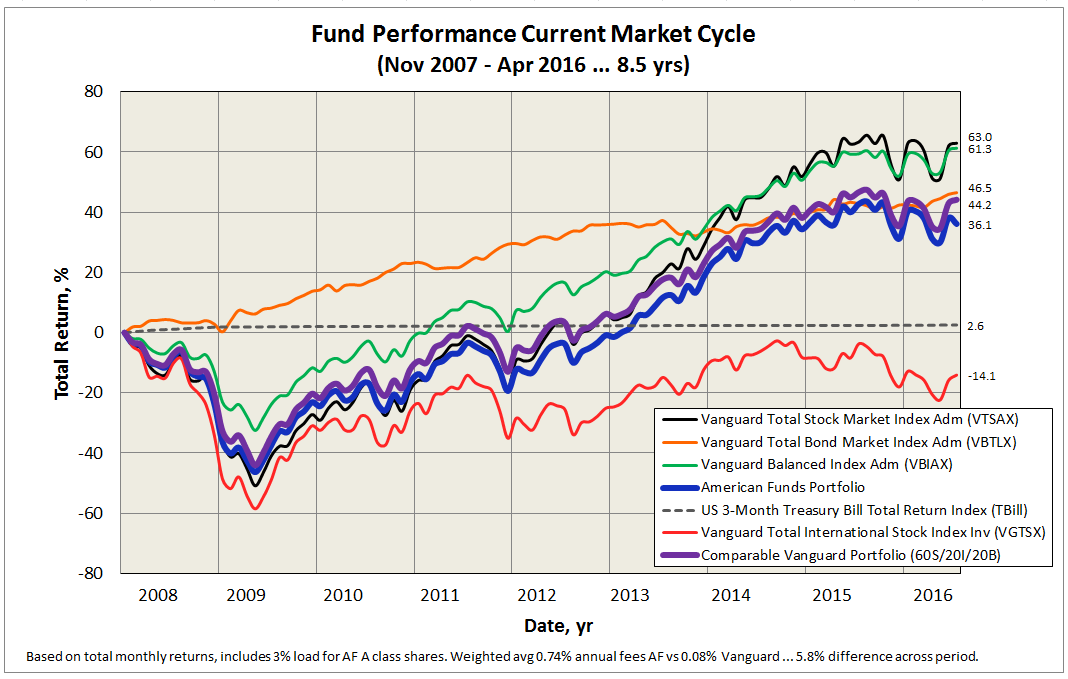
The following table and corresponding plot shows performance since November 2007, start of current market cycle, through April 2016 (click on image to enlarge):

af_vanguard_table_comparable af_vanguard_comparable

As Mr. Buffet would be quick to point out, those who simply invested in the Total Stock Market Index fund received the largest reward, if suffering gut-wrenching drawdown in 2009. The Total Bond Index rose rather steadily, except for brief period in 2013. The 60/40 Balanced Index performed almost as well as the Total stock index, with about 2/3 the volatility. Suspect such a fund is all most investors ever need and believe Mr. Bogle would agree. Similarly, the Vanguard founder would not invest explicitly in the Total International Stock fund, since US S&P 500 companies generate nearly half their revenue aboard. Over this period anyway, underperformance of international stocks detracted from each portfolio.

The result appears quite satisfying, since returns and volatility between the two portfolios are similar. And while past performance is no guarantee of future performance, the Vanguard portfolio is 66 basis points per year cheaper, representing a 5.8% drag to the American Funds’ portfolio over an 8.5 year period … one of few things an investor can control. And that difference does not include the loads American Funds charges, which in my friend’s case is about 3% on A shares.

My fear, of course, is that while this Certified Financial Planner may not directly “charge hefty annual advisor fees,” my friend is being directed toward fee-heavy funds with attendant loads and 12b-1 expenses that indirectly compensate the planner.

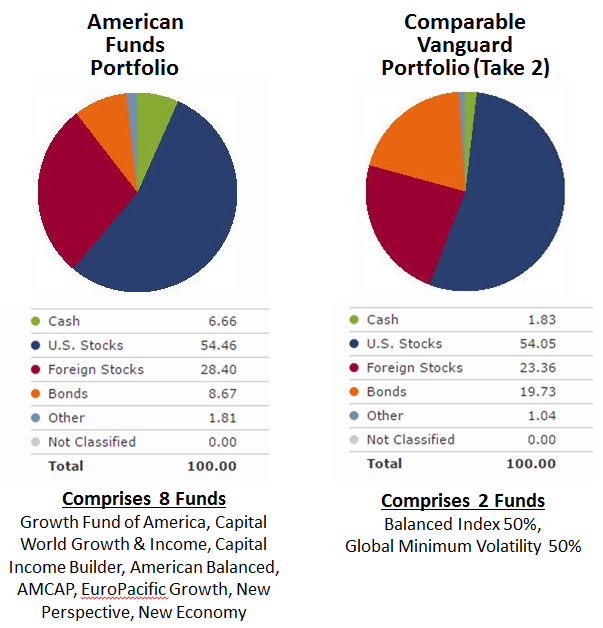
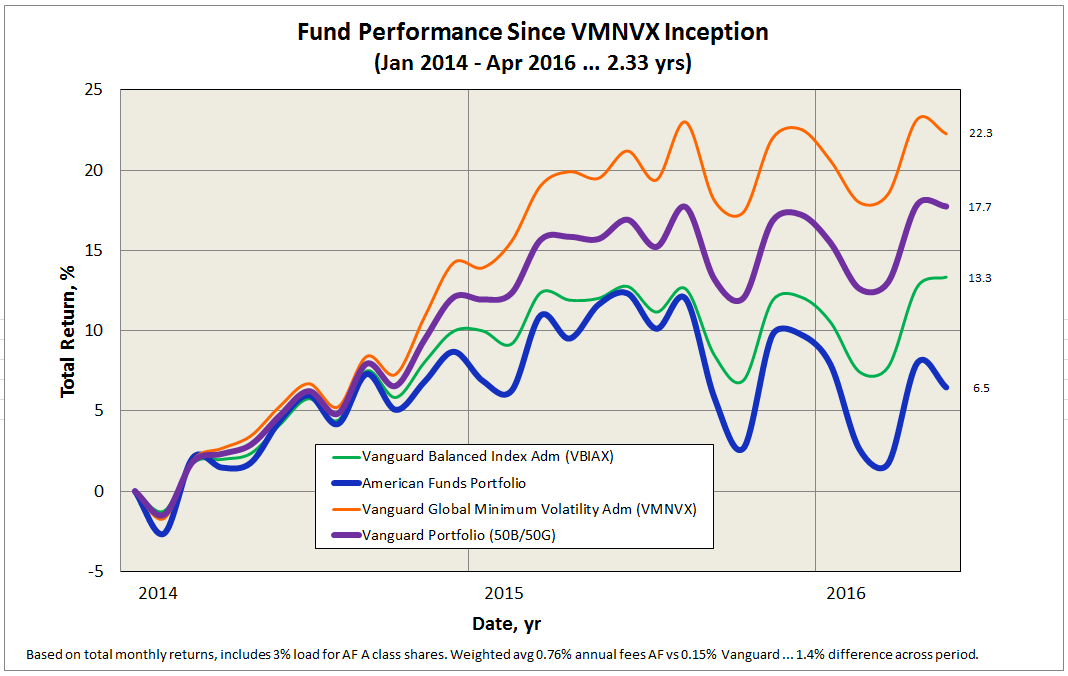
Inspired by David’s 2015 review of Vanguard’s younger Global Minimum Volatility Fund (VMVFX/VMNVX) I made one more attempt to simplify the portfolio even more and reduce volatility, while keeping global exposure similar. This fund’s 50/50 US/international stock split combined with the 60/40 stock/bond split of the Vanguard Balanced Fund, produces an even more satisfying allocation match with the American Funds portfolio. So, just two funds, each held at 50% allocation.

Here is updated allocation comparison: 

af_vanguard_alloc_2

And here are the performance comparison summary table and plot from January 2014 through April 2016, or 2.33 years (click image to enlarge):

af_vanguard_table_comparable_2

af_vanguard_comparable_2

I should note that the Global Volatiliy Fund is not an index fund, but actively managed by Vanguard’s Quantitative Equity Group, so this portfolio is also 50/50 passive/active. While the over-performance may temper, lower volatility will persist, as will the substantially lower fees.

Other satisfying aspects of the two comparable Vanguard portfolios are truly unique underlying holdings in each fund and somewhat broader exposure to value and mid/small cap stocks. Both these characteristics have shown over time to deliver premiums versus growth and large cap stocks.

Given the ease at which average investors can obtain and maintain mutual fund portfolios at Vanguard, like those examined here, it’s hard to see how people like my friend will not migrate away from fee-driven financial planners that direct clients to fee-heavy families like American Funds.

Fund Family Scorecard

By Charles Boccadoro

Originally published in May 1, 2016 Commentary

We started looking at fund family performance two years ago, first in June 2014 commentary with How Good Is Your Fund Family?, and then An Update in May 2015.

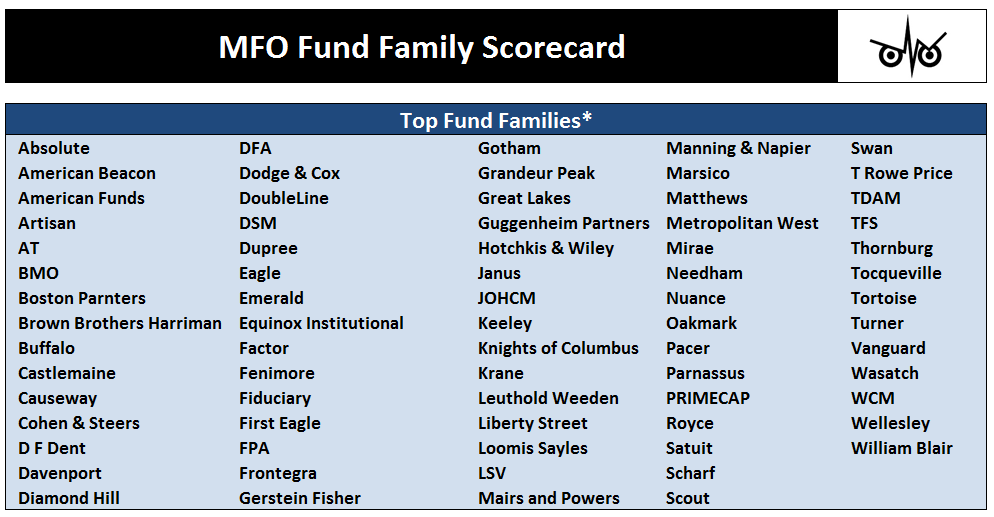
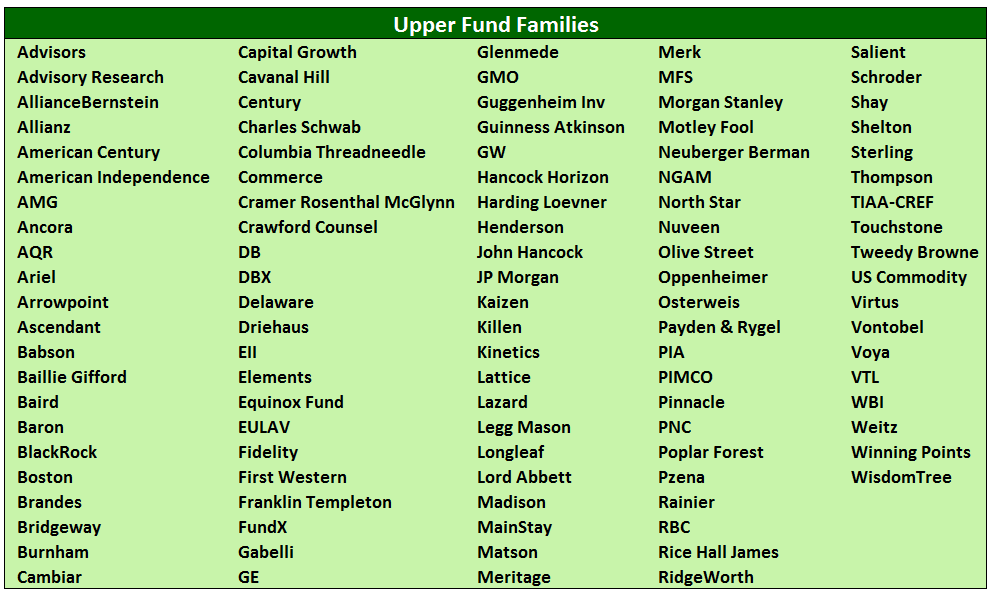
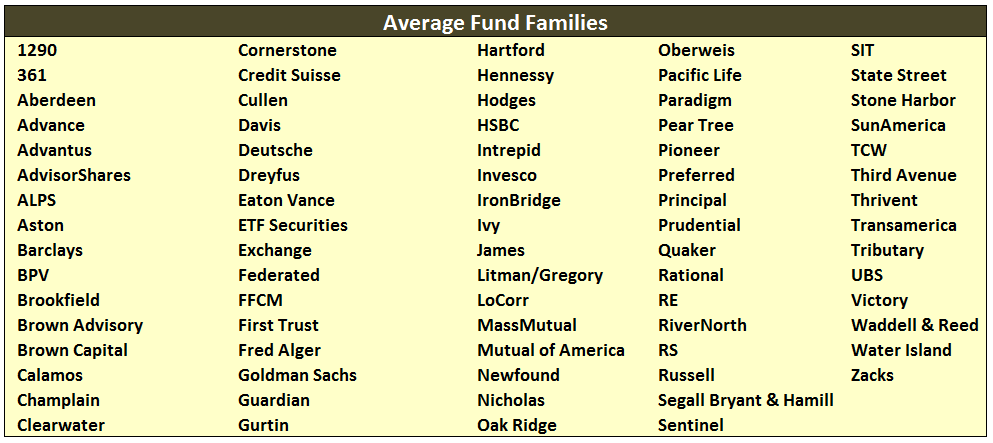
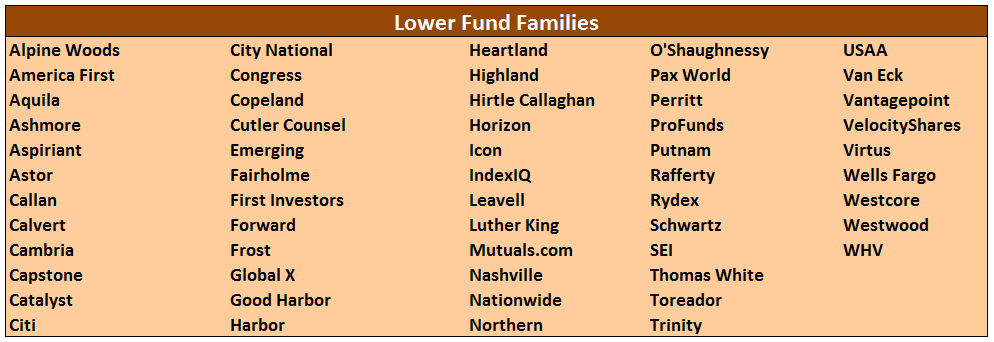
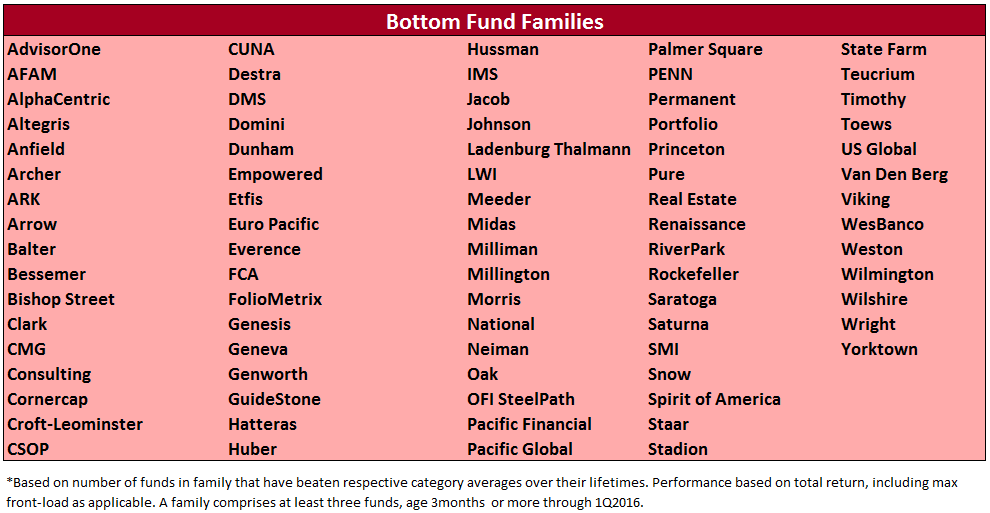
Below please find our MFO Family Fund Scorecard for May 2016, which reflects fund performance through 1st quarter. As a reminder, the card measures how well each fund in a family has performed against its peers since inception (or at least back to January 1960, which starts our Lipper database). Performance is absolute total return, reflecting reinvested dividends, but inclusive of fees and maximum front load, if applicable. The card groups families by quintile. (Download pdf version here.)

family_1cfamily_2family_3family_4family_5

Some changes to methodology since last year:

  • Categories now reflect those used by Lipper versus Morningstar, as discussed in Comparing Lipper Ratings. Similarly, all categories except money market are included, even so-called trading categories.
  • Reduced from five to three the number of funds required to comprise a “fund family.” These changes respond to reader feedback from last year’s score card (eg., Where’s PRIMECAP?).
  • Reduced from three years to just three months the minimum age for evaluation. Reasoning here being the desire to get heads-up of which young families are beating their peers out of the gate (eg., Grandeur Peak).

The result is about 400 “fund families,” or more precisely fund management companies; distilled from the 9,350 funds overall, oldest share class only.

We recognize the card is flawed from the start. Results can be skewed by multiple factors, including survivorship-bias, share class differences, “improper” categorization, adviser and fund ownership changes, multiple sub-advisers, and inconsistent time frames … three months is too short to matter, lifetime is too long to care.  Flaws notwithstanding, there is value in highlighting families that, for example, have not had a single fund beat its category average since inception. Like our legacy Three Alarm designation, prospective investors should ask: Why is that?

Take Saratoga Capital Management who is celebrating 20 years and offers a line-up of mutual funds as “The Portfolios of the Saratoga Advantage Trust.” From its brochure: “There are over 22,000 investment management firms in the United States. How do you choose the right one? Research, research and more research.” Fourteen of the funds offered in its line-up are managed by Saratoga itself. Average age: 15.6 years. How many have beaten average return in their respective categories? None. Zero. 0.

saratoga

Fact is all seventeen funds in the Saratoga Advantage line-up have underperformed category average since inception. Why is that?

On a more positive note, a closer look at a couple groupings …

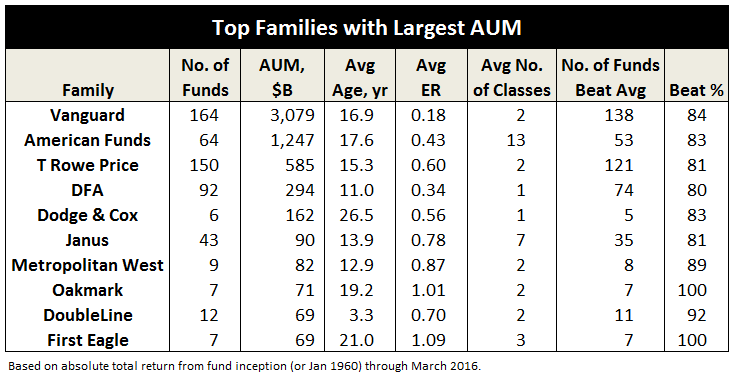
Good to see: Vanguard heads list of Top Families with Largest Assets Under Management (AUM), along with other shareholder friendly firms, like Dodge & Cox.

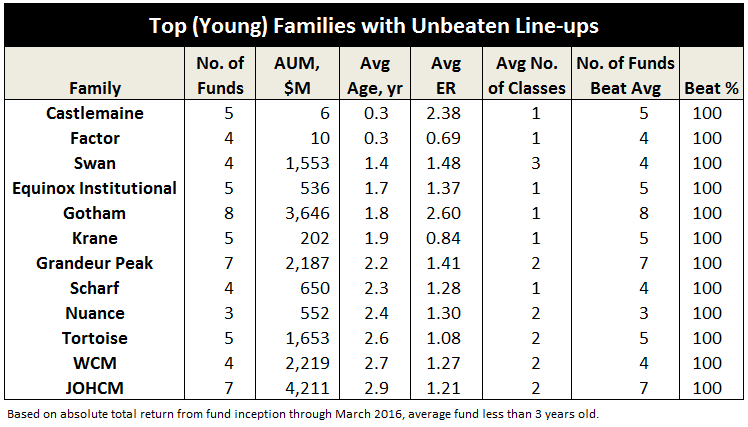
top_aumAnd, a nod to the young and unbeaten … a short list of top families where every fund beats its category average.

young_unbeaten_a

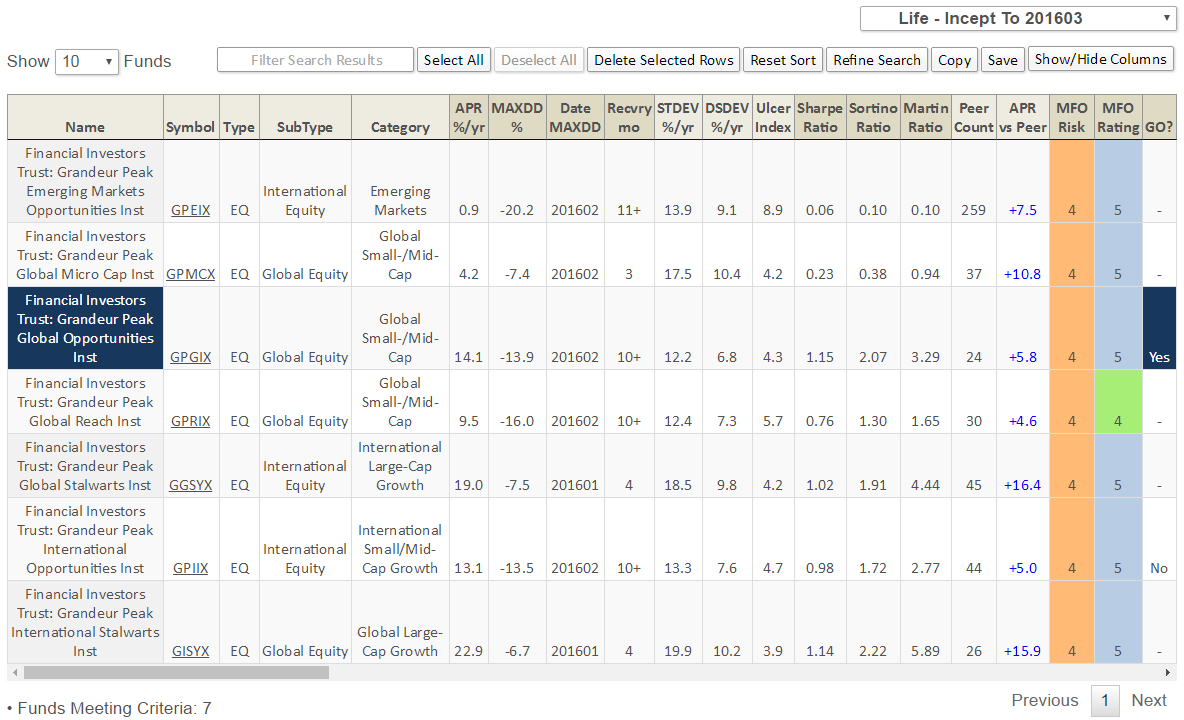
Gotham is led by renowned investor Joel Greenblatt. As for Grandeur Peak, David has been an outspoken champion since its inception. Below are its MFO Ratings (click image to enlarge):

grandeur

MFO Fund Family Scorecard will soon be a regular feature on our Premium site, updated monthly, with downloadable tables showing performance and fund information for all families, like average ER, AUM, load, and shares classes.

Share Classes

By Charles Boccadoro

Originally published in April 1, 2016 Commentary

Last month, David Offered Without Comment: Your American Funds Share Class Options. The simple table showing 18 share classes offered for one of AF’s fixed income funds generated considerable comment via Twitter and other media, including good discussion on the MFO Discussion Board.

We first called attention to excessive share classes in June 2014 with How Good Is Your Fund Family?  (A partial update was May 2015.) American Funds topped the list then and it remains on top today … by far. It averages more than 13 share classes per unique fund offering.

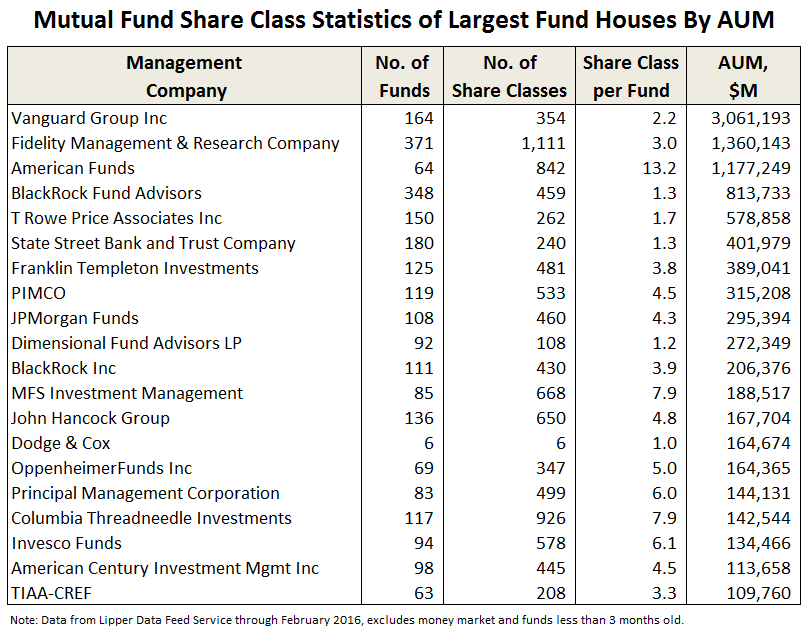
The following table summarizes share class stats for the largest 20 fund management companies by assets under management (AUM) … through February 2016, excluding money market and funds less than 3 months old.

share_classes_1

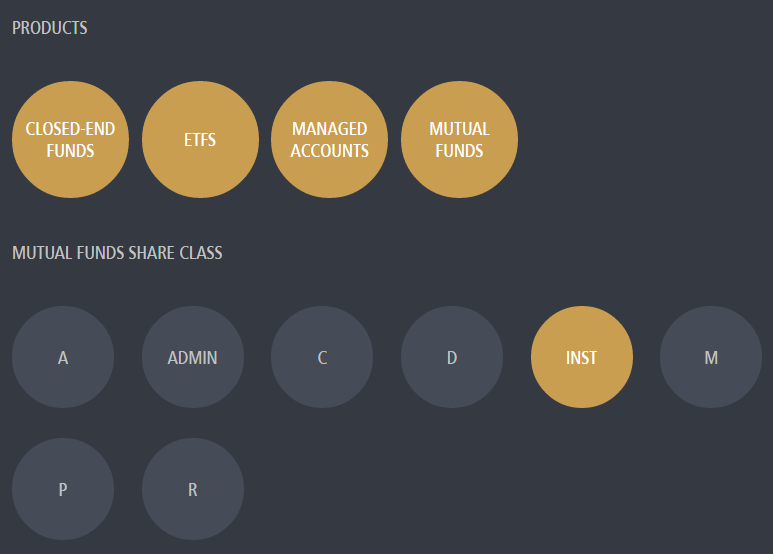
At the end of the day, share classes represent inequitable treatment of shareholders for investing in the same fund. Typically, different share classes reflect different expense ratios depending on initial investment amount, load or transaction fee, or association of some form, like certain 401K plans. Here’s a link to AF’s web page explaining Share Class Pricing Details. PIMCO’s site puts share class distinction front and center, as seen in its Products/Share Class navigator below, a bit like levels of airline frequent flyer programs:

share_classes_2

We’ve recently added share class info to MFO Premium’s Risk Profile page. Here’s an example for Dan Ivascyn’s popular Income Fund (click on image to enlarge):

share_classes_3

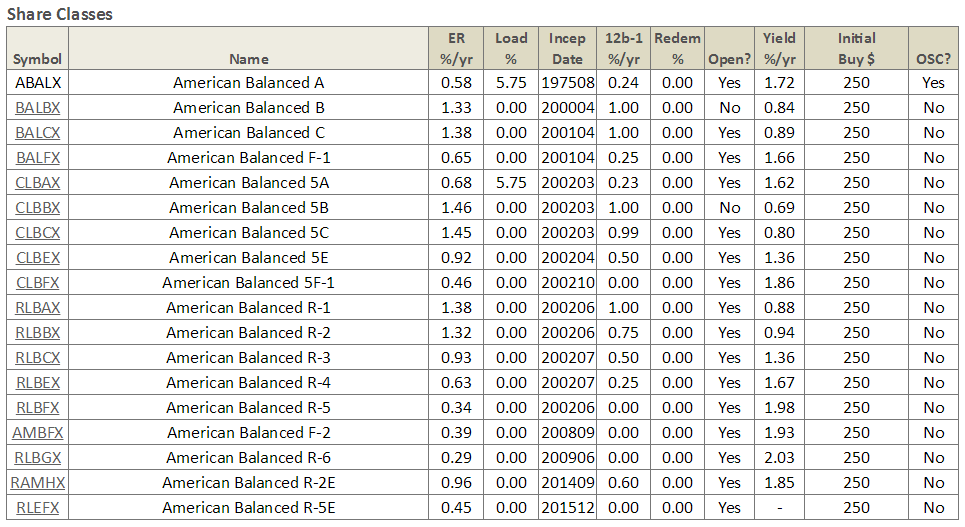
In addition to the various differences in 12b-1 fee, expense ratio (ER), maximum front load, and initial purchase amount, notice the difference in dividend yield. The higher ER of the no-load Class C shares, for example, comes with an attendant reduction in yield. And, another example, from AF, its balanced fund:

share_classes_4

Even Vanguard, known for low fees and equitable share holder treatment, provides even lower fees to its larger investors, via so-called Admiral Shares, and institutional customers. Of course, the basic fees are so low at Vanguard that the “discount” may be viewed more as a gesture.

share_classes_5

The one fund company in the top 20 that charges same expenses to all its investors, regardless of investment amount or association? Dodge & Cox Funds.

We will update the MFO Fund House Score Card in next month’s commentary, and it will be updated monthly on the MFO Premium site.

MFO Rating Metrics

By Charles Boccadoro

Originally published in March 1, 2016 Commentary

When MFO introduced its rating system in June of 2013, it chose Martin Ratio as the principal performance rating metric. Martin is a risk adjusted return metric that is the ratio between excess return, which is the compounded annualized total return above risk free T-Bill return, divided by the so-called Ulcer Index, which is a measure of extent and duration of drawdown. Our friend Peter Matin formulated the Ulcer Index as described in An Alternative Approach to the Measurement of Investment Risk & Risk-Adjusted Performance.

For each fund category, like Large Growth or Moderate Allocation, the MFO Rating system divides funds into five groups or “quintiles” based on the risk adjusted return over selected evaluation periods. Funds with the highest Martin in each category are assigned a 5, while those with the lowest receive a 1.

While this approach suits many MFO readers just fine, especially having lived through two 50 percent equity market drawdowns in the past 15 years, others like Investor on the MFO Discussion Board, were less interested in risk adjusted return and wanted to see ratings based on absolute return. Others wanted to see ratings based on the more traditional risk adjusted Sharpe Ratio. (For more definitions, see A Look A Risk Adjusted Returns.)

It took a while, but subscribers on our MFO Premium site can now choose which rating metric they prefer, including multiple rating metrics simultaneously.

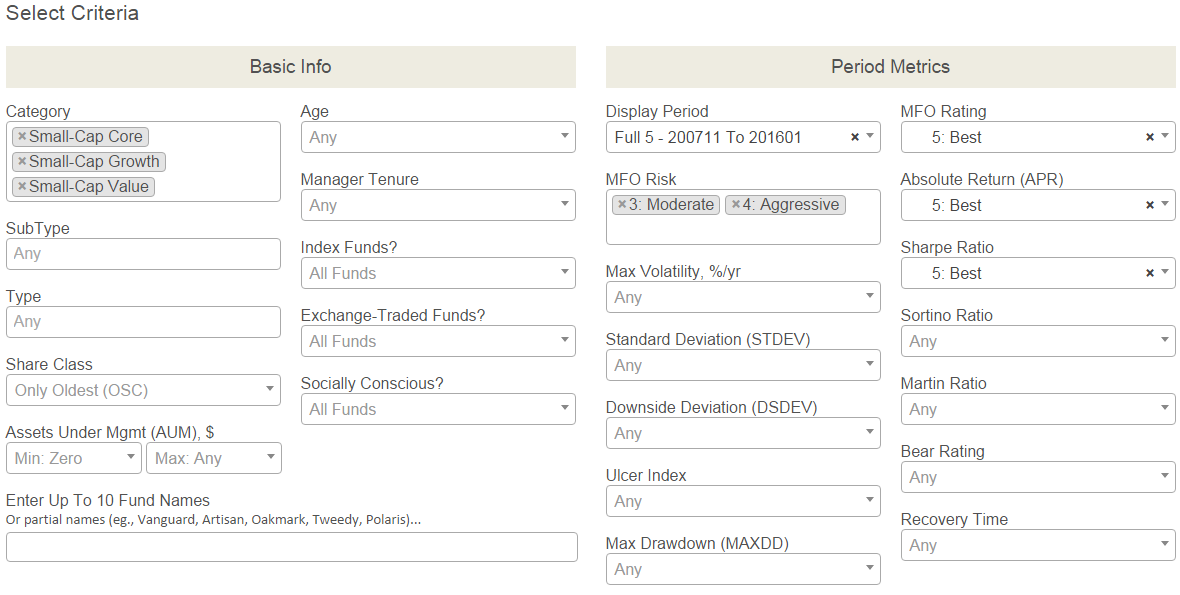
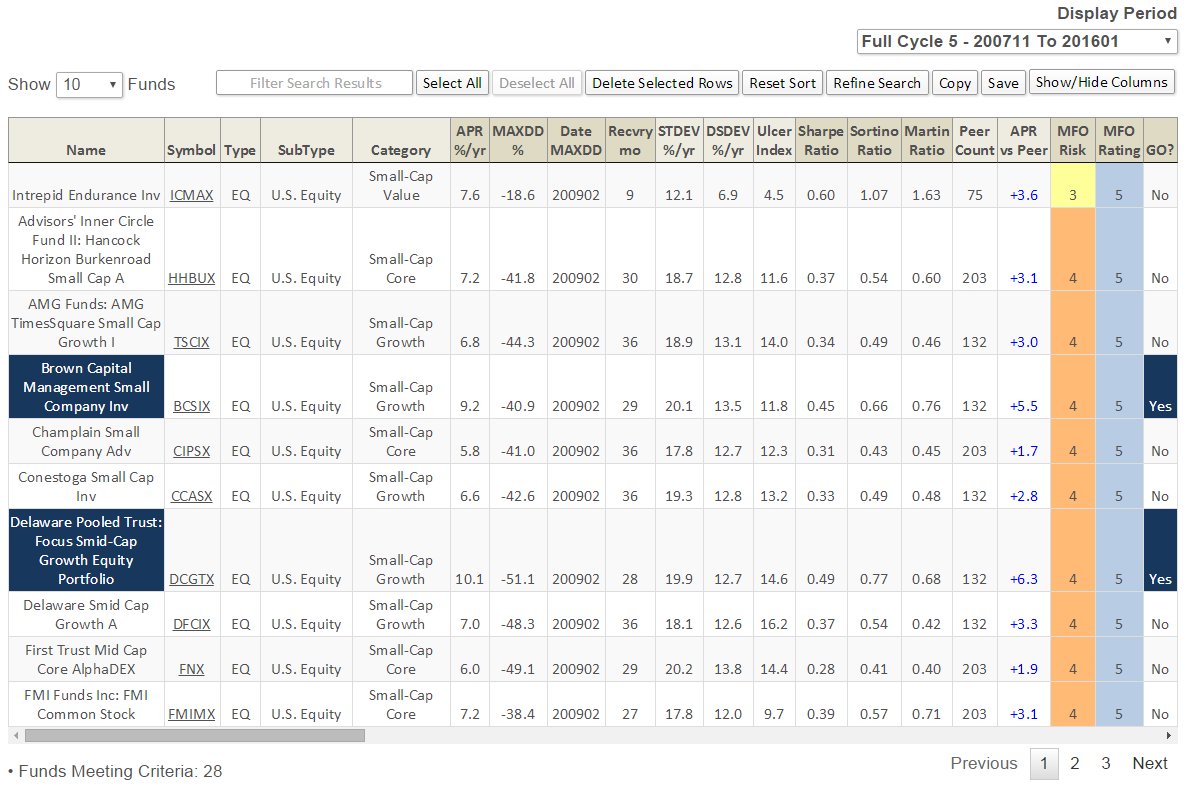
For example, since the start of the current market cycle in November 2007, which Small Cap funds have delivered the best absolute return (APR) and the best Martin Ratio and the best Sharpe Ratio? To find the answer, enter the selection criteria on the MFO MultiSearch tool, as depicted below (click image to enlarge), then hit the “Submit Search” button …

ratings_1A total of 28 funds appear from the more than 9,000 unique funds in the MFO database. Here are the first 10, sorted by MFO Risk and then name:

ratings_2Notables include Brown Capital Mgmt Small Company (BCSIX), Champlain Small (CIPSX), Conestoga Small Cap (CCASX), and FMI Common Stock (FMIMX). The closed BCSIX is both an MFO Great Owl and Fund Alarm Honor Roll fund. It is also a Morningstar Gold Medal fund, while Silver goes to CIPSX and CCASX.

Intrepid Endurance (ICMAX) has the lowest risk rating with a MFO Risk of 3, which means this fund has historically carried volatility suited for investors with Moderate risk tolerance. Unlike other metrics in the MFO ratings system, and in fact the risk metric in Morningstar’s rating system, which assign risk relative to other funds in category, the MFO Risk metric assigns its rating based on volatility relative to the overall market.

The MFO MultiSearch tool now enables searches using more than 55 screening criteria, organized by Basic Info, Period Metrics, Composite Period Metrics, MFO Designations, Portfolio Characteristics, and Purchase Info. A list of current criteria can be found here.

Smallest, Shortest, Lowest

By Charles Boccadoro

Originally published in February 1, 2016 Commentary

David invariably cuts to the chase when it comes to assessing mutual funds. It’s a gift he shares with us each month.

So, in evolving the MFO Premium site, he suggested we provide lists of funds satisfying interesting screening criteria to help users get the most from our search tools.

Last month we introduced two such lists: “Best Performing Rookie Funds” and “Dual Great Owl & Honor Roll Funds.”

This month our MultiSearch screener incorporates three more: “Smallest Drawdown Fixed Income Funds,” “Shortest Recovery Time Small Caps,” and “Lowest Ulcer Moderate Allocation Funds.”

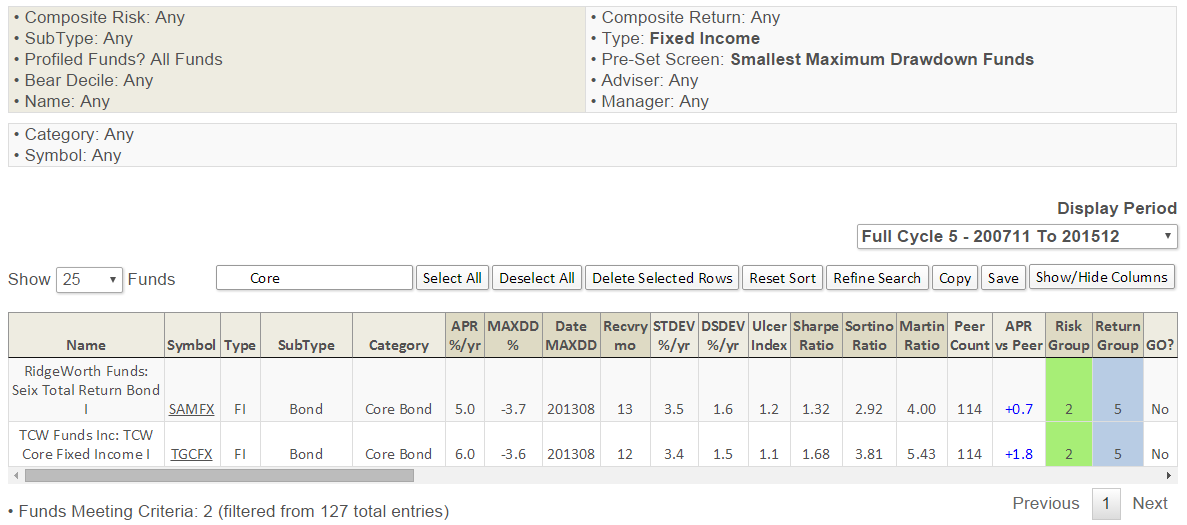
Smallest Drawdown Fixed Income Funds generates a list of Fixed Income (e.g., Bond, Muni) funds that have experienced the smallest levels of Maximum Drawdown (MAXDD) in their respective categories. More specifically, they are in the quintile of funds with smallest MAXDD among their peers.

Looking back at performance since the November 2007, which represents the beginning of the current full market cycle, we find 147 such funds. Two top performing core bond funds are TCW Core Fixed-Income (TGCFX) and RidgeWorth Seix Total Return (SAMFX). The screen also uncovered notables like First Pacific Advisors’ FPA New Income (FPNIX) and Dan Ivascyn’s PIMCO Income (PIMIX).

Here are some risk/return metrics for these Fixed Income funds (click on images to enlarge):

TCW Core Fixed-Income (TGCFX) and RidgeWorth Seix Total Return (SAMFX)
sls_1
First Pacific Advisors’ FPA New Income (FPNIX)
fpnix
PIMCO Income (PIMIX)
pimix_1
pimix_2

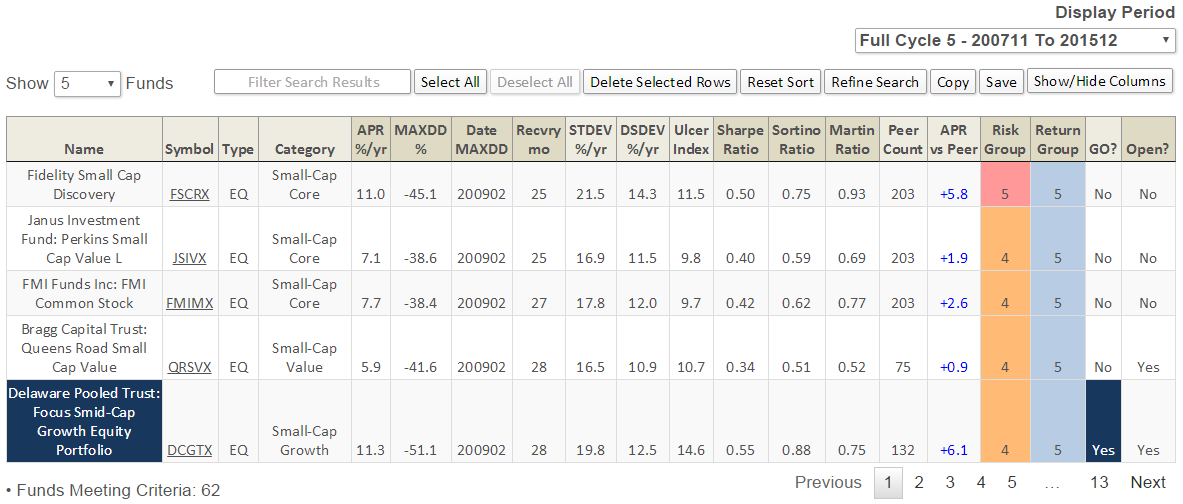
Shortest Recovery Time Small Caps generates a list of Small Cap (Small Core, Small Value, Small Growth) funds that have incurred shortest Recovery Times (number of months a fund retracts from previous peak) in their respective categories.

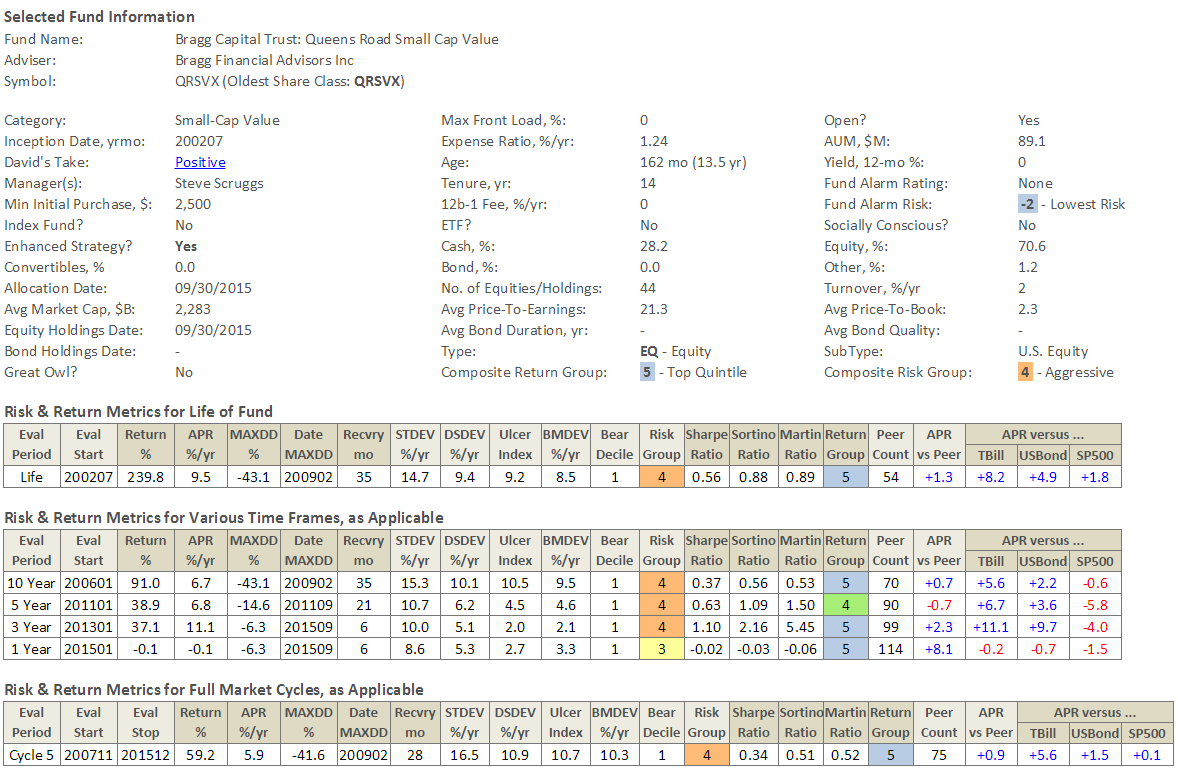
For Full Cycle 5, this screen produces 62 such funds through December 2015. Among the best performing funds with shortest Recovery Times, under 30 months, only one remains open and/or accessible: Queens Road Small Cap Value (QRSVX). It was profiled by David in April 2015.

Here’s a short list and risk/return numbers for QRSVX across various timeframes:
sls_2

Queens Road Small Cap Value (QRSVX)

qrsvx
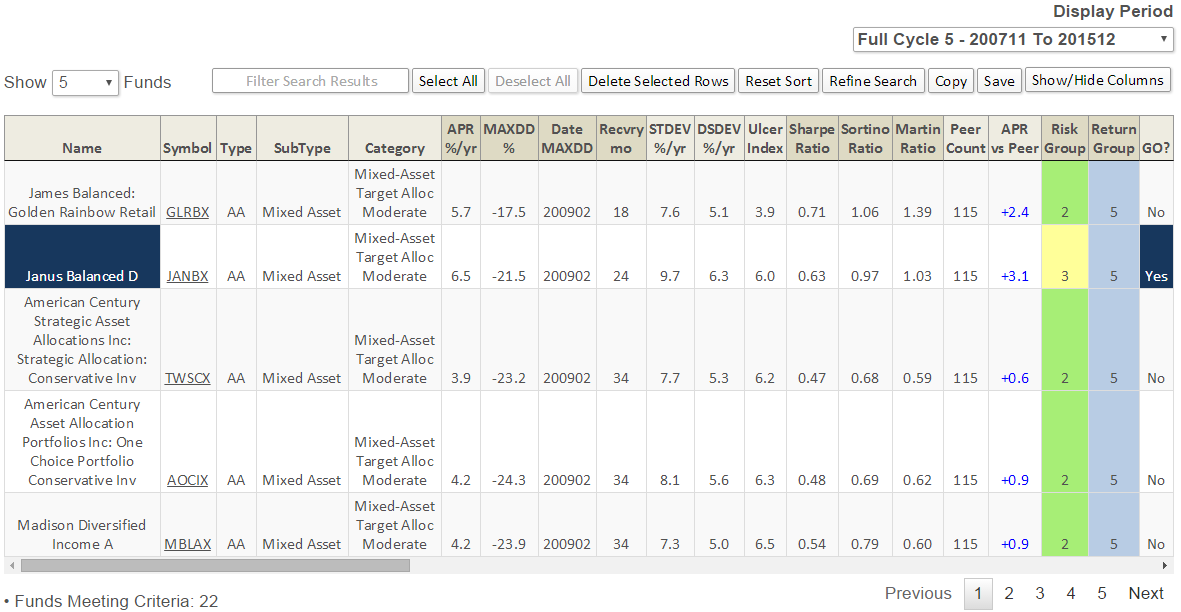
Lowest Ulcer Moderate Allocation Funds
 generates a list of Mixed Asset Moderate Allocation funds that have incurred the lowest Ulcer Indices in their respective categories. 

Topping the list (fund with lowest UI) is James Balanced: Golden Rainbow (GLRBX), profiled last August :
sls_3

Premium Site Update

By Charles Boccadoro

Originally published in January 1, 2016 Commentary

New to MFO Premium this month are several additions to the MultiSearch Tool, which now can screen our monthly fund database with some 44 performance metrics and other parameters. (Here are links to current Input and Output MultiSearch Parameter Lists.) The new additions include SubType (a kind of super category), exchange-traded fund (ETF) flag, Profiled Funds flag, and some initial Pre-Set Screens.

SubType is a broad grouping of categories. Lipper currently defines 144 categories, excluding money market funds. MFO organizes them into 9 subtypes: U.S. Equity, Mixed Asset, Global Equity, International Equity, Sector Equity, Commodity, Alternative & Other, Bond, and Municipal Bond funds. The categories are organized further into broader types: Fixed Income, Asset Allocation, and Equity funds. The MultiSearch Tool enables screening of up to 9 categories, 3 subtypes, or 2 types along with other criteria.

The Profiled Funds flag enables screening of funds summarized monthly on our Dashboard (screenshot here). Each month, David (and occasionally another member of MFO’s staff), typically provides in-depth analysis of two to four funds, continuing a FundAlarm tradition. Through November 2015, 117 profiles are available on MFO legacy site Funds page. “David’s Take” precariously attempts to distill the profile into one word: Positive, Negative, or Mixed.

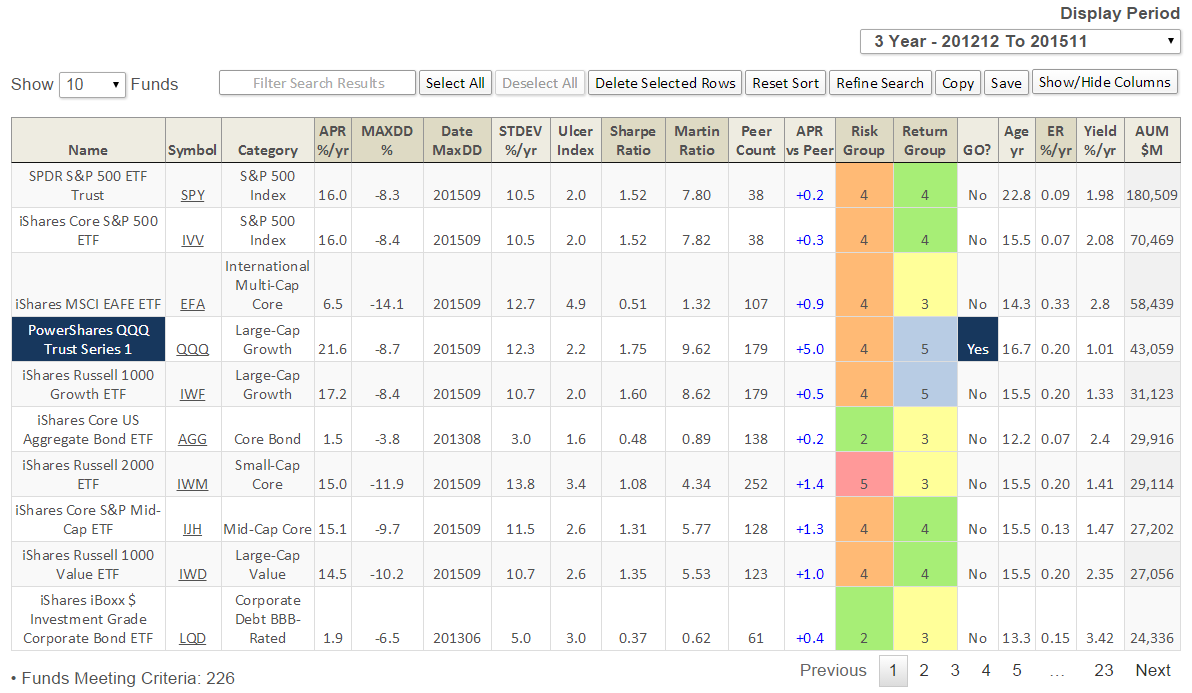
The ETF flag is self-explanatory, of course. How many ETFs are in our November database?  A lot! 1,716 of the 9,034 unique (aka oldest share class) funds we cover are ETFs, or nearly 19%. The most populated ETF subtype is Sector Equity with 364, followed by International Equity with 343, US Equity with 279, and Bonds with 264. At nearly $2T in assets under management (AUM), ETFs represent 12% of the market. Our screener shows 226 ETFs with more than $1B in AUM. Here is a summary of 3-year performance for top ten ETFs by AUM (click on image to enlarge):

update_1

The Pre-Set Screen option is simply a collection of screening criteria. The two initial screens are “Best Performing Rookie Funds” and “Both Great Owl and Honor Roll Funds.” The former generates a list of 160 funds that are between the age of 1 and 2 years old and have delivered top quintile risk adjusted return (based on Martin Ratio) since their inception. The latter generates a list of 132 funds that have received both our Great Owl distinction as well as Honor Roll designation. Here is a summary of 3-year performance for top ten such funds, again by AUM (click on image to enlarge) … it’s an impressive list:

update_2

Other Pre-Screens David has recommended include “moderate allocation funds with the best Ulcer Index, small caps with the shortest recovery times, fixed-income funds with the smallest MAXDD …” Stay tuned.

Along with the parameters above, new options were added to existing criteria in the MultiSearch Tool. These include 30, 40, and 50 year Age groups; a “Not Three Alarm” rating; and, a “0% Annual or More” Absolute Return setting.

Using the new “0% Annual or More” criterion, we can get a sense of how tough the past 12 months have been for mutual funds. Of the 8,450 funds across all categories at least 12 months old through November 2015, nearly 60% (4,835) returned less than 0% for the year. Only 36 of 147 moderate allocation funds delivered a positive return, which means nearly 75% lost money … believe it or not, this performance was worse than the long/short category.

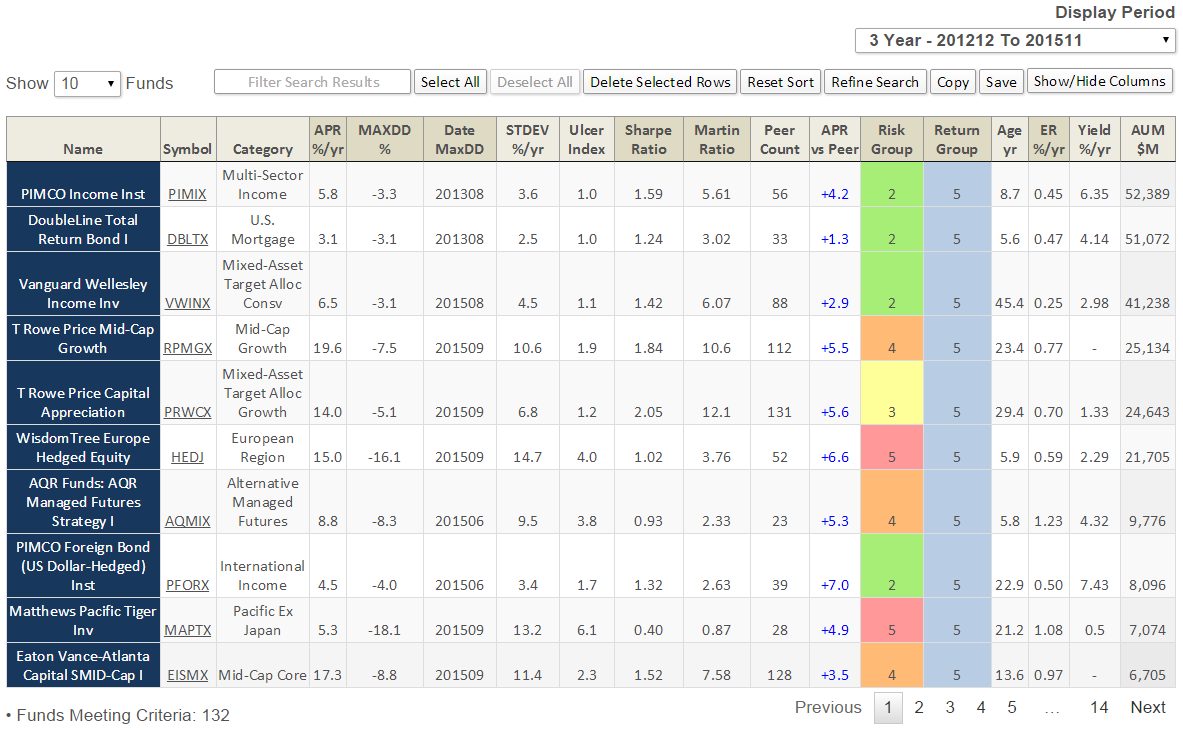
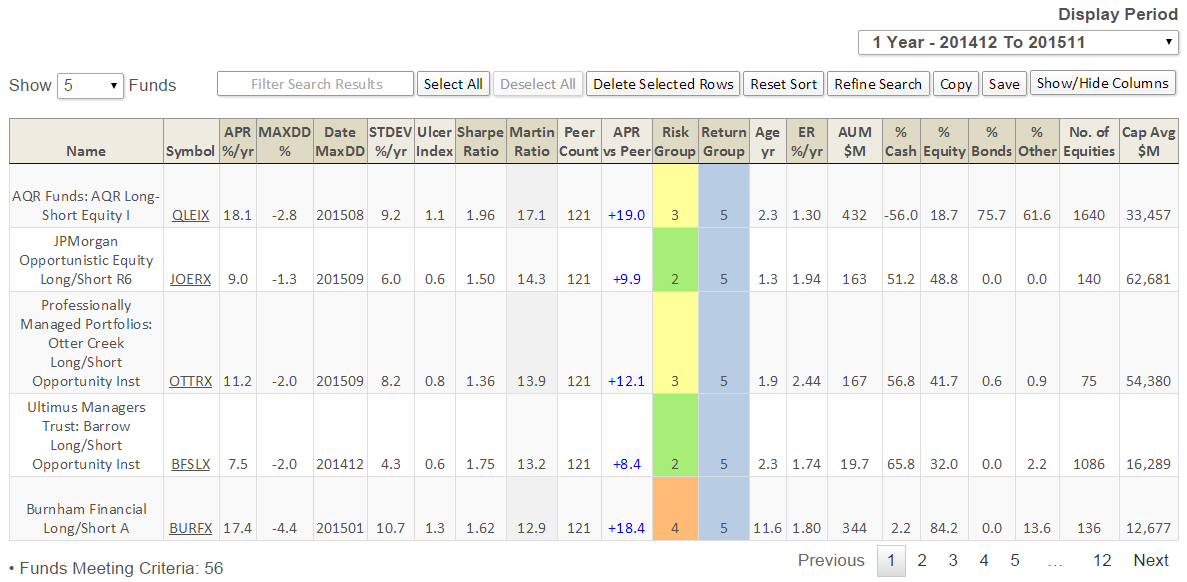
A closer look at the long/short category shows 56 of 121 funds delivered positive absolute return. Of those, here are the top five based on risk adjusted return (Martin Ratio) … click on image to enlarge:

update_3

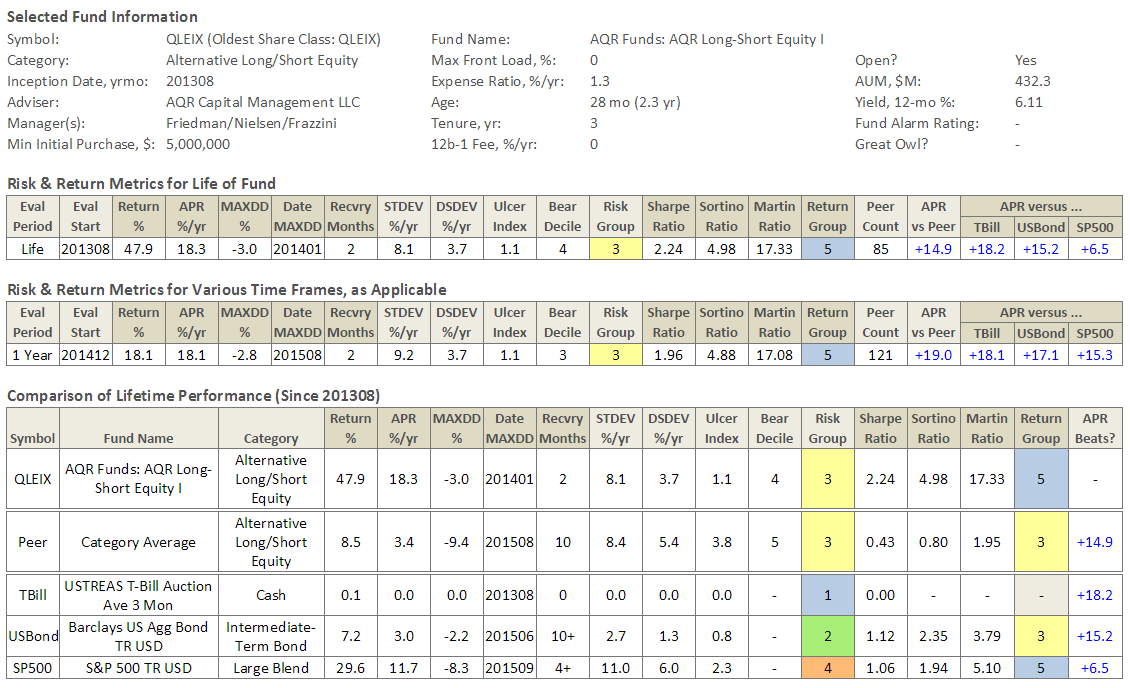
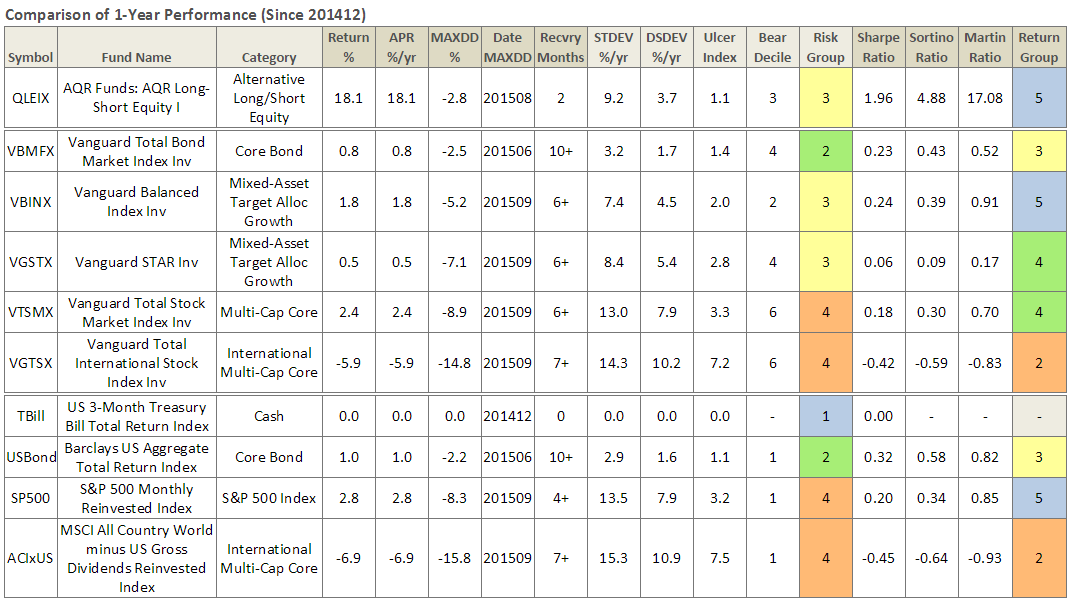
AQR’s rookie Long/Short Equity I (QLEIX) has been eye-watering since inception, as can be seen in its Risk Profile (click on images to enlarge):

update_4

update_5

While I’ve always been a fan of Cliff Asness and the strategies at AQR, I’m not a fan of AQR Funds, since experiencing unfriendly shareholder practices, namely lack of disclosure when its funds underperform … but nothing speaks like performance.

Whitebox Funds

I have also always been a fan of Andrew Redleaf and Whitebox Funds, which we featured in the March 2015 Whitebox Tactical Opportunities 4Q14 Conference Call and October 2013 Whitebox Tactical Opportunities Conference Call. David has remained a bit more guarded, giving them a “Mixed” profile in April 2013 Whitebox Market Neutral Equity Fund, Investor Class (WBLSX), April 2013.

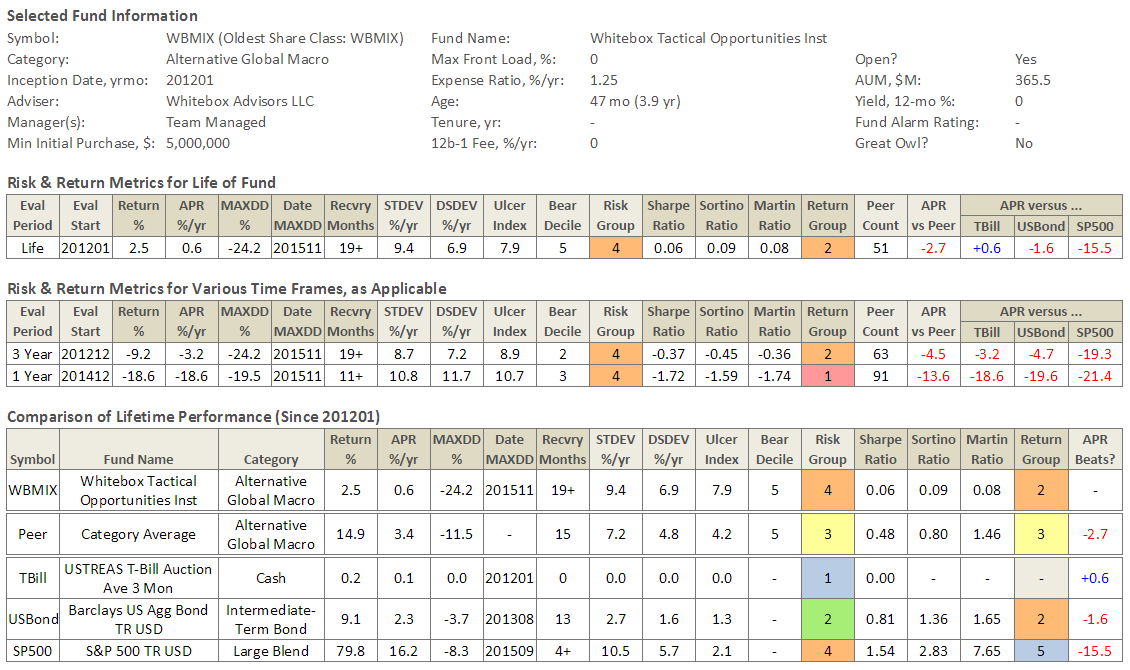
This past month the Minneapolis-based shop decided to close its three open-end funds, which were based on its hedge-fund strategies, less than four years after launch. A person familiar with the adviser offered:  “They were one large redemption away from exposing remaining investors to too great a concentration risk … so, the board voted to close the funds.” AUM in WBMIX had grown to nearly $1B, before heading south. According to the same person, Whitebox hedge funds actually attracted $2B additional AUM the past two years and that was where they wanted to concentrate their efforts.

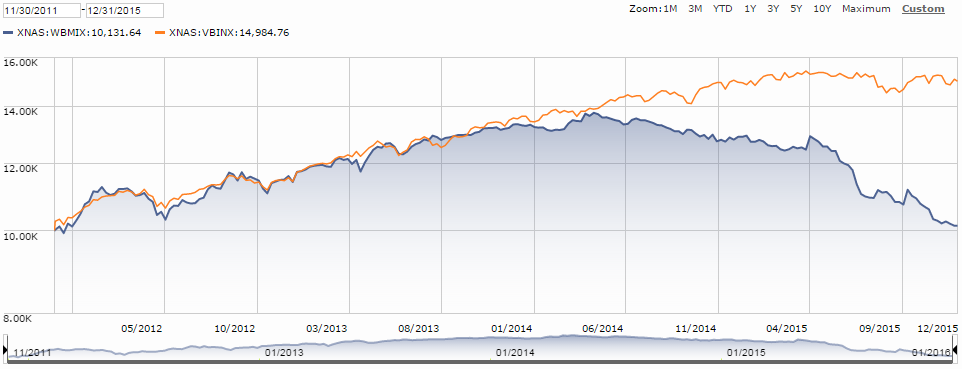
The fund enjoyed 28 months (about as long as QLEIX is old) of strong performance initially, before exiting the Mr. Market bus. Through November 2015, it’s incurred 19 consecutive months of drawdown and a decline from its peak of 24.2%. Depicting its rise and fall, here is a Morningstar growth performance plot of WBMIX versus Vanguard’s Balanced Fund Index (VBINX), as well as the MFO Risk Profile (click on images to enlarge):

update_6

update_7

Ultimately, Mr. Redleaf and company failed to deliver returns across the rather short life span of WBMIX consistent with their goal of “the best endowments.” Ultimately, they also failed to deliver performance consistent with the risk tolerance and investment timeframe of its investors. Ultimately and unfortunately, there was no “path to victory” in the current market environment for the fund’s “intelligent value” strategy, as compelling as it sounded and well-intended as it may have been.

As always, a good discussion can be found on the MFO Board Whitebox Mutual Funds Liquidating Three Funds, along with news of the liquidations.

Year-end MFO ratings will be available on or about 4th business day, which would be January 7th on both our premium and legacy sites.

Category Averages

By Charles Boccadoro

Originally published in December 1, 2015 Commentary

As promised, we’ve added a Category Averages tool on the MFO Premium page. Averages are presented for 144 categories across 10 time frames, including the five full market cycles period dating back to 1968. The display metrics include averages for Total Return, Annualized Percent Return (APR), Maximum Drawdown (MAXDD), MAXDD Recovery Time, Standard Deviation (STDEV, aka volatility), and MFO Risk Group ranking.

Which equity category has delivered the most consistently good return during the past three full market cycles? Consumer Goods. Nominally 10% per year. It’s also done so with considerably less volatility and drawdown than most equity categories.

averages1
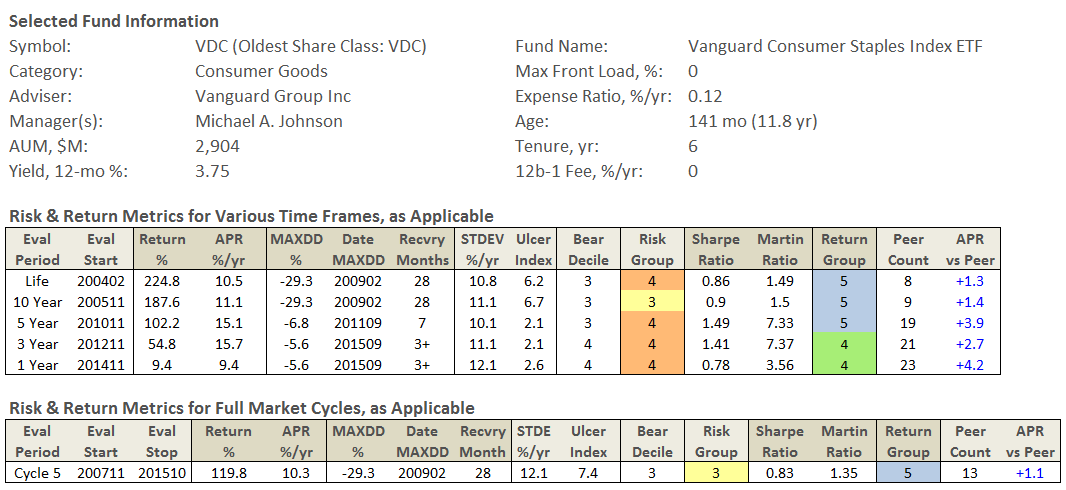
One of the lower risk established funds in this category is Vanguard Consumer Staples Index ETF VDC. (It is also available in Admiral Shares VCSAX.) Here are its risk and return numbers for various time frames:

averages2
The new tool also enables you to examine Number of Funds used to compute the averages, as well as Fund-To-Fund Variation in APR within each category.

Comparing Lipper Ratings

By Charles Boccadoro

lipper_logoOriginally published in November 1, 2015 Commentary

MFO recently started computing its risk and performance fund metrics and attendant fund ratings using the Lipper Data Feed Service for U.S. Open End funds. (See MFO Switches To Lipper Database.) These new data have now been fully incorporated on the MFO Premium beta site, and on the Great Owl, Fund Alarm, and Dashboard of Profiled Funds pages of our legacy Search Tools. (The Risk Profile and Miraculous Multi-Search pages will be updated shortly).

Last month we noted that the biggest difference MFO readers were likely to find was in the assigned classifications or categories, which are described in detail here. (Morningstar’s categories are described here, and Lipper nicely compares the two classification methodologies here.) Some examples differences:

  • Lipper uses “Core” instead of “Blend.” So, you will find Large-Cap Growth, Large-Cap Core, and Large Cap Value.
  • Lipper includes a “Multi-Cap” category, in addition to Large-Cap, Medium-Cap, and Small-Cap. “Funds that, by portfolio practice, invest in a variety of market capitalization ranges …” Examples are Vanguard Total Stock Market Index Inv (VTSMX), Auxier Focus Inv (AUXFX), and Bretton (BRTNX).
  • Lipper does not designate an “Asset Allocation” category type, only “Equity” and “Fixed Income.” The traditional asset allocation funds, like James Balanced: Golden Rainbow Retail (GLRBX) and Vanguard Wellesley Income Inv (VWINX) can be found in the categories “Mixed-Asset Target Allocation Moderate” and “Mixed-Asset Target Allocation Conservative,” respectively.
  • Lipper used “Core Bond” instead of say “Intermediate-Term Bond” to categorize funds like Dodge & Cox Income (DODIX).
  • Lipper extends data back to January 1960 versus January 1962. Number of funds still here today that were here in January 1960? Answer: 72, including T Rowe Price Growth Stock (PRGFX).

A few other changes that readers may notice with latest update:

  • Ratings for funds in all the commodities categories, like Commodities Agriculture, where previously we only included “Broad Basket.”
  • Ratings for funds of leveraged and short bias categories, so-called “trading” funds.
  • Ratings for 144 categories versus 96 previously. We continue to not rate money market funds.
  • No ratings for funds designated as a “variable insurance product,” which typically cannot be purchased directly by investors. Examples are certain Voya, John Hancock, and Hartford funds.
  • There may be a few differences in the so-called “Oldest Share Class (OSC)” funds. MFO has chosen to define OSC as share class with earliest First Public Offering (FPO) date. (If there is a tie, then fund with lowest expense ratio. And, if tied again, then fund with largest assets under management.)

Overall, the changes appear quite satisfactory.

Some Morningstar ETF Conference Observations

By Charles Boccadoro

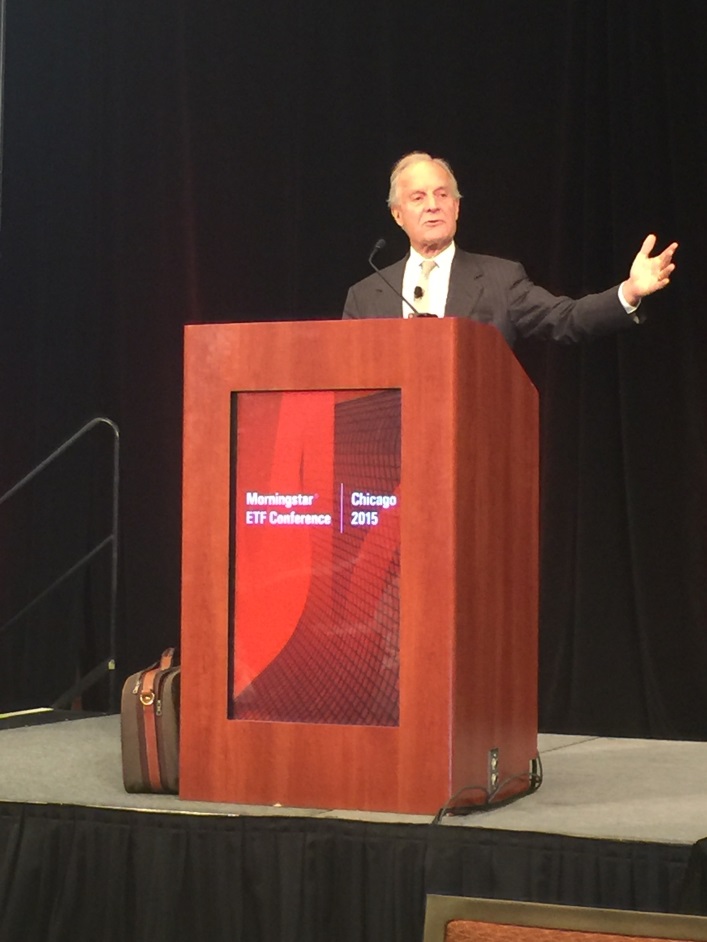
Originally published in October 1, 2015 Commentary2015-10-01_0451Overcast and drizzling in Chicago on the day Morningstar’s annual ETF Conference opened September 29, the 6th such event, with over 600 attendees. The US AUM is $2 trillion across 1780 predominately passive exchange traded products, or about 14% of total ETF and mutual fund assets. The ten largest ETFs , which include SPDR S&P 500 ETF (SPY) and Vanguard Total Stock Market ETF (VTI), account more for nearly $570B, or about 30% of US AUM.  Here is a link to Morningstar’s running summary of conference highlights.

IMG_2424_small

Joe Davis, Vanguard’s global head of investment strategy group, gave a similarly overcast and drizzling forecast of financial markets at his opening key note, entitled “Perspectives on a low growth world.” Vanguard believes GDP growth for next 50 years will be about half that of past 50 years, because of lack of levered investment, supply constraints, and weak global demand. That said, the US economy appears “resilient” compared to rest of world because of the “blood -letting” or deleveraging after the financial crisis. Corporate balances sheets have never been stronger. Banks are well capitalized.

US employment environment has no slack, with less than 2 candidates available for every job versus more than 7 in 2008. Soon Vanguard predicts there will be just 1 candidate for every job, which is tightest environment since 1990s. The issue with employment market is that the jobs favor occupations that have been facilitated by the advent of computer and information technology. Joe believes that situation contributes to economic disparity and “return on education has never been higher.”

Vanguard believes that the real threat to global economy is China, which is entering a period of slower growth, and attendant fall-out with emerging markets. He believes though China is both motivated and has proven its ability to have a “soft landing” that relies more on sustainable growth, if slower, as it transitions to more of a consumer-based economy.

Given the fragility of the global economy, Vanguard does not see interest rates being raised above 1% for the foreseeable future. End of the day, it estimates investors can earn 3-6% return next five year via a 60/40 balanced fund.

aqr-versus-the-academics-on-active-share-1030x701

J. Martijn Cremers and Antti Petajisto introduced a measure of active portfolio management in 2009, called Active Share, which represents the share of portfolio holdings that differ from the benchmark index holdings. A formal definition and explanation can be found here (scroll to bottom of page), extracted from their paper “How Active Is Your Fund Manager? A New Measure That Predicts Performance.”

Not everybody agrees that the measure “Predicts Performance.” AQR’s Andrea Frazzini, a principal on the firm’s Capital Management Global Stock Selection team, argued against the measure in his presentation “Deactivating Active Share.” While a useful risk measure, he states it “does not predict actual fund returns; within individual benchmarks, it is as likely to correlate positively with performance as it is to correlate negatively.” In other words, statistically indistinguishable.

AQR examined the same data as the original study and found the same quantitative result, but reached a different implication. Andrea believes the 2% higher returns versus the benchmark the original paper touted is not because of so-called high active share, but because the small cap active managers during the evaluation period happened to outperform their benchmarks. Once you break down the data by benchmark, he finds no convincing argument.

He does believe it represents a helpful risk measure. Specifically, he views it as a measure of activity.  In his view, high active share means concentrated portfolios that can have high over-performance or high under-performance, but it does not reliably predict which.

He also sees its value in helping flag closest index funds that charge high fees, since index funds by definition have zero active share.

Why is a large firm like AQR with $136B in AUM calling a couple professors to task on this measure? Andrea believes the industry moved too fast and went too far in relying on its significance.

The folks at AlphaArchitect offer up a more modest perspective and help frame the debate in their paper, ”The Active Share Debate: AQR versus the Academics.”

ellisCharles Ellis, renowned author and founder of Greenwich Associates, gave the lunchtime keynote presentation. It was entitled “Falling Short: The Looming Problem with 401(k)s and How To Solve It.”

He started by saying he had “no intention to make an agreeable conversation,” since his topic addressed the “most important challenge to our investment world.”

The 401(k) plans, which he traces to John D. Rockefeller’s gift to his Standard Oil employees, are falling short of where they need to be to support an aging population whose life expectancy keeps increasing.

He states that $110K is the median 401(k) plus IRA value for 65 year olds, which is simply not enough to life off for 15 years, let alone 25.

The reasons for the shortfall include employers offering a “You’re in control” plan, when most people have never had experience with investing and inevitably made decisions badly. It’s too easy to opt out, for example, or make an early withdrawal.

The solution, if addressed early enough, is to recognize that 70 is the new 65. If folks delay drawing on social security from say age 62 to 70, that additional 8 years represents an increase of 76% benefit. He argues that folks should continue to work during those years to make up the shortfall, especially since normal expenses at that time tend to be decreasing.

He concluded with a passionate plea to “Help America get it right…take action soon!” His argument and recommendations are detailed in his new book with co-authors Alicia Munnell and Andrew Eschtruth, entitled “Falling Short: The Coming Retirement Crisis and What to Do About It.”

Thinking outside the model is hazardous to one’s wealth…

By Charles Boccadoro

51bKStWWgDL._SX333_BO1,204,203,200_Originally published in October 1, 2015 Commentary

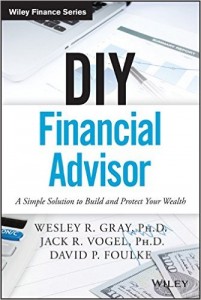
The title comes from the AlphaArchitect’s DIY Investing site, which is led by Wesley Gray. We profiled the firm’s flagship ValueShares US Quantitative Value ETF (QVAL) last December. Wes, along with Jack Vogel and David Foulke, recently published the Wiley Finance Series book, “DIY Finanical Advisor – A Simple Solution to Build and Protect Your Wealth.” It’s a great read.

It represents a solid answer to the so-called “return gap” problem described by Jason Hsu of Research Associates during Morningstar’s ETF Conference yesterday. Similar to and inspired by Morningstar’s “Investor Return” metric, Jason argues that investors’ bad decisions based on performance chasing and bad timing account for a 2% annualized short-fall between a mutual fund’s long-term performance and what investors actually receive. (He was kind enough to share his briefing with us, as well are his background position paper.)

“Investors know value funds achieve a premium, but they are too undisciplined to stay the course once the value fund underperforms the market.” It’s not just retail investors, Jason argues the poor behavior has actually been institutionalized and at some level may be worst for institutional investors, since their jobs are often based on short-term performance results.

DIY Financial Advisor opens by questioning society’s reliance on “expert opinion,” citing painful experiences of Victor Niederhoffer, Meredith Whitney, and Jon Corzine. It attempts to explain why financial experts often fail, due various biases, overconfidence, and story versus evidence-based decisions. The book challenges so-called investor myths, like…

  • Buffett’s famous advice: “It’s far better to buy a wonderful company at a fair price than a fair company at the wonderful price.”
  • Economic growth drives stock returns.
  • Payout superstition, where observers predict that lower-dividend payout ratios imply higher earnings growth.

In order to be good investors, the book suggests that we need to appreciate our natural preference for coherent stories over evidence that conflicts with the stories. Don’t be the pigeon doing a “pellet voodoo dance.”

It advocates adoption of simple and systematic investment approaches that can be implemented by normal folks without financial background. The approaches may not be perfect, but they have been empirically validated, like the capture of value and momentum premiums, to work “for a large group of investors seeking to preserve capital and capture some upside.”

Wes details how and why Harry Markowitz, who won the Nobel Prize in 1990 for his groundbreaking work in portfolio selection and modern portfolio theory, used a simple equal-weight 50/50 allocation between bond and equities when investing his own money.

The book alerts us to fear, greed, complexity, and fear tactics employed by some advisors and highlights need for DIY investors to examine fees, access/liquidity, complexity, and taxes when considering investment vehicles.

It concludes by stating that “as long as we are disciplined and committed to a thoughtful process that meets our goals, we will be successful as investors. Go forth and be one of the few, one of the proud, one of the DIY investors who took control of their hard-earned wealth. You won’t regret the decision.”

As with Wes’ previous book, Quantitative Value: A Practitioner’s Guide to Automating Intelligent Investment and Eliminating Behavioral Errors, DIY Financial Advisor is chock full of both anecdotes and analytical results. He and his team at AlphaArchitect continue to fight the good fight and we investors remain the beneficiaries.

MFO Switches To Lipper Database

By Charles Boccadoro

lipper_logoOriginally published in October 1, 2015 Commentary

In weeks ahead, MFO will begin using a Lipper provided database to compute mutual fund risk and return metrics found on our legacy Search Tools page and on the MFO Premium beta site.

Specifically, the monthly Lipper DataFeed Service provides comprehensive fund overview details, expenses, assets, and performance data for US mutual funds, ETFs, and money market funds (approximately 29,000 fund share classes).

Lipper, part of Thomson Reuters since 1998, has been providing “accurate, insightful, and timely collection and analysis of fund data” for more than 40 years. Its database extends back to 1960.

The methodologies MFO uses to compute its Great Owl funds, Three Alarm and Honor Roll designations, and Fund Dashboard of profiled funds will remain the same. The legacy search tool site will continue to be updated quarterly, while the premium site will be updated monthly.

Changes MFO readers can expect will be 1) quicker posting of updates, typically within first week of month, 2) more information on fund holdings, like allocation, turnover, market cap, and bond quality, and 3) Lipper fund classifications instead of the Morningstar categories currently used.

A summary of the Lipper classifications or categories can be found here. The more than 150 categories are organized under two main types: Equity Funds and Fixed Income Funds.

The Equity Funds have the following sub-types: US Domestic, Global, International, Specialized, Sector, and Mixed Asset. The Fixed Income Funds have: Short/Intermediate-Term U.S. Treasury and Government, Short/Intermediate-Term Corporate, General Domestic, World, Municipal Short/Intermediate, and Municipal General.

The folks at Lipper have been a pleasure to work with while evaluating the datafeed and during the transition. The new service supports all current search tools and provides opportunity for content expansion. The MFO Premium beta site in particular features:

  • Selectable evaluation periods (lifetime, 20, 10, 5, 3, and 1 year, plus full, down, and up market cycles) for all risk and performance metrics, better enabling direct comparison.
  • All share classes, not just oldest.
  • More than twenty search criteria can be selected simultaneously, like Category, Bear Decile, and Return Group, plus sub-criteria. For example, up to nine individual categories may be selected, along with multiple risk and age characteristics.
  • Compact, sortable, exportable search table outputs.
  • Expanded metrics, including Peer Count, Recovery Time, and comparisons with category averages.

Planned content includes: fund rankings beyond those based on Martin ratio, including absolute return, Sharpe and Sortino ratios; fund category metrics; fund house performance ratings; and rolling period fund performance.

Checking in on MFO’s 20-year Great Owls

By Charles Boccadoro

Originally published in September 1, 2015 Commentary

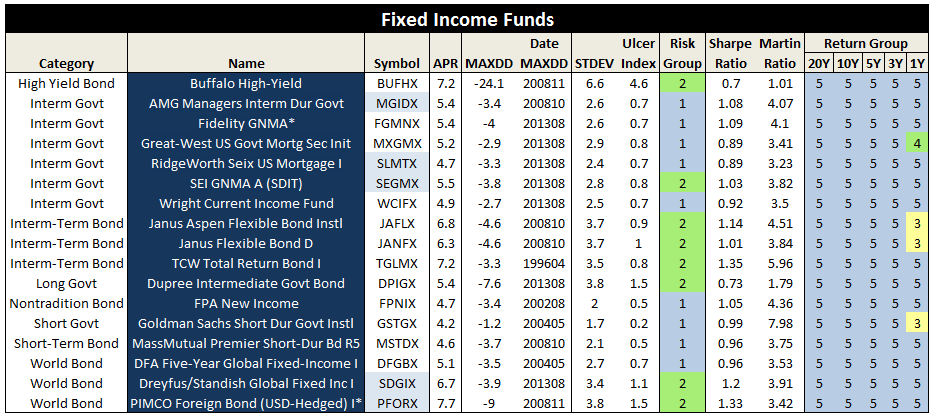
MFO first introduced its rating system in the June 2013 commentary. That’s also when the first “Great Owl” funds were designated. These funds have consistently delivered top quintile risk adjusted returns (based on Martin Ratio) in their categories for evaluation periods 3 years and longer. The most senior are 20-year Great Owls. These select funds have received Return Group ranking of 5 for evaluation periods of 3, 5, 10, and 20 years. Only about 50 funds of the 1500 mutual funds aged 20 years or older, or about 3%, achieve the GO designation. An impressive accomplishment.

Below are the current 20-year GOs (excluding muni funds for compactness, but find complete list here, also reference MFO Ratings Definitions.)

GO_1GO_2GO_3GO_4

Of the original 20-year GO list of 47 funds still in existence today, only 19 remain GOs. These include notables: Fidelity GNMA (FGMNX), PIMCO Foreign Bond – USD-Hedged I (PFORX), James Balanced: Golden Rainbow R (GLRBX), T. Rowe Price Capital Appreciation (PRWCX), Vanguard Wellington Inv (VWELX), Meridian Growth Legacy (MERDX), and Hennessy Gas Utility Investor (GASFX).

The current 20-year GOs also include 25 Honor Roll funds, based on legacy Fund Alarm ranking system. Honor Roll funds have delivered top quintile absolute returns in its category for evaluation periods of 1, 3, and 5 years. These include: AMG Managers Interm Dur Govt (MGIDX), PIMCO Foreign Bond – USD-Hedged I (PFORX), James Balanced: Golden Rainbow R (GLRBX), T. Rowe Price Capital Appreciation (PRWCX), and T. Rowe Price Mid-Cap Growth (RPMGX).

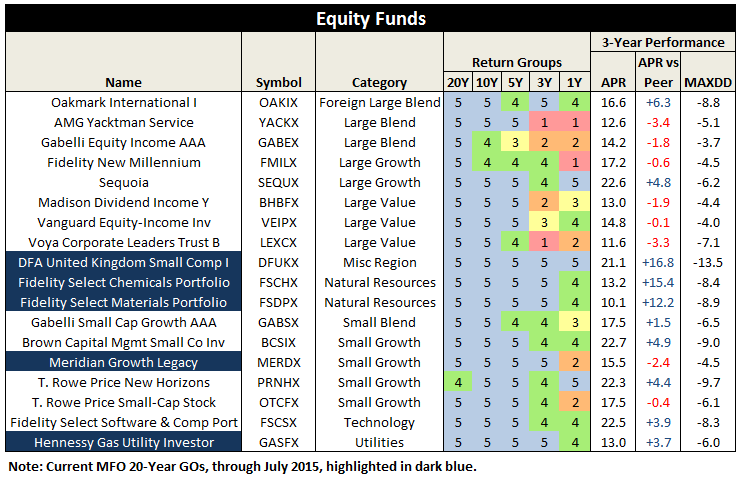
A closer look at performance of the original list of 20-year GOs, since they were introduced a little more than two years ago, shows very satisfactory performance overall, even with funds not maintaining GO designation. Below is a summary of Return Group rankings and current three-year performance.
OGO_1OGO_2OGO_3OGO_4
Of the 31 funds in tables above, only 7 have underperformed on a risk adjusted basis during the past three years, while 22 have outperformed.

Some notable outperformers include: Vanguard Wellesley Income Inv (VWINX), Oakmark International I (OAKIX), Sequoia (SEQUX), Brown Capital Mgmt Small Co Inv (BCSIX), and T. Rowe Price New Horizons (PRNHX).

And the underperformers? Waddell & Reed Continental Inc A (UNCIX), AMG Yacktman (YACKX), Gabelli Equity Income AAA (GABEX), and Voya Corporate Leaders Trust (LEXCX).

A look at absolute returns show that 10 of the 31 underperformed their peers by an average of 1.6% annualized return, while the remaining 21 beat their peers by an average of 4.8%.

Gentle reminder: MFO ratings are strictly quantitative and backward looking. No accounting for manager or adviser changes, survivorship bias, category drift, etc.

Will take a closer look at the three-year mark and make habit of posting how they fared over time.

James Balanced Golden Rainbow Fund (GLRBX/GLRIX), August 2015

By Charles Boccadoro

Objective and Strategy

The James Balanced Golden Rainbow Fund (GLRBX/GLRIX) seeks to provide total return through a combination of growth and income and preservation of capital in declining markets.

Under normal circumstances, the diversified James Balanced Golden Rainbow Fund invests primarily in undervalued domestic equities of companies with various market capitalizations and in high-quality (S&P’s rating of BBB or better) fixed income securities of various durations. At end of June 2015, the fund was 55% equity, 42% fixed income, and 3% cash equivalent. Median market cap was $7.6B (mid-cap, but with average about $15B) and average bond duration was 4.3 years.

The fund will normally hold both equity securities and fixed income securities, with at least 25% of its assets in equity and at least 25% of its assets in fixed income. Its broad, go-anywhere (if long only) charter enables it to go to 100% cash equivalents for short periods or even 50% for longer periods, although the adviser usually finds better opportunities than cash. It will hold foreign equities, currently just a couple percent, but probably never more than 10% and usually in form of ETFs or ADRs. Similarly, it can hold sovereign debt.

GLRBX’s allocation closely echoes the simple philosophy championed by Ben Graham in the Intelligent Investor and similarly touted by famed investors Harry Markowitz and John Bogle. Nominally 50/50 equity/fixed allocation, but then tailored based on investor temperament and/or market assessment, but never less than 25% in either. GLRBX targets defensively minded long-term investors.

Here’s a look back at the fund’s allocation since inception, which rarely deviates more than about 10% from the 50/50 split:

James_1

The fund attempts to provide total return in excess of the rate of inflation over the long term (3 to 5 years).

Adviser

James Investment Research (JIR), Inc. is the fund’s adviser. Dr. Francis E. James is the controlling share-holder. In 1972, he and his wife, Iris, started JIR in the bedroom of their son, David, with only $20K AUM. Their lofty goal was to garner $10M from family, friends and business relationships, which they considered the threshold AUM to enable purchasing a computer.

A spokesman for the firm explains that marketing has never been the main focus: “It has always been doing research, taking care of our clients and managing their funds wisely.” Fortunately, performance of the early fund (a precursor to GLRBX that was a comingled trust fund managed by Dr. James for Citizen’s Federal Savings and Loan) was satisfactory and the conservative nature of the investments attracted investors. It grew to about $100 million in size in 1983. The name “Golden Rainbow” comes from the original S&L’s logo.

Today the firm manages $6.5B for individuals, businesses, and endowments, as shown below. The preponderance is in GLRBX. It is a conservative allocation fund with $4.2B AUM, established formally in 1991. It is the firm’s oldest fund and flagship. JIR advises five other mutual funds “to provide diversification in our James Advantage Funds (aka James Funds) family.” These other funds appear to be offered to more aggressive investors for at least part of their portfolios, as capital preservation in declining markets is a secondary goal.

James_2

The firm has 19 full-time employees and two part-time. Since 1978, JIR practices profit sharing with its employees. “Cash profits shared last year were in excess of 45%, not including pension contributions.”

James maintains a PO Box in Alpha, Ohio, but is actually located in nearby Xenia, which is about 10 miles east of Dayton, near Wright Patterson Air Force Base, Wright Brother’s Memorial, and Wright State University. “It is a quiet place to do research and it is far from Wall Street. We don’t tend to follow the herd and we can keep our independent approach a little easier than in a big city. We operate on 35 acres in the woods, and it helps to keep stress levels lower and hopefully helps us make wiser decisions for our clients.”

Managers

GLRBX is managed by a 9 member investment committee.  Average tenure is over 20 years with the firm. Three are James’ family members: founder Dr. Frank James, CEO Barry James, and Head of Research David James. The committee makes the determination of allocation, stocks approved for purchase or sale, and bond duration. Day to day, any member handles implementation of the committee’s guidance. Nominally the fund is managed by a nine-person team, but day-to-day responsibility falls to Brian Culpepper (since 1998), Brian Sheperdson (since 2001), Trent Dysert (since 2014) and Moustapha Mounah (since 2022).

Dr. James is 83 years old. He served in the Air Force for 23 years, achieving the rank of Colonel and headed the Department of Quantitative Studies at the Air Force Institute of Technology. He received his Ph.D. from RPI where his thesis was “The Implications of Trend Persistency in Portfolio Management,” which challenged the idea that stocks move at random and formed the basis for technical analysis still employed by the firm today. Basically, he observed that stock price movements are not random and trends persist. He remains engaged with the firm, does research, and provides mentoring to the team on a regular basis.

Barry James also served as a pilot in the Air Force, receiving degrees from both Air Force Academy and Boston University, returning full time to James in 1986. All other members of the investment team have at least one degree from colleges or universities located in Ohio, except David James who holds no formal degree, but is a CFA.

Strategy capacity and closure

GLRBX has never closed. The firm believes capacity is $10-15B, based on its studies of expected performance and trading limitations. So, plenty of capacity remaining. That said: “We think having controlled growth is the key to being able to sustain performance. We aren’t trying to become the biggest because we don’t want to sacrifice the current client and their results just to add another dollar to the fund. At the same time, we believe we have something that many folks want and need and we don’t want to turn them away if we can help them.”

James admits that it focuses on advisers versus retail investors because it wants long-term relationships and it wants to avoid maintaining a large marketing staff.

To put GLRBX in perspective, its AUM is just 1% of Vanguard Wellington Wellesley (VWINX) fund, which maintains an average market cap of about $90B in its equity portfolio.

Active share

GLRBX reports against a blended index comprising 25% S&P 500, 25% Russell 2000, and 50% Barclays Capital Intermediate Government/Credit Bond indices. In practice, however, it does not follow a benchmark and does not compute the “active share” metric, which measures the degree to which a fund’s portfolio differs from the holdings of its benchmark portfolio. So, the metric is not particularly applicable here.

JIR’s David James, Director of Research, explains: “The fund deviates greatly and on purpose from the sector weightings of both these indexes. Typically this leads us to be better diversified than the benchmark which often overweights technology and finance sectors. Similarly, the fund would show up with a high “active share” as we presently have 141 individual equity holdings compared to close to 2,500 for the combined S&P 500 / Russell 2000 Indexes.”

We asked our friends at Alpha Architect to assess the GLRBX portfolio with their on-line Active Share Calculator (coming soon) and sure enough, they calculated 94.2%.

Management’s Stake in the Fund

GLRBX represents the model for how fund management should maintain significant “skin in the game” and align its interests with those of shareholders. All long-time trustees and the entire team of 9 portfolio managers (the fund’s investment committee) are invested in the fund, plus the adviser’s retirement plan is invested in the fund. Per the latest SAI, dated November 14, 2014, the four trustees have more the $100K in the fund (two others just elected are expected to hold similar amounts). The table below represents holdings by the investment committee members:

James_3

Opening date

July 1, 1991 for investor share class (GLRBX) and March 2, 2009 for institutional share class (GLRIX).

Minimum investment

When investing directly with James, just $2K for a GLRBX individual account, just $500 for a retirement account, and just $50 with an automatic investment plan. Institutional shares also have a friendly $50K minimum by industry standards.

Just as a sample, Schwab offers GLRBX as a No Load/No Fee fund, with slightly higher minimums ($2.5K individual/$1K retirement) but imposes a short-term redemption fee. Similarly, Schwab offers GLRIX but with transaction fee and $100K minimum, but no short-term redemption fee.

Expense ratio

The retail shares are 1.21% and the Institutional shares are 0.96% on assets of $432.6 million, as of July 2023. 

——————————————————————————————————————————————

GLRBX charges a 1.01% expense fee annually, per its latest prospectus dated 11/01/2014, which is about 0.25% below industry average for the conservative allocation category. Its fee for active management is 0.66%.

Unfortunately like most of the industry, James still imposes 0.25% 12b-1 distribution and/or shareholder servicing fee and still maintains two share classes. Most of the 12b-1 fees are paid to the broker-dealers, like Schwab, who sell fund shares. Multiple share classes mean shareholders pay different expenses for the same fund, typically due to initial investment amount, transaction fee, or association of some form.

Institution shares (GLRIX) do not include the 12b-1 fee, resulting in a low 0.76% expense fee annually.

James imposes no loads.

On practice of soft dollars, which is essentially a hidden fee that allows advisers to pay higher commissions to broker-dealers to execute trades in exchange for things like research databases, James’ SAI allows it. Its Chief Compliance Officer, Lesley Ott, explains: “The language in our SAI permits soft dollars; however, it is our policy to not use them.  Per advice from counsel, the language in the SAI is intended to be broad in nature even though we may not engage in specific practices.”

On page 19 of the firm’s public disclosure of qualifications and practices (the so-called Part 2A of Form ADV: Firm Brochure) it states: “JIR does not have any soft-dollar arrangements and does not receive any soft-dollar benefits.” In fact, it is James’ practice to not pay for outside research; rather it conducts most of its research in-house.

Comments

The track record since inception for GLRBX is enviable by any measure and across any time frame.

Through June 2015, it is an MFO 20-year Great Owl, which means its shareholders have enjoyed top quintile risk adjusted returns based on Martin Ratio for the past 20, 10, 5, and 3 year periods. It is the only 20-year Great Owl in the conservative allocation category. It is also on the MFO Honor Roll, which means that it has delivered top quintile absolute returns in its category over the past 5, 3, and 1 year periods.

Though it is a Morningstar 5 star fund based on quantitative past performance, the fund is not covered by Morningstar analysts.

Here are its risk/return metrics across various evaluation periods through June 2015:

James_4a

James_4b

James_4c

Here’s how it compares with notable peers during the current market cycle (Cycle 5 in table above), beginning November 2007, which includes the housing bubble:

James_5

Here’s how it compares with during the market in cycle from September 2000 through October 2007 (Cycle 4 in table above), which includes the tech bubble:

James_6

True to its objective across all these evaluation periods, the fund has delivered very satisfactory total returns while minimizing volatility and drawdown.

How does it do it?

James believes it is better to try and anticipate rather than react to the market. In doing so, it has developed a set of risk indicators and stock selection factors to set allocation and portfolio construction. James has quantified these indicators every week since 1972 in disciplined fashion to help reduce 1) emotional moves, and 2) base actions on facts and current data.

When change to the portfolio does occur, it is done gradually. “We don’t jump from one extreme to the other in terms of allocation, we use the salami approach, taking a slice into or out of the market and then watching our indicators and continuing the process if they keep the same level of bullishness or bearishness.”

The risk measures and stock selection factors include a combination of macro-economic, sector analysis, company fundamental, and even market and stock technical analysis, like moving averages, as depicted below.

James_7small

Once the investment committee establishes allocation, capitalization, and sector weightings, the universe of about 8500 stocks tracked in Zack’s database, including those on Russell 2000 and S&P 500, are ranked based on three categories: relative valuation/sentiment (50%), positive and growing earnings (35%), and relative price strength (15%). The top ranked stocks then get reviewed more qualitatively by a team of 3 before being debated and voted on for inclusion by the investment committee. “A simple majority rules, with committee members voting in reverse order of seniority, to avoid undue influence by senior management.”

The disciplined risk management process is further depicted here:

James_8

In his book, 7 Timeless Principles of Investing, Barry James discusses how the decision to sell is more important than the decision to buy. James never enters a position without having the conviction to hold a stock a minimum of six month. But, more importantly and distinct than say deep-value investors, like Bruce Berkowitz or even Dodge & Cox, James will exit a position based on technical analysis alone. Not drawdown limits per se but technicals none the less.

Barry James explains: “We will sell a stock when it no longer offers good risk/reward return, which could be a change in fundamentals, but also weak price strength. While individual investors may often hang-on to poor performing stocks in hopes of a come-back, we see hanging-on to losers as an opportunity cost … we’ve developed the discipline to simply not do that.” Basically, fundamentals being equal, James would rather dump the losing stock for a stock with stronger price strength.

On share-holder friendliness, the company does a lot right: skin-in-the-game through substantial investment in the fund by all managing principals and directors of the trust, the firm’s employee retirement plan is in the fund, weekly email with updates on allocation decisions, quarterly commentary newsletters, frequent special reports including an annual financial outlook, no loads, relatively low fees, and a published Guiding Principles document.

The Guiding Principles document covers the firm’s mission, ethical standards, focus, and the importance of following the “Golden Rule” of treating others as one would like others to treat oneself. But the firm goes a step further by aligning these principles as “God Honoring” and applies the biblical reference of “Seek First the Kingdom of God.”

The firm’s vision articulated by James Barry, in fact, is “…best investment firm in US by striving to follow God Honoring Principles…we will spearhead a dramatic improvement in reputation of our industry.”

Mr. James’s religious faith clearly informs his investment practice. When asked if the association ever caused potential investors to feel awkward or even alienated, he states, “People will tell me that I don’t believe what you believe but I’m glad you do.”

Unlike socially responsible or so-called ESG funds, James applies no screen to restrict investments to firms practicing similar principles or of any religious association.

(James does act as a sub-adviser for the Timothy Plan Growth & Income Fund TGIAX, which is part of The Timothy Plan family of mutual funds for “biblically responsible investing”. These funds avoid “investing in companies that are involved in practices contrary to Judeo-Christian principles.” This family ranks in the bottom quintile on MFO’s Fund Family Score Card due in part at least to indefensible front-loads and high expense ratios.)

James is a family business and succession planning is clear and present from Dr. James to Barry and David. Beyond that, a grandson-in-law and a grandson are getting experience at the firm and in the brokerage business. A spokesman explains: “Our intent is for the firm to remain independent in the years ahead and estate planning has been done to keep the business in the family’s hands.”

Bottom Line

At some level, all actively managed funds try to anticipate the future and position accordingly. By studying past results and identifying persistent premiums, like value or small cap stocks. By studying company fundamentals to find under-appreciated stocks of high quality companies. By finding pricing displacements or inefficiencies in the market and attempting to capitalize with say value arbitrage trades. By anticipating macro-economic events or recognizing trends in the market.

James combines several of these approaches with its flagship fund for setting allocations, sector weightings, bond duration targets, equity selection, and portfolio construction in a way that mitigates risk, protects against downside, while still delivering very satisfactory returns. Given its track record, relatively small size, and disciplined implementation, there is no reason to believe it will not keep meeting its investment objective. It definitely deserves to be on the short list of easy mutual funds to own for defensive minded investors.

Fund website

James Advantage Funds maintains a decent website, which includes fund regulatory documentation, past performance, market outlooks, quarterly and special reports. Similarly, more information about the adviser can be found at James Investment Research.

Morningstar Investment Conference 2015 Notes

By Charles Boccadoro

Originally published in July 1, 2015 Commentary
M_Conf_1

In contrast to the perfect pre-autumnal weather of last year’s ETF conference, Chicago was hot and muggy this past week, where some 1500 attendees gathered for Morningstar’s Investment Conference located at the massive, sprawling, and remote McCormick Place.

Morningstar does a great job of quickly publishing conference highlights and greatly facilitates press … large press room wired with high-speed internet, ample snacks and hot coffee, as well as adjacent media center where financial reporters can record fund managers and speakers then quickly post perspectives, like Chuck Jaffe’s good series of audio interviews.

On the MFO Discussion Board, David attempts to post nightly his impressions and linkster Ted relays newly published conference articles. To say the event is well covered would be a colossal understatement.

M_Conf_2

Nonetheless, some impressions for inclusion in this month’s commentary …

If you are a financial adviser not catering to women and millennials, your days are numbered.

On women. Per Sallie Krawcheck, former president of BAC’s Global Wealth division and currently chair of the Ellevate network, which is dedicated to economic engagement of women worldwide, women live six to eight years longer than men … 80% of men die married, while 80% of women die unmarried … 70% of widows leave their financial advisers within a year of their husband’s death.

While women will soon account for majority of US millionaires, most financials advisors don’t include spouses in the conversation. The issue extends to the buy side as well. In a pre-conference session entitled, “Do Women Investors Behave Differently Than Men,” panels cited that women control 51% investable wealth and currently account for 47% of high net worth individuals, yet professional women money managers account for only 5% of assets under management. How can that be?

The consequence of this lack of inclusion is “lack of diversification, higher risk, and money left on table.” Women, they state, value wealth preservation many times more than men. One panelist actually argues that women are better suited to handle the stress hormone cortisol since they need not suffer adverse consequences of interaction with testosterone.

While never said explicitly, I could not help but wonder if the message or perhaps question here is: If women played a greater role in financial institutions and at the Fed in years leading up to 2007, would we have avoided the financial or housing crises?  

On millennials. Per Joel Brukenstein of Financial Planning Magazine and creator of Technology Tools for Today website, explains that the days of financial advisors charging 1% annual fee for maintaining a client portfolios of four or five mutual funds are no longer sustainable … replaced with a proliferation of robo-advisors, like Schwab Intelligent Portfolios, which charges “no advisory fees, no account service fees, no commissions, period.”

Ditto, if your services are not available on a smart phone. Millennials are beyond internet savvy and mobile … all data/tools must be accessible via the cloud.

Mr. Brukenstein went so far as to suggest that financial advisors not offering services beyond portfolio management should consider exiting the business.

M_Conf_3

Keynote highlights. Jeremy Grantham, British-born co-founder of Boston-based asset management firm GMO, once again reiterated his belief that US stocks are 30 – 60% overvalued, still paying for overvaluation sins of our fathers … the great bull run of 1990, which started in 1987, finished in 2000, and was right on the heels of the great bull run of the 1980s. No matter that investors have suffered two 50% drawdowns the past 15 years with the S&P 500 and only received anemic returns, “it will take 25 years to get things right again.” So, 10 more years of suffering I’m afraid.

He blames Greenspan, Bernanke, and Yellen for distorting valuations, the capital markets, the zero interest rate policy … leading to artificially inflated equity prices and a stock-option culture that has resulted in making leaders of publically traded companies wealthy at the expense of capital investment, which would benefit the many. “No longer any room for city or community altruism in today’s capitalism … FDR’s social contract no more.”

All that said he does not see the equity bubble popping just yet … “no bubble peaks before abnormal buyers and deals come to market.” He predicts steady raise until perhaps coming presidential election.

Mr. Grantham is not a believer in efficient market theory. He views the cycles of equity expansion and contraction quite inefficiently driven by career risk (never be wrong on your own …), herding, momentum, extrapolation, excursions from replacement value, then finally, arbitrage and mean reversion at expense of client patience. Round and round it goes.

M_Conf_4

David Kelly, JP Morgan’s Chief Global Strategist whose quarterly “Guide To Markets” now reaches 169 thousand individuals in 25 countries, also does not see a bear market on horizon, which he believes would be triggered by one or more of these four events/conditions: recession, commodity spike, aggressive fed tightening, and/or extreme valuation. He sees none of these.

He sees current situation in Greece as a tragedy … Germany was too tough during recession. Fortunately, 80% of Greek debt is held by ECB, not Euro banks, so he sees no lasting domino effect if it defaults.

On the US economy, he sees it “not booming, but bouncing back.” Seven years into recovery, which represents the fourth longest expansion dating back to 1900. “Like a Yankees/Red Sox game … long because it is slow.”

He disputes Yellen’s position that there is slack in the economy, citing that last year 60 million people were hired … an extraordinary amount. (That is the gross number; subtract 57 million jobs left, for a net of 3 million.) The biggest threat to continued expansion is lack of labor force, given retiring baby boomers, 12.5 of population with felony convictions, scores addicted to drug, and restrictions on foreign nationals, which he calls the biggest tragedy: “We bring them in. They want to be here. We educate them. They are top of class. Then, we send them home. It’s crazy. We need immigration reform to allow skilled workers to stay.”

Like Grantham, he does see QE helping too much of the wrong thing at this point: “Fertilizer for weeds.”

On oil, which he views like potatoes – a classic commodity: “$110 is too much, but $40 is too low.” Since we have “genetically evolved to waste oil,” he believes now is good time to get in cause “prices have stabilized and will gradually go up.”

Like last fall, he continues to see EM cheap and good long term opportunity. Europe valuations ok … a mid-term opportunity.

He closed by remaining us that investors need courage during bear markets and brains during bull markets.

M_Conf_5

Breakout sessions. Wasatch’s Laura Geritz was stand-out panelist in break-out session “Are Frontier Markets Worth Pursuing?” She articulately described likes (“Active manager’s dream asset class … capital held dear by phenomenal FM management teams … investments by strong subsidiaries, like Nestle … China’s investment in FM … ”) and dislikes (“No practical index … current indices remain too correlated due to lack of diversification … lack of market liquidity …”). She views FM as strictly long-term investment proposition with lots of ups and downs, but ultimately compelling. If you have not listened to her interview with Chuck Jaffe, you should.

Another break-out session, panelists discussed the current increasing popularity of “ESG Investing.” (ESG stands for environmental, social, and governance. ESG funds, currently numbering more than 200, apply these criteria in their investments.) “Ignore increasingly at your own peril … especially given that women and millennials represent the biggest demographic on horizon.” Interestingly, data suggest such funds do just as well if not slightly better than the overall market.
Outliers

By Charles Boccadoro

outliersOriginally published in June 1, 2015 Commentary

“At the extreme outer edge of what is statistically plausible” is how Malcom Gladwell defines an outlier in his amazing book, Outliers: The Story of Success (2008).

The MFO Rating System ranks funds based on risk adjusted return within their respective categories across various evaluation periods. The rankings are by quintile. Those in the top 20 percentile are assigned a 5, while those in the bottom 20 percentile are assigned a 1.

The percentile is not determined from simple rank ordering. For example, say there are 100 funds in the Large Growth category. The 20 funds with the highest risk adjusted return may not necessarily all be given a 5. That’s because our methodology assumes fund performance will be normally distributed across the category, which means terms like category mean and standard deviation are taken into account.

It’s similar to grading tests in school using a bell curve and, rightly or wrongly, is in deference to the random nature of returns. While not perfect, this method produces more satisfactory ranking results than the simple rank order method because it ensures, for example, that the bottom quintile funds (Return Group 1) have returns that are so many standard deviations below the mean or average returning funds (Return Group 3). Similarly, top quintile funds (Return Group 5) will have returns that are so many standard deviations above the mean.

bellcurve

All said, there remain drawbacks. At times, returns can be anything but random or “normally” distributed, which was painfully observed when the hedge fund Long-Term Capital Management (LTCM) collapsed in 1998. LTCM used quant models with normal distributions that underestimated the potential for extreme under performance. Such distributions can be skewed negatively, creating a so-called “left tail” perhaps driven by a market liquidity crunch, which means that the probability of extreme under-performance is higher than depicted on the left edge of the bell curve above.
Then there are outliers. Funds that over- or under-perform several standard deviations away from the mean. Depending on the number of funds in the category being ranked, these outliers can meaningfully alter the mean and standard deviation values themselves. For example, if a category has only 10 funds and one is an outlier, the resulting rankings could have the outlier assigned Return Group 5 and all others relegated to Return Group 1.

The MFO methodology removes outliers, anointing them if you will to bottom or top quintile, then recalculates rankings of remaining funds. It keeps track of the outliers across the evaluation periods ranked. Below please find a list of positive outliers, or extreme over-performers, based on the latest MFO Ratings of some 8700 funds, month ending April 2015.

The list contains some amazing funds and warrants a couple observations:

  • Time mitigates outliers, which seems to be a manifestation of reversion to the mean, so no outliers are observed presently for periods beyond 205 or so months, or about 17 years.
  • Outliers rarely repeat across different time frames, sad to say but certainly not unexpected as observed in In Search of Persistence.
  • Outliers typically protect against drawdown, as evidenced by low Bear Decile score and Great Owl designations (highlighted in dark blue – Great Owls are assigned to funds that have earned top performance rank based on Martin for all evaluation periods 3 years or longer).

The following outliers have delivered extreme over-performance for periods 10 years and more (the tables depict 20 year or life metrics, as applicable):

10yr_1

10yr_2

Here are the outliers for periods 5 years and more (the tables depict 10 year or life metrics, as applicable):

5yr-1

5yr-2

Finally, the outliers for periods 3 years and more (the tables depict 5 year or life metrics, as applicable):

3yr-1

3yr-2

How Good Is Your Fund Family? An Update…

By Charles Boccadoro

Originally published in May 1, 2015 Commentary

Baseball season has started. MLB.TV actually plays more commercials than it used to, which sad to say I enjoy more than the silent “Commercial Break In Progress” screen, even if they are repetitive.

One commercial is for The Hartford Funds. The company launched a media campaign introducing a new tagline, “Our benchmark is the investor℠,” and its focus on “human-centric investing.”

fundfamily_1

Its website touts research they have done with MIT on aging, and its funds are actually sub-advised by Wellington Management.

A quick look shows 66 funds, each with some 6 share classes, and just under $100B AUM. Of the 66, most charge front loads up to 5.5% with an average annual expense ratio of just over 1%, including 12b-1 fee. And, 60 have been around for more than 3 years, averaging 15 years in fact.

How well have their funds performed over their lifetimes? Just average … a near even split between funds over-performing and under-performing their peers, including expenses.

We first started looking at fund family performance last year in the piece “How Good Is Your Fund Family?” Following much the same methodology, with all the same qualifications, below is a brief update. Shortly, we hope to publish an ongoing tally, or “Fund Family Score Card” if you will, because … during the next commercial break, while watching a fund family’s newest media campaign, we want to make it easier for you to gauge how well a fund family has performed against its peers.

The current playing field has about 6200 US funds packaged and usually marketed in 225 families. For our tally, each family includes at least 5 funds with ages 3 years or more. Oldest share class only, excluding money market, bear, trading, and specialized commodity funds. Though the numbers sound high, the field is actually dominated by just five families, as shown below:

fundfamily_2

It is interesting that while Vanguard represents the largest family by AUM, with nearly twice its nearest competitor, its average annual ER of 0.22% is less than one third either Fidelity or American Funds, at 0.79% and 0.71%, respectively. So, even without front loads, which both the latter use to excess, they are likely raking in much more in fees than Vanguard.

Ranking each of the 225 families based on number of funds that beat their category averages produces the following score card, by quintile, best to worst:

fundfamily_3afundfamily_3bfundfamily_3cfundfamily_3dfundfamily_3e

Of the five families, four are in top two quintiles: Vanguard, American Funds, Fidelity, and T. Rowe Price.  In fact, of Vanguard’s 145 funds, 119 beat their peers. Extraordinary. But BlackRock is just average, like Hartford.

The difference in average total return between top and bottom fund families on score card is 3.1% per year!

The line-ups of some of the bottom quintile families include 100% under-performers, where every fund has returned less than its peers over their lifetimes: Commonwealth, Integrity, Lincoln, Oak Associates, Pacific Advisors, Pacific Financial, Praxis, STAAR. Do you think their investors know? Do the investors of Goldman Sachs know that their funds are bottom quintile … written-off to survivorship bias possibly?

Visiting the website of Oberweis, you don’t see that four of its six funds under-performed. Instead, you find: TWO FUNDS NAMED “BEST FUND” IN 2015 LIPPER AWARDS. Yes, its two over-performers.

While the line-ups of some top quintile families include 100% over-performers: Cambiar, Causeway, Dodge & Cox, First Eagle, Marsico, Mirae, Robeco, Tocqueville.
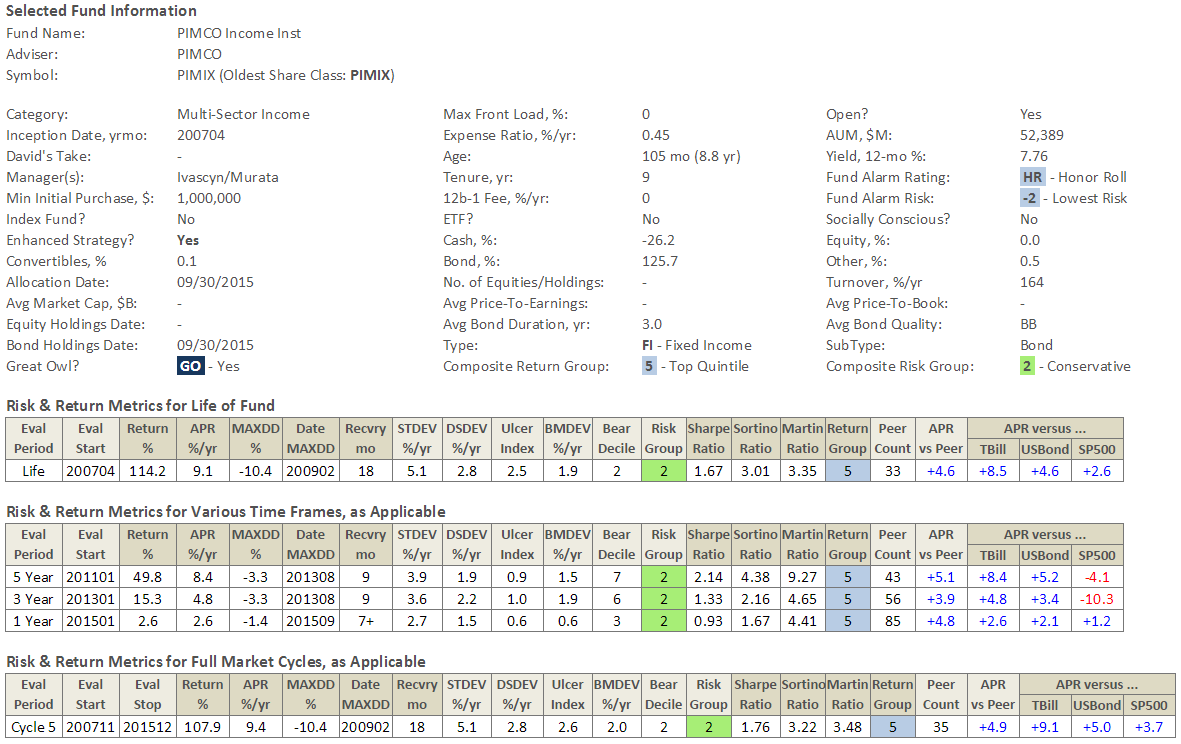
Here is a summary of some of the current best and worst:

fundfamily_4

While not meeting the “five funds” minimum, some other notables: Tweedy Browne has 4 of 4 over-performers, and Berwyn, FMI, Maris & Power, Meridian all have 3 of 3.  As well as younger families off to great starts: KP, 14 of 14 over-performers, Rothschild 7 of 7, Gotham 5 of 5, and Grandeur Peak 4 of 4. We will find a way to call attention to these funds too on the future “Fund Family Score Card.”

Identifying Bear-Market Resistant Funds During Good Times

By Charles Boccadoro

Originally published in April 1, 2015 Commentary

It’s easy enough to look back at the last bear market to see which funds avoided massive drawdown. Unfortunately, portfolio construction of those same funds may not defend against the next bear, which may be driven by different instabilities.

Dodge & Cox Balanced Fund (DODBX) comes to mind. In the difficult period between August 2000 and September 2002, it only drew down 11.6% versus the S&P 500’s -44.7% and Vanguard’s Balanced Index VBINX -22.4%. Better yet, it actually delivered a healthy positive return versus a loss for most balanced funds.

Owners of that fund (like I was and remain) were disappointed then when during the next bear market from November 2007 to February 2009, DODBX performed miserably. Max drawdown of -45.8%, which took 41 months to recover, and underperformance of -6.9% per year versus peers. A value-oriented fund house, D&C avoided growth tech stocks during the 2000 bubble, but ran head-on into the financial bubble of 2008. Indeed, as the saying goes, not all bear markets are the same.

Similarly, funds may have avoided or tamed the last bear by being heavy cash, diversifying into uncorrelated assets, hedging or perhaps even going net short, only to underperform in the subsequent bull market. Many esteemed fund managers are in good company here, including Robert Arnott, John Hussman, Andrew Redleaf, Eric Cinnamond to name a few.

Morningstar actually defines a so-called “bear-market ranking,” although honestly this metric must be one of least maintained and least acknowledged on its website. “Bear-market rankings compare how funds have held up during market downturns over the past five years.” The metric looks at how funds have performed over the past five years relative to peers during down months. Applying the methodology over the past 50 years reveals just how many “bear-market months” investors have endured, as depicted in the following chart:

bmdev_1

The long term average shows that equity funds experience a monthly drop below 3% about twice a year and fixed income funds experience a drop below 1% about three times every two years. There have been virtually no such drops this past year, which helps explain the five-year screening window.

The key question is whether a fund’s performance during these relatively scarce down months is a precursor to its performance during a genuine bear market, which is marked by a 20% drawdown from previous peak for equity funds.

Taking a cue from Morningstar’s methodology (but tailoring it somewhat), let’s define “bear market deviation (BMDEV)” as the downside deviation during bear-market months. Basically, BMDEV indicates the typical percentage decline based only on a fund’s performance during bear-market months. (See Ratings System Definitions and A Look at Risk Adjusted Returns.)

The bull market period preceding 2008 was just over five years, October 2002 through October 2007, setting up a good test case. Calculating BMDEV for the 3500 or so existing funds during that period, ranking them by decile within peer group, and then assessing subsequent bear market performance provides an encouraging result … funds with the lowest bear market deviation (BMDEV) well out-performed funds with the highest bear market deviation, as depicted below.

bmdev_2

Comparing the same funds across the full cycle reveals comparable if not superior absolute return performance of funds with the lowest bear market deviation. A look at the individual funds includes some top performers:  

bmdev_3

The correlation did not hold up in all cases, of course, but it is a reminder that the superior return often goes hand-in-hand with protecting the downside.

Posturing then for the future, which funds have the lowest bear-market deviation over the current bull market? Evaluating the 5500 or so existing funds since March 2009 produces a list of about 450 funds. Some notables are listed below and the full list can be downloaded here. (Note: The full list includes all funds with lowest decile BMDEV, regardless of load, manager change, expense ratio, availability, min purchase, etc., so please consider accordingly.)

bmdev_4

All of the funds on the above list seem to make a habit of mitigating drawdown, experiencing a fraction of the market’s bear-market months. In fact, a backward look of the current group reveals similar over-performance during the financial crisis when compared to those funds with the highest BMDEV.

Also, scanning through the categories above, it appears quite possible to have some protection against downside without necessarily resorting to long/short, market neutral, tactical allocation, and other so-called alternative investments. Although granted, the time frame for many of the alternatives categories is rather limited.

In any case, perhaps there is something to be said for “bear-market rankings” after all. Certainly, it seems a worthy enough risk metric to be part of an investor’s due diligence. We will work to make available updates of bear-market rankings for all funds to MFO readers in the future.

Meb Faber’s New Book

By Charles Boccadoro

Global-Asset-Allocation-with-border-683x1024Originally published in March 1, 2015 Commentary

Official publication date is tomorrow, March 2.

Like his last two books, Shareholder Yield and Global Value, reviewed in last year’s May commentary, his new book “Global Asset Allocation: A Survey of the World’s Top Asset Allocation Strategies” is a self-published ebook available on Amazon for just $2.99.

On his blog, Mr. Faber states “my goal was to keep it short enough to read in one sitting, evidence-based with a basic summary that is practical and easily implementable.”

That description is true of all Meb’s books, including his first published by Wiley in 2009, The Ivy Portfolio. To celebrate he’s making downloads of Shareholder Yield and Global Value available for free.

We will review his new book next time we check-in on Cambria’s ETF performance.


Here appears to be its Table of Contents:

INTRODUCTION

CHAPTER 1 – A History of Stocks, Bonds, and Bills

CHAPTER 2 – The Benchmark Portfolio: 60/40

CHAPTER 3 – Asset Class Building Blocks

CHAPTER 4 – The Risk Parity and All Seasons Portfolios

CHAPTER 5 – The Permanent Portfolio

CHAPTER 6 – The Global Market Portfolio

CHAPTER 7 – The Rob Arnott Portfolio

CHAPTER 8 – The Marc Faber Portfolio

CHAPTER 9 – The Endowment Portfolio: Swensen, El-Erian, and Ivy

CHAPTER 10 – The Warren Buffett Portfolio

CHAPTER 11 – Comparison of the Strategies

CHAPTER 12 – Implementation (ETFs, Fees, Taxes, Advisors)

CHAPTER 13 – Summary

APPENDIX A – FAQs

Whitebox Tactical Opportunities 4Q14 Conference Call

By Charles Boccadoro

wbmix_logo

Originally published in March 1, 2015 Commentary

Portfolio managers Andrew Redleaf and Dr. Jason Cross, along with Whitebox Funds’ President Bruce Nordin and Mike Coffey, Head of Mutual Fund Distribution, hosted the 4th quarter conference call for their Tactical Opportunities Fund (WBMIX) on February 26. Robert Vogel and Paul Twitchell, the fund’s third and fourth portfolio managers, did not participate.

Prolific MFO board contributor Scott first made us aware of the fund in August 2012 with the post “Somewhat Interesting Tiny Fund.” David profiled its more market neutral and less tactical (less directionally oriented) sibling WBLFX in April 2013. I discussed WBMIX in the October 2013 commentary, calling the fund proper “increasingly hard to ignore.” Although the fund proper was young, it possessed the potential to be “on the short list … for those who simply want to hold one all-weather fund.”

WBMIX recently pasted its three year mark and at $865M AUM is no longer tiny. Today’s question is whether it remains an interesting and compelling option for those investors looking for alternatives to the traditional 60/40 balanced fund at a time of interest rate uncertainty and given the two significant equity drawdowns since 2000.

Mr. Redleaf launched the call by summarizing two major convictions:

  • The US equity market is “expensive by just about any measure.” He noted examples like market cap to GDP or Shiller CAPE, comparing certain valuations to pre great recession and even pre great depression. At such valuations, expected returns are small and do not warrant the downside risk they bear, believing there is a “real chance of 20-30-40 even 50% retraction.” In short, “great risk in hope of small gain.”
  • The global markets are fraught with risk, still recovering from the great recession. He explained that we were in the “fourth phase of government action.” He called the current phase competitive currency devaluation, which he believes “cannot work.” It provides temporary relief at best and longer term does more harm than good. He seems to support only the initial phase of government stimulus, which “helped markets avert Armageddon.” The last two phases, which included the zero interest rate policy (ZIRP), have done little to increase top-line growth.

Consequently, toward middle of last year, Tactical Opportunities (TO) moved away from its long bias to market neutral. Mr. Redleaf explained the portfolio now looks to be long “reasonably priced” (since cheap is hard to find) quality companies and be short over-priced storybook companies (some coined “Never, Nevers”) that would take many years, like 17, of uninterrupted growth to justify current prices.

The following table from its recent quarterly commentary illustrates the rationale:

wbmix_0

Mr. Redleaf holds a deep contrarian view of efficient market theory. He works to exploit market irrationalities, inefficiencies, and so-called dislocations, like “mispriced securities that have a relationship to each other,” or so-called “value arbitrage.” Consistently guarding against extreme risk, the firm would never put on a naked short. Its annual report reads “…a hedge is itself an investment in which we believe and one that adds, not sacrifices returns.”

But that does not mean it will not have periods of underperformance and even drawdown. If the traditional 60/40 balanced fund performance represents the “Mr. Market Bus,” Whitebox chose to exit middle of last year. As can be seen in the graph of total return growth since WBMIX inception, Mr. Redleaf seems to be in good company.

wbmix_1

Whether the “exit” was a because of deliberate tactical moves, like a market-neutral stance, or because particular trades, especially long/short trades went wrong, or both … many alternative funds missed-out on much of the market’s gains this past year, as evidenced in following chart:

wbmix_2

But TO did not just miss much of the upside, it’s actually retracted 8% through February, based on month ending total returns, the greatest amount since its inception in December 2011; in fact, it has been retracting for ten consecutive months. Their explanation:

Our view of current opportunity has been about 180 degrees opposite Mr. Market’s. Currently, we love what we’d call “intelligent value” while Mr. Market apparently seems infatuated with what we’d call “unsustainable growth.”

Put bluntly, the stocks we disfavored most (and were short) were among the stocks investors remained enamored with.

A more conservative strategy would call for moving assets to cash. (Funds like ASTON RiverRoad Independent Value, which has about 75% cash. Pinnacle Value at 50%. And, FPA Crescent at 44%.) But TO is more aggressive, with attendant volatilities above 75% of SP500, as it strives to “produce competitive returns under multiple scenarios.” This aspect of the fund is more evident now than back in October 2013.

Comparing its performance since launch against other long-short peers and some notable alternatives, WBMIX now falls in the middle of the pack, after a strong start in 2012/13 but disappointing 2014:

wbmix_3

From the beginning, Mr. Redleaf has hoped TO would be judged in comparison to top endowments. Below are a couple comparisons, first against Yale and Harvard, which report on fiscal basis, and second against a simple Ivy asset allocation (computed using Alpha Architect’s Allocation Tool) and Vanguard’s 60/40 Balanced Index. Again, a strong showing in 2012/13, but 2014 was a tough year for TO (and Ivy).

wbmix_4

Beyond strategy and performance, the folks at Whitebox continue to distinguish themselves as leaders in shareholder friendliness – a much welcomed and refreshing attribute, particularly with former hedge fund shops now offering the mutual funds and ETFs. Since last report:

  • They maintain a “culture of transparency and integrity,” like their name suggests providing timely and thoughtful quarterly commentaries, published on their public website, not just for advisors. (In stark contrast to other firms, like AQR Funds, which in the past have stopped publishing commentaries during periods of underperformance, no longer make commentaries available without an account, and cater to Accredited Investors and Qualified Eligible Persons.)
  • They now benchmark against SP500 total return, not just SPX.
  • They eliminated the loaded advisor share class.
  • Their expense ratio is well below peer average. Institutional shares, available at some brokerages for accounts with $100K minimum, have been running between 1.25-1.35%. They impose a voluntary cap of 1.35%, which must be approved by its board annually, but they have no intention of ever raising … just the opposite as AUM grows, says Mr. Coffey. (The cap is 1.6% for investor shares, symbol WBMAX.)

These ratios exclude the mandatory reporting of dividend and interest expense on short sales and acquired fund fees, which make all long/short funds inherently more expensive than long only equity funds. The former has been running about 1%, while the latter is minimal with selective index ETFs.

  • They do not charge a short-term redemption fee.

All that said, they could do even better going forward:

  • While Mr. Redleaf has over $1M invested directly with the fund, the most recent SAI dated 15 January 2015, indicates that the other three portfolio managers have zero stake. A spokesman for the fund defends “…as a smaller company, the partners’ investment is implicit rather than explicit. They have ‘Skin in the game,’ as a successful Tac Ops increases Whitebox’s profitability and on the other side of the coin, they stand to lose.”

David, of course, would argue that there is an important difference: Direct shareholders of a fund gain or lose based on fund performance, whereas firm owners gain or lose based on AUM.

Ed, author of two articles on “Skin in the Game” (Part I & Part II), would warn: “If you want to get rich, it’s easier to do so by investing the wealth of others than investing your own money.”

  • Similarly, the SAI shows only one of its four trustees with any direct stake in the fund.
  • They continue to impose a 12b-1 fee on their investor share class. A simpler and more equitable approach would be to maintain a single share class eliminating this fee and continue to charge lowest expenses possible.
  • They continue to practice a so-called “soft money” policy, which means the fund “may pay higher commission rates than the lowest available” on broker transactions in exchange for research services. Unfortunately, this practice is widespread in the industry and investors end-up paying an expense that should be paid for by the adviser.

In conclusion, does the fund’s strategy remain interesting? Absolutely. Thoughtfulness, logic, and “arithmetic” are evident in each trade, in each hedge. Those trades can include broad asset classes, wherever Mr. Redleaf and team deem there are mispriced opportunities at acceptable risk.

Another example mentioned on the call is their longstanding large versus small theme. They believe that small caps are systematically overpriced, so they have been long on large caps while short on small caps. They have seen few opportunities in the credit markets, but given the recent fall in the energy sector, that may be changing. And, finally, first mentioned as a potential opportunity in 2013, a recent theme is their so-called “E-Trade … a three‐legged position in which we are short Italian and French sovereign debt, short the euro (currency) via put options, and long US debt.”

Does the fund’s strategy remain compelling enough to be a candidate for your one all-weather fund? If you share a macro-“market” view similar to the one articulated above by Mr. Redleaf, the answer to that may be yes, particularly if your risk temperament is aggressive and your timeline is say 7-10 years. But such contrarianism comes with a price, shorter-term at least.

During the call, Dr. Cross addressed the current drawdown, stating that “the fund would rather be down 8% than down 30% … so that it can be positioned to take advantage.” This “positioning” may turn out to be the right move, but when he said it, I could not help but think of a recent post by MFO board member Tampa Bay:

“Far more money has been lost by investors preparing for corrections, or trying to anticipate corrections, than has been lost in corrections themselves.” – Peter Lynch 

Mr. Redleaf is no ordinary investor, of course. His bet against mortgages in 2008 is legendary. Whitebox Advisers, LLC, which he founded in 1999 in Minneapolis, now manages more than $4B.

He concluded the call by stating the “path to victory” for the fund’s current “intelligent value” strategy is one of two ways: 1) a significant correction from current valuations, or 2) a fully recovered economy with genuine top-line growth.

Whitebox Tactical Opportunities is facing its first real test as a mutual fund. While investors may forgive not making money during an upward market, they are notoriously unforgiving losing money (eg., Fairholme 2011), perhaps unfairly and perhaps to their own detriment, but even over relatively short spans and even if done in pursuit of “efficient management of risk.”