From the Mutual Fund Observer discussion board, January 2013
After last discussion, A Look at Risk Adjusted Returns, I wanted to explore further the issues of under performance and substantial down years for even top ranked risk adjusted funds. Building on a tip from MikeM:
I used to do my own risk analysis by just calculating the probability of what a fund could make or loose in any given year. Probability is just a calculation using the funds average returns and its standard deviation. Using 1x stdev would give you a probability confidence value of 68%. 2x stdev would be 95%.
Instead of standard deviation STDEV, however, I focused on the down side and draw down deviations that represent the denominators in Sortino and Martin ratios, respectively. The Sortino denominator is the annualized downside deviation DSDEV, which uses only monthly returns falling below TBill average. The Martin denominator is the Ulcer Index (UI), which is the square root of the mean of the squared percentage draw downs in value.
I imposed a threshold on these two measures to protect against substantial down year performance. The threshold assumed a simple, four fund portfolio – one fund in each broad type (equity, asset allocation or “balanced,” fixed income, and money market), each holding equal share.
For pain threshold, I used 15% loss for the portfolio in a down year. Nominally, this translates to a maximum tolerable loss of 30% in the equity fund, 20% in asset allocation fund, 10% in the fixed, and zero for money market.
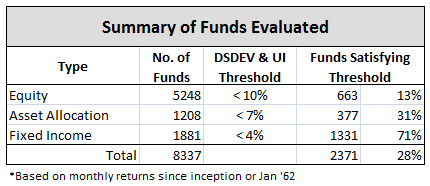
Accounting for a 3x deviation down side occurrence (more conservative than MikeM’s example), the attendant thresholds become 10% for equity funds, 7% for asset allocation, and 4% for fixed income, in round numbers.
First off, it is extraordinary just how many equity funds fail to meet this 10% down side threshold on either DSDEV or UI! Here is a summary of funds evaluated, all oldest share class:
Once the funds were screened for down side volatility, I simply sought top returning funds for each type, relative to SP500 for equity and asset allocation, and TBill for fixed income and money market. This step protects against selecting an under performing fund that may have a very high risk-adjusted rate of return. Below is the result, by fund inception date:
- Worst performing year (highlighted in red) was 2008, of course, with the 15+ age group portfolio down the most at -13.7%, but still within the -15% pain threshold.
- Overall portfolio lifetime returns (green) appear very respectable for all age groups, most even beating SP500 (blue), despite the healthy cash holding.
- Great returns are achievable without high volatility, evidenced by some seriously good funds included on this list, like Sequoia SEQUX, Vanguard Wellesley Inc Investor VWINX, Mutual Quest Z MQIFX, Oakmark Equity & Income I OAKBX, Osterweis Strategic Income OSTIX, and Yacktman Svc YACKX.
- The 25+ age portfolio produced 9.7% APR versus 8.9% for SP500. It includes stand outs Vanguard Health Care Investor VGHCX, T. Rowe Price Cap Appreciation PRWCX, and PIMCO Total Return Institutional PTTRX.
- The 5+ age portfolio produced 7% APR versus 1.7% for the SP500. It includes MainStay Marketfield I MFLDX and PIMCO Income A PONAX. – In the 40+ age group, only one money market fund existed, so that was included by default, even though it has a negative lifetime Sharpe.
Of the fifteen fixed income funds in the 50+ age group, none met the less the 4% down side volatility criteria. I’m pretty impressed with the result actually. The simple approach imposed a 10-7-4 down side volatility screen, then sought top returning APR, un-adjusted. Now, if I could only figure out how to ensure it works going forward…
Here is link to original thread.


