I wrote Business Cycle: Boring Bond Funds at Seeking Alpha in June 2019, describing the yield curve and that conditions were favorable to increase allocations to bonds. In hindsight, I believe that a “soft landing” would have been achieved had it not been for the COVID-induced recession. The conservative accounts that I manage are now fully invested in bonds. In this article, we will look at “Spicy Bond Funds” for those who are interested in high yield and safety. Spicy, but not too hot, and easy to manage!
There are several important considerations for investing in bonds. First, the S&P 500 earnings yield is less than the 10-year Treasury which has not occurred since the Dotcom Bubble. The stock market is overvalued by most metrics, and the return on the S&P 500 has slowed to 1.4% over the past three months. Second, the risk premium for duration and investment-grade bonds is low. This favors shorter-duration bonds with opportunities in investment-grade bonds. Third, inflation is sticky and expectations for higher inflation are rising. Fourth, policy uncertainty about tax cuts, tariffs, deporting immigrants, and spending cuts are adding to volatility and the long end of the yield curve is flattening.
I use about twenty metrics from Mutual Fund Observer to rank over three hundred bond funds by Risk, Yield, Quality (including duration), Trends, and Returns weighted for a conservative investor such as myself to identify favorable Lipper Categories and high-performing funds. I preselected the funds based on risk-adjusted return and Fund Family Rating, among other factors. Performance during the COVID bear markets is one of the twenty metrics used in my ranking system. I use the MFO Great Owl rating to increase the “Rank” of funds and the “Three Alarm” rating to punish those with deteriorating performance. I use “Bullish” and “Bearish” ETF bond screens at Fidelity and Relative Strength Index (RSI) from Seeking Alpha to “bend” my rating for shorter-term momentum.
Risk Premium
The Core, General, and Corporate BBB-rated funds that I track had an average annualized return of 4.7% over the full cycle from November 2007 until December 2019 with an average APR of 0.6% during the Great Financial Crisis bear market. This compares to 8.4% for the S&P 500 over the same full cycle and -41.4% during the bear market. The bonds have a 30-day yield of 4.8% compared to 1.2% for the S&P 500. Bonds are subject to inflation, duration, and quality risk. Uncertainty can also impact bond performance.
Inflation Risk
Figure #1 shows the expected inflation to be around 2.6% in the next 5 years, on average as estimated by the breakeven inflation rate. It has risen from a recent low of 1.9% in September as inflation has proven to be sticky and concerns over tariffs. The consumer price index came in higher than expected for January increasing 3.0% over the past twelve months, and 0.5% for the past month. In reaction, the yield on the 10-year Treasury jumped to 4.64%.
Figure #1: 5-Year Breakeven Inflation and Yield on 10-Year Treasuries
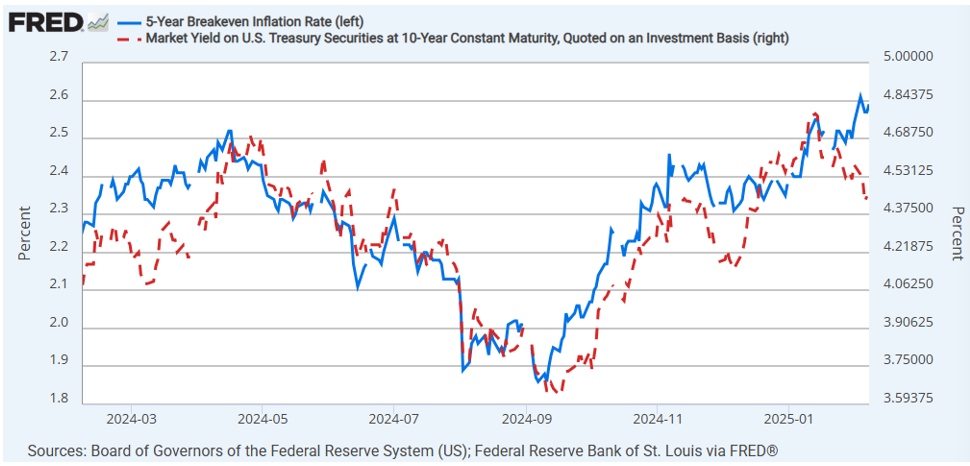
Source: Federal Reserve Bank of St. Louis FRED Database: 5-Year Breakeven Inflation Rate [T5YIE]; Board of Governors of the Federal Reserve System (US), Market Yield on U.S. Treasury Securities at 10-Year Constant Maturity [DGS10]
The Republican administration has suggested opening more federal land for oil leases. It takes time and money to explore these fields, evaluate the results, build the infrastructure, and drill the production wells. I don’t expect the benefits to lower inflation in the near term especially when the $72 price per barrel provides little incentive to invest.
Duration Risk
I use the yield curves from the 2004 to 2007 period to demonstrate duration risk. Bond values are inversely related to yields, and longer durations are more sensitive to changes in the yield. During this period, yields on the 10-year Treasury fluctuated around 4.5% within a range of +/- 0.6%. The dark line is the yield curve at the time of this writing. I expect it to be range bound between roughly 4.0% and 5.5% until inflation is under control and there is more clarity on the budget deficit.
Figure #2: Anatomy of the Yield Curve and Inflation (2004 to 2007)
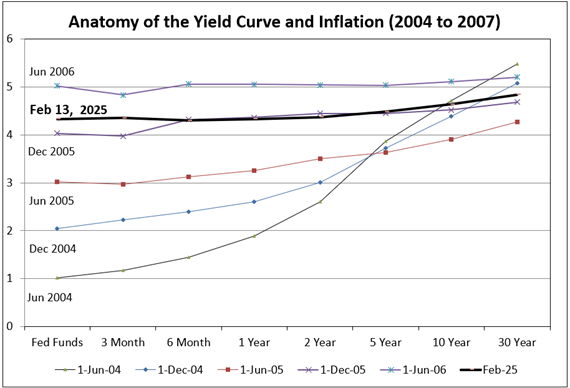
Source: Author Using St. Louis Federal Reserve FRED Database
Pola Rocha at Investopedia explains why yields on longer duration bond rates are likely to stay higher for longer in The Treasury Secretary Says Trump Wants Long-Term Rates to Fall—It May Take a While. The Federal Reserve controls short-term rates, but long-term rates are driven more by inflation and government borrowing among other factors. Since the middle of September, the yield on the 10-year Treasury rose from 3.6% to 4.8% before declining to 4.4% recently. Today, it has risen back above 4.6% over hotter-than-expected inflation readings for January.
Preston Caldwell, Hong Cheng, and Dominic Pappalardo at Morningstar explain in Why Long-Term Interest Rates Aren’t Falling—And What That Means For Your Portfolio that the biggest driver of higher inflation expectations is probably higher expectations for economic growth and the strength of the labor market leading to more upward pricing pressure. They suggest investors should consider moderately extending the duration of their portfolios to capture potential gains despite the likelihood of further steepening. They favor intermediate-term Treasuries.
Credit Quality Risk Premium
Figure #3 is based on median yields for bonds from Fidelity. For investing in investment grade bonds with a 3-year duration, an investor is receiving a historically low premium of only 0.5%, and to invest in Treasuries with a 10-year duration instead of a 2-year duration, that investor receives the same yield with no duration premium. I find the one-to-four-year duration in investment-grade debt to be attractive for taxable bonds.
Figure #3: Median Yield Curves and BBB to Treasury Spread
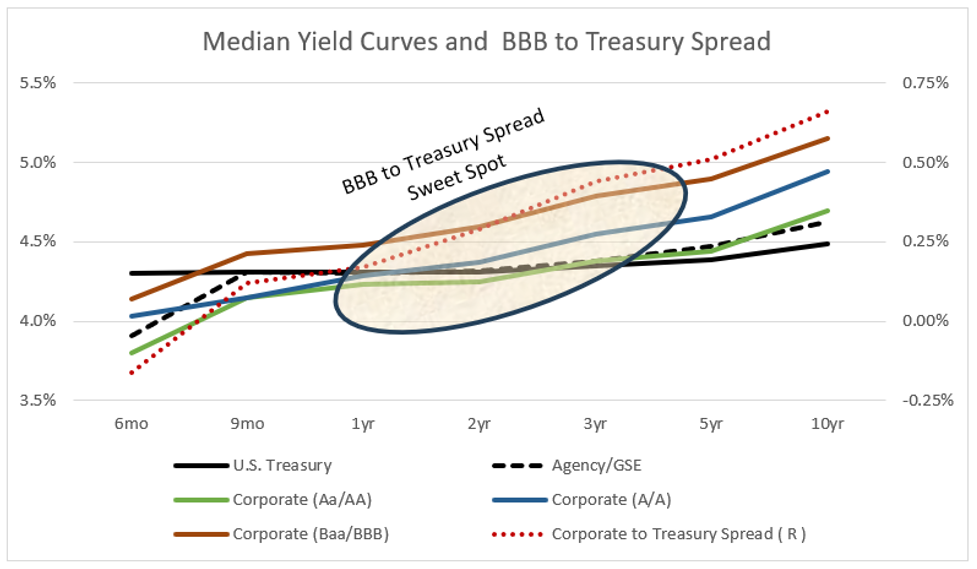
Source: Author Using Fidelity Fixed Income Data
Policy Uncertainty
The policy changes from the new administration add uncertainty regarding tariffs, inflation, tax cut stimulus, spending cuts, budget deficits, and national debt levels. The Federal Reserve’s continuing Quantitative Tightening adds supply of long-term debt.
Portfolio Assessment
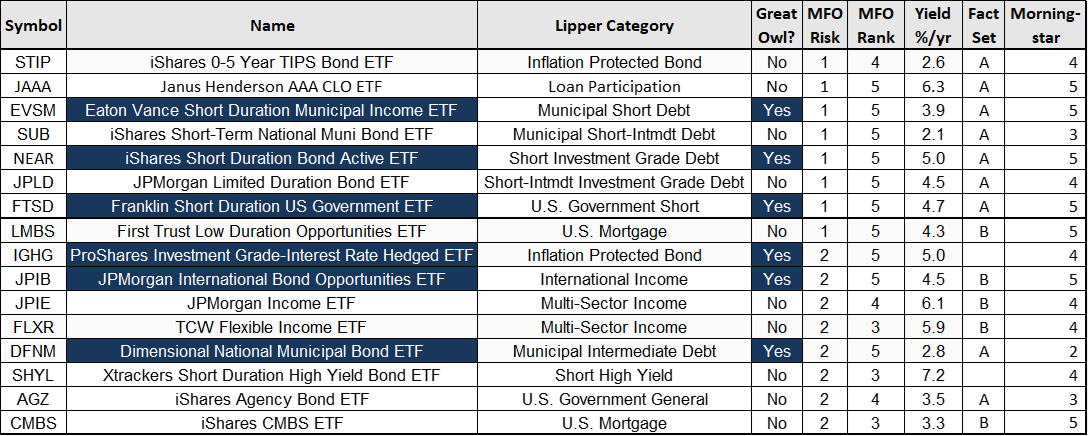
I created Table #1 to show a comprehensive snapshot of how bond funds are performing and to better understand how I am invested. They are sorted from my highest ranked Lipper Category to lowest. The highest-ranked five funds are shown for each Lipper Category. The Tier One Categories are those with a higher risk-adjusted yield with better recent performance. They tend to have shorter durations. Tier Two Categories step further into the risk spectrum with slightly longer durations and lower quality, but still have a high risk-adjusted yield. Tier Three Categories are those with longer durations and lower risk-adjusted yields. I adjusted the yields and returns of tax-exempt funds higher to be the tax equivalent for an investor in the 22% tax bracket.
Of the bond funds that Fidelity, Vanguard, or I manage, 21% are in Tier One, 12% are in Tier Two, and 48% are in Tier Three with another 18% in bond ladders. Fidelity and Vanguard manage the more aggressive side of investments and use more core bond funds, while I manage the conservative side of Bucket #2 for the intermediate term. The yield on the taxable bond funds that I manage is 5% excluding the bond ladders. I built the bond ladder mostly in Treasuries and Agency bonds with yield to maturity of 4% or higher but with low dividends. I will be investing for a sustainable higher yield as the bonds mature.
Table #1: Metrics for Lipper Categories with High Yields
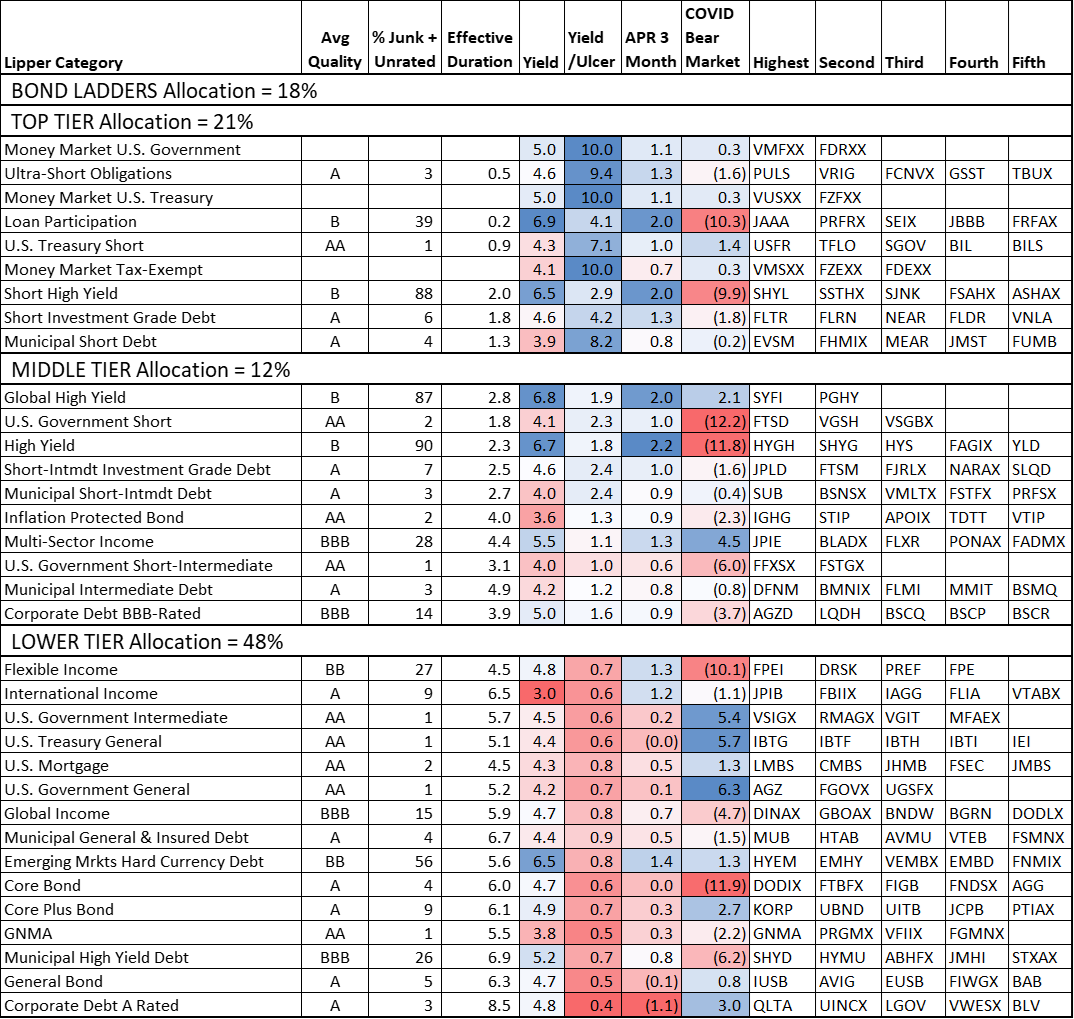
Source: Author Using MFO Premium fund screener and Lipper global dataset.
Strategies For 2025
Barbell Strategy
The barbell strategy is a tactical strategy that involves buying short-term and long-term bonds depending upon the shape of the yield curve but nothing in between. Steve Johnson describes the barbell strategy in ‘Barbell’ Effect Helps Fixed Income Newcomers Usurp Traditional Bond Funds published in the Financial Times. Investors are moving away from actively managed mutual funds that sit in the middle to lower cost, actively managed funds on one end, and alternative vehicles, such as private credit and infrastructure debt funds, at the other. Of the top five bond funds per Lipper Category that I track, 75% are actively managed and 65% are exchange-traded funds.
Bond Ladder Strategy
The bond ladder strategy is an all-weather strategy that invests in bonds that mature in given years in order to produce a steady stream of income. The main advantage is that rates can be locked in when high. The disadvantages of bond ladders are the high barrier to entry, less liquidity, default risk, and the risk of rates rising. I have about 18% of my bond investments in individual bonds (rungs) that mature each year (spacing).
Exchange-traded funds that are designed to be rungs on an ETF bond ladder have been around for over a decade. Invesco manages Bulletshares bond funds and BlackRock has iShares iBonds that pay a dividend and mature in a particular year. They come in the flavors of Corporate Debt BBB-Rated, High Yield, Inflation Protected, U.S. Treasury General, and Municipal Bonds. Table #2 shows the number of funds and assets under management of these funds.
Table #2: Bond Ladder ETFs.

Source: Author Using MFO Premium fund screener and Lipper global dataset.
They have the advantages of simplicity, diversification, liquidity, and flexibility. The disadvantages are that an active investor has the advantage of being able to selectively pick higher-yielding bonds, the dividends are not as predictable, and in the final year bonds that have matured are reinvested in Treasury bills.
Author’s Strategy
As a retiree, I am interested in stability and a steady stream of income. As I have written previously, traditional portfolios with a stock-to-bond ratio of 60/40 are expected to have below-average returns of around 6% in the coming decade compared to 8.3% during the 2010 decade. I see opportunities in short to intermediate-term investment-grade credit. I have been shifting from core bond funds in Tier Three to short and short-intermediate investment grade bond funds in Tier One and Two. I have been spicing up my portfolio with lower risk, higher yielding funds in the Loan Participation, High Yield with 1-to-3-year durations, and multi-sector bond funds.
I avoid high-yielding funds that require a significant amount of time tracking the industries and management changes as well as hot new funds without at least three years of performance history.
Janus Henderson Aaa Clo ETF (JAAA)
One of the funds that I have been buying is the Janus Henderson Aaa Clo ETF (JAAA) in the Loan Participation category. It is not the spiciest fund in the spice rack. The reasons that I like it are that it invests 95% in “AAA” bonds, only has 15% in the top ten holdings, has $20B in AUM, 92% is securitized, and expense ratio of 0.21%. During its four-year life, it has returned 4.6% annually with a maximum drawdown of 2.3%. It has a TTM yield of 6.32%. It has an MFO Risk of “1” for “Very Conservative” and is in the top quintile for risk-adjusted performance in the loan participation category. It has a FactSet rating of A, and a 5-star Morningstar rating. It is not without its risks though, with 58% invested in South America, and with 68% of its investments classified as long-term. It is not a tax-efficient fund, so I own it mostly in Traditional IRAs.
Table #3 compares the highest-performing loan participation funds by my ranking system.
Table #3: Bond Ladder ETFs – Three-Year Metrics
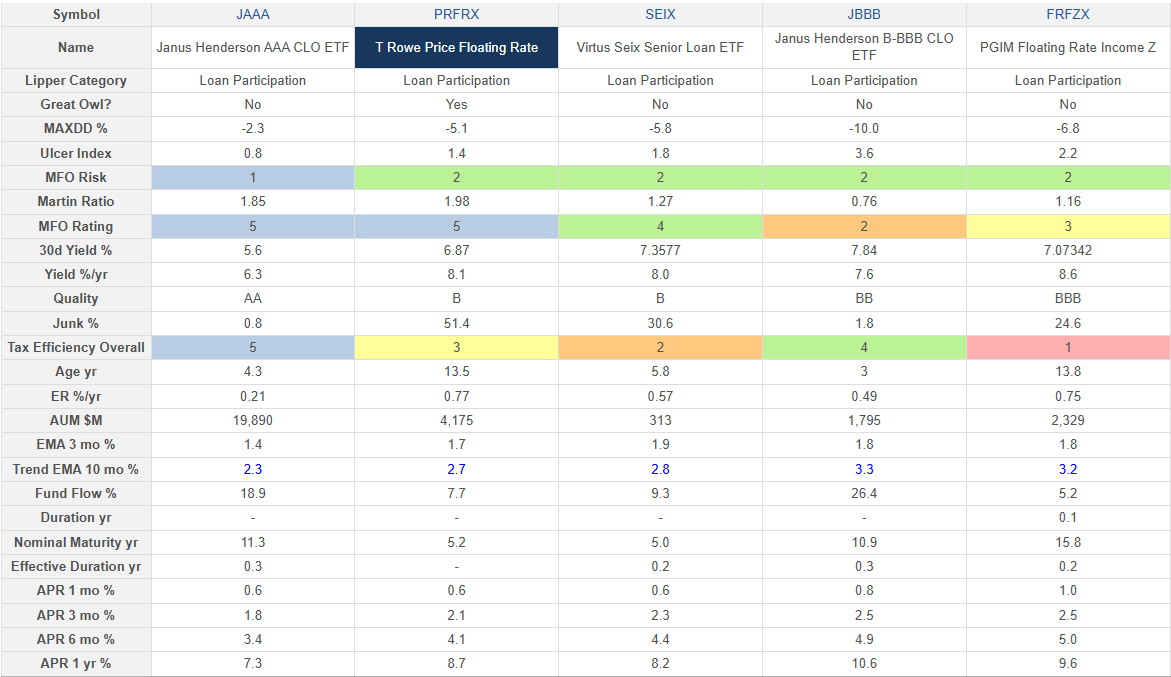
Source: Author Using MFO Premium fund screener and Lipper global dataset.
Figure #4 shows that while JAAA does not have the highest return, it has the lowest drawdown. That’s my kind of spice!
Figure #4: High-Performing Loan Participation Funds
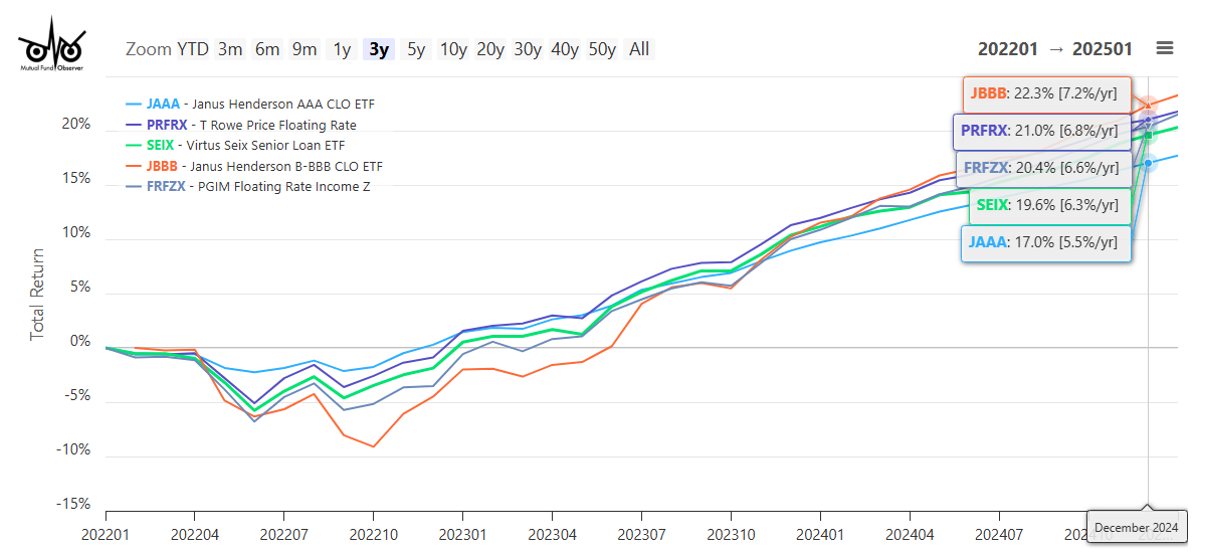
Source: Author Using MFO Premium fund screener and Lipper global dataset.
Closing
Are you looking for a good place to start? Below is a list of some of the exchange-traded funds that my system is telling me to look at. I own shares in Janus Henderson AAA CLO ETF (JAAA), iShares Short Duration Bond Active ETF (NEAR), and iShares 0-5 Year High Yield Corporate Bond ETF (SHYG). Invesco Global ex-US High Yield Corporate Bond ETF (PGHY) interests me but is not yet on my radar screen.
Table #4: Bond Ladder ETFs