


Uncertainty is in the air. Do you feel it? The price-to-earnings ratio of the S&P 500 is approaching 30 and is within bubble territory which implies below average long-term returns. Thirty-five percent is concentrated in the top ten holdings and 46% is concentrated in the Technology and Financial Sectors. The economy is stronger than expected and inflation pressures still exist so volatility is high. The yield on the 10-year treasury fell from 4.7% last April to 3.6% in September back up to 4.8% last month and has fallen to 4.6%. Bond investors are expecting rates to remain higher for longer and want to be compensated for duration risk.
President Trump campaigned on the platform of tax cuts which are a stimulus but historically did not pay for the lost revenue, deregulation which would be viewed favorably by the markets, on implementing tariffs which most economists believe are inflationary, on deporting illegal immigrants which could shrink the labor pool and increase inflation, and on cutting Federal spending which would tend to slow growth. Lowering the Federal Funds rate faster would be another stimulus which could increase inflationary pressures. The Treasury started “extraordinary measures” on January 21st to avoid hitting the debt limit. There are a lot of moving parts, so I got my financial house in order over the past few months.
The S&P 500 has had total returns over the past two years of 50% and as a result, my allocation to stock climbed to 65%. I made no changes to my investment strategy because of the election; however, I have made changes based on high valuations and high interest rates.
Higher For Longer Rates
The Federal Reserve is projecting a cautious approach to lowering short-term rates and still has nearly $6 trillion of longer-duration bonds to find buyers for as Quantitate Tightening continues. The yield curve has steepened as shown by the black line in Figure #1 but is still flat compared to 1992, 2003, and 2010. The blue diamonds represent the FOMC Summary of Economic Projections for the Federal Funds Median Rate at year-end for the next three years. If realized, the short end of the curve will fall very slowly over the next three years benefitting short-term bond prices, but the long end could steepen another one or two percentage points as bond investors demand a higher return for holding bonds with longer durations.
Figure #1: Yield Curves for 2025, 2010, 2003, and 1992
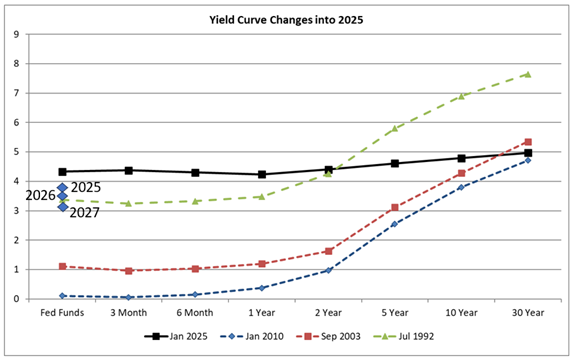
Source: Author Using St. Louis Federal Reserve FRED Database
Figure #2 shows the yield on the ten-year Treasury (blue line, left scale), average ten-year Treasury Yield since 1990 (dotted blue line, left scale), and inflation (black line, left scale). Without Quantitative Easing which lowered long-term rates beginning in 2008, rates will tend to normalize higher. The Federal Debt (red line, right scale) has risen from $3T in 1990 to $35T in 2024 and will add pressure to longer-term yields.
Figure #2: Ten Year Treasury Yield, Inflation, and National Debt.
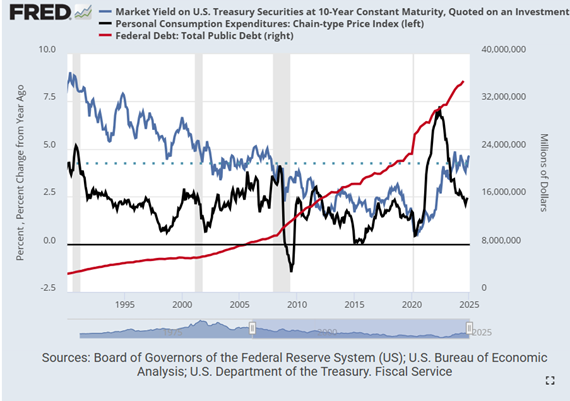
Source: Author Using St. Louis Federal Reserve FRED Database
The nonpartisan Congressional Budget Office released The Budget and Economic Outlook: 2025 to 2035 which includes the national debt rising by $23.9 trillion over the next decade, excluding additional tax cuts, to $52.0 trillion in 2035 which is 118% of GDP.
Joachin Klement wrote a post on Substack called A Watershed Moment For Bond Yields. He describes a study by Martin Ademmer and Jamie Rush from Bloomberg evaluating real 10-year bond yields over the last 50 years. Mr. Klement wrote:
“But most importantly, note that the trend real bond yield has started to increase again since 2015. And there are two crucial factors that drive this increase in real bond yield. The increasing deficits of governments and the shift in the global balance between supply and demand for safe assets have both pushed up real bond yields.
This is a watershed moment, we are witnessing here. For the first time in the last 50 years we see evidence that bond markets are demanding a ‘risk premium’ for US Treasuries because supply outstrips demand.”
I will add that Quantitative Tightening is a factor, and two ratings agencies have lowered ratings on US debt. One important thing to keep in mind is that the yield on a 10-year Treasury rising from 0.6% in 2020 to 4.8% currently represents a rise of 700 percent. A rise from 4.8% to 6.0% is only a rise of 25%. Bond prices may be less sensitive to smaller increases. I favor intermediate duration bonds, and will wait and see before investing in long bonds. This puts me in with the bond vigilantes who want to be compensated for duration risk.
Portfolio Adjustments For 2025
Preparing for 2025, I reduced my overall stock-to-bond ratio to around 60% selling equity funds that I manage and withdrawing from balanced portfolios that Fidelity and Vanguard manage to replenish my Safety Bucket for living expenses and emergencies. The final change to my portfolio was to change the strategy of intermediate Bucket #2 conservative sub-portfolios from total return to investing for income. In 2026, if stocks are performing poorly, I will rely on my yield of over 5% and bond ladders will provide steady cash flow. If stocks continue to perform well, I will withdraw from Bucket #2 aggressive sub-portfolios to take more risk off the table.
My overall bond exposure is approximately 60% percent invested in Core Bond, General Bond, International Income, and Money Markets, 20% invested in high-quality bond ladders, 15% in Municipal Bonds, and 10% invested in high yielding bond funds mostly located in Traditional IRAs. All but two of the bond funds that I own have an MFO Risk Rating of Conservative or Very Conservative. My bond portfolio is diversified and has slightly lower quality than the Bloomberg Barclays U.S. Aggregate Bond Index.
Taxable Bonds
I wrote Investing in 2025 And the Coming Decade which included Figure #3 showing Vanguard’s ten-year outlook. Note that Vanguard projects U.S. Treasury Bond returns to be in the range of 4.1%–5.1% but says that more extreme returns are possible. Bond yields have secular trends which I believe will be higher for longer. For the several past months, I have been studying how riskier bond funds perform in different market conditions. “Searching For Yield in All of The Safe Places” covers eight Lipper Categories with high yields and low to moderate risk as inspired by the following chart. I selected high-performing categories and funds based on Risk, Yield, Return, Quality, Trend, and Tax-Efficiency.
Figure #3: Vanguard VCMM 10-Year Return vs Volatility Projections
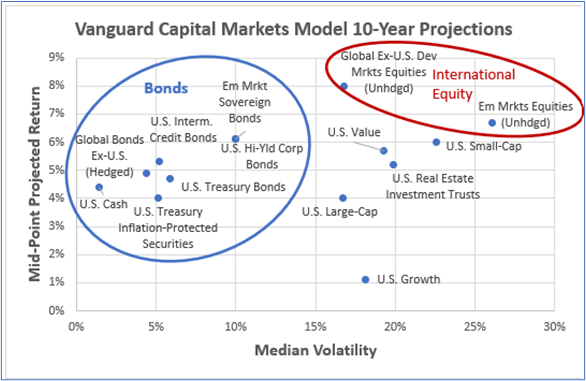
Source: Author Using Vanguard Perspective (October 22, 2024)
Vanguard projects that Emerging Market Sovereign bond funds will do well over the next ten years, but they are absent in the categories that I cover because they can be very volatile. Instead of investing directly in emerging market bonds, I invest in actively managed funds in other categories where managers diversify into emerging markets.
Of the Intermediate Buckets that I have set up for income, approximately half is in bond ladders, 25% in core bond holdings yielding 4.7%, and 25% is in the high-yielding funds described in this article yielding 5.4% for a combined yield of 5.1%. I can add to the bond ladder with quality individual non-callable bonds for four to five years with a yield to maturity of 4.5% to 5.0%. The advantage of the bond ladders is that they don’t fluctuate in value if held to maturity.
Table #1 contains one or two of my favorite high-yielding funds from each of the eight Lipper Categories. It is packed with useful information about risk (MFO Risk, MaxDD %, Bear Markets), risk-adjusted return (MFO Rating), returns (APR, Full Cycle), trends (Fund Flow, Exponential Moving Average), quality (Quality, Junk), and expenses (ER, Ferguson Mega Ration), and yield.
Table #1: Author’s Select High Performing Funds Per Lipper Category (2.5 Year Metrics)
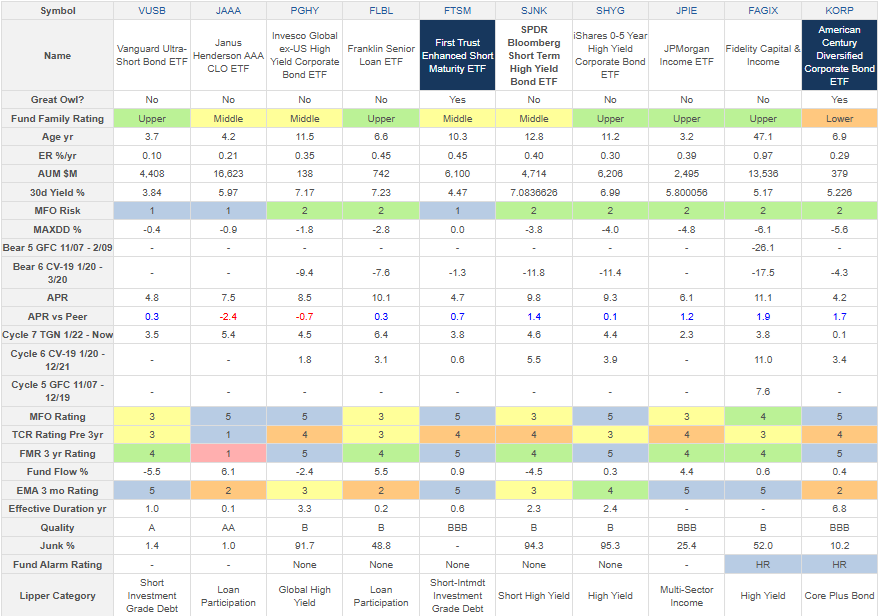
Source: Author Using MFO Premium fund screener and Lipper global dataset.
Table #2 is an example portfolio where I balanced yield and risk to my liking. The MFO Risk of the portfolio is “Very Conservative”. It would have returned 5.1% APR over the past 2.9 years with a current yield of 6.5% and a maximum drawdown of 4.8%. Note that it has 30% allocated to loan participation funds with 15% in the most conservative Janus Henderson AAA CLO ETF (JAAA). I have room in my own portfolio to increase yield with low risk.
Table #2: Example Yield with Safety Portfolio
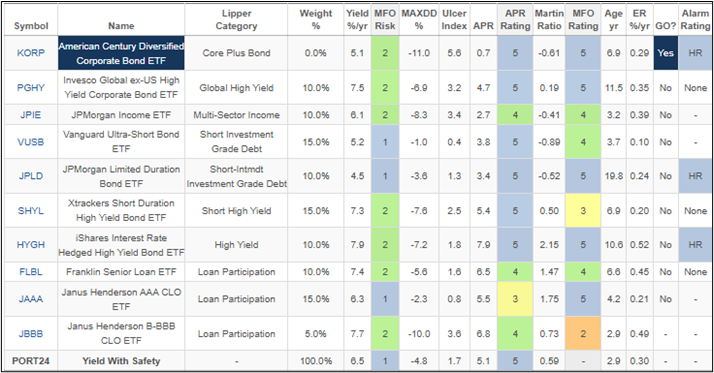
Source: Author Using MFO Premium fund screener and Lipper global dataset.
Tax Exempt Bonds
One of my objectives is to invest tax efficiently. I own Roth IRAs, and Traditional IRAs, and have accounts for tax efficiency and tax loss harvesting. There is a tradeoff between higher taxable yields and lower tax-exempt yields.
“Searching For High Tax-Exempt Yield” is a companion article this month that describes some high-performing tax-exempt bond funds. Table #3 contains some of my favorite Municipal bond funds in six different Lipper Categories. Tax-exempt yields range from 3% on the low-risk left side of the table to 4% on the higher-risk right side. The article gives some tips for why some investors may choose to invest in Municipal bonds.
Table #3: Author’s Select High Performing Funds Per Lipper Category (3-Year Metrics)
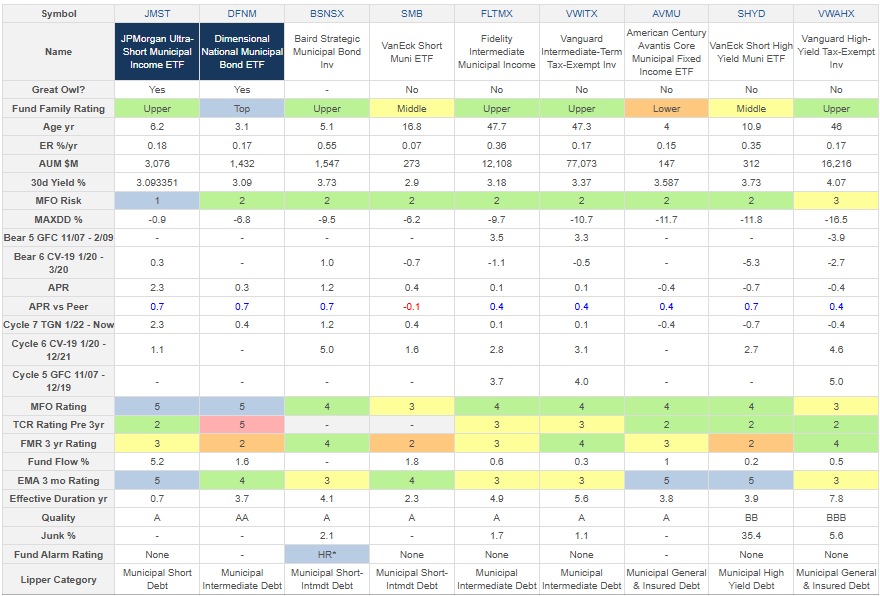
Source: Author Using MFO Premium fund screener and Lipper global dataset.
Closing
I don’t anticipate making any major changes to my portfolio in 2025. I expect stocks to perform well but with volatility during the first half of this year and will do a mid-year reassessment then. I have some bonds in my bond ladder maturing that I need to reinvest. I will invest some for liquidity, and roll the rest back into the bond ladder at higher yields and to ensure steady income for the next five to ten years.
I consulted with Financial Advisors at Fidelity and Vanguard on withdrawal strategies and automated an account for investing and withdrawals. If the stock market is high, I plan to withdraw from accounts with high equity ratios, and if the stock market is low, I want to rely on fixed income and bond ladders.