President-elect Trump is picking his staff appointees who are perceived by some to be controversial, unqualified, or even extremists. The justification is often that they are disruptors who will challenge the status quo. The rhetoric is increasing about adding tariffs, eliminating agencies, reducing regulations, and cutting Federal spending and staff. Rhetoric moves markets. This article is about protecting our portfolios from chaos during times of high uncertainty.
During the first three years of President Trump’s first term, Federal spending increased by nine percent after adjusting for inflation. This was partly because the 2017 tax cuts did not generate sufficient growth to pay for themselves. During the next four years with the pandemic-era stimulus, Federal spending increased by an additional seventeen percent adjusted for inflation. Federal spending is now approximately $7.1 trillion with a deficit of $1.7 trillion that is financed by adding to the approximately $36 trillion in national debt with interest costs of $1 trillion to finance that debt. This is not sustainable.
I expect slow growth this coming decade because population growth continues to slow and is a key driver of economic growth, Federal spending is part of the economy, and cutting it will have to be offset by other drivers. Tariffs are inflationary, and interest rates will have to stay higher for longer to finance the national debt. With stock evaluations and interest rates high, returns over the intermediate term favor bonds. Another factor to consider is that the dollar has advanced nearly 40% since 2011 which has kept import costs low, but also appears overvalued.
To evaluate a Chaos Protected Portfolio, I selected between 1,600 to 3,300 funds from each of the 2000, 2010, and 2020 decades and ranked them based on risk and return metrics. The top-ranked funds were combined and ranked by risk-adjusted performance for the Dotcom, Great Financial Crisis, and COVID full cycles as well as the past twenty-five years.
There are some loose similarities between now and the Dotcom Full Cycle from September 2000 to October 2007 as shown below. The end result was that the S&P 500 fell 45% during the Dotcom bear market.
- The S&P 500 price-to-earnings ratio hovered between 27 and 46 during 2000 and 2001 compared to nearly 31 now.
- The dollar fell 25% from 2002 to 2008.
- Inflation hovered between 2.0% and 3.5%.
- The Federal Funds rate went from 6.5% in mid-2000 to 1% in 2004 and back up to 5.3% in 2007.
- Real Gross Domestic Product went from 4% in 2000 to 1% in 2001 to 3.8% in 2004 and back down to 2% in 2007. A mild recession occurred.
- Gold went from $293 per ounce in 2000 to $696 in 2007. It is now $2,685.
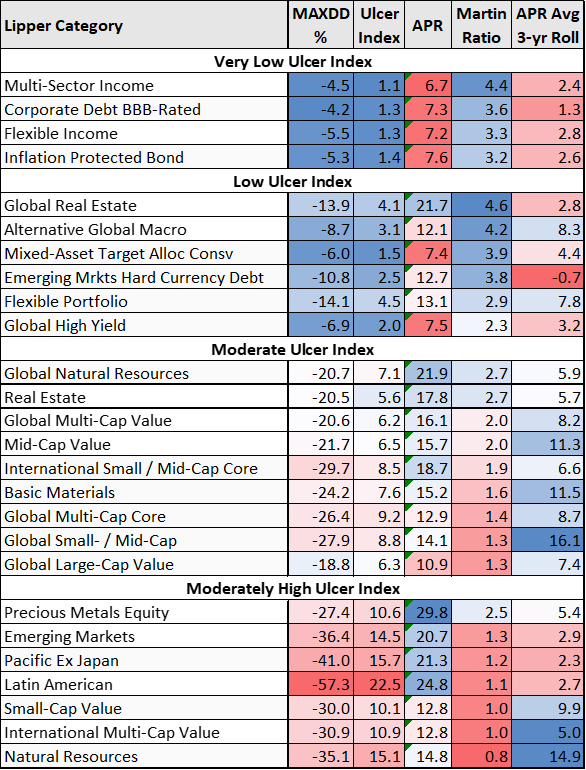
Table #1 shows some of the best-performing Lipper Categories during the Dotcom full cycle from September 2000 to October 2007. For comparison purposes, over the full cycle, the Ulcer Index of the S&P 500 was 22, the annualized percent return was 1.9%, and the Martin Ratio was -0.1. The Ulcer Index measures risk as the depth and length of drawdowns, and the Martin Ratio is a measure of risk-adjusted returns.
Table #1: Lipper Categories for the Chaos Protected Portfolio (Full Cycle September 2000 to October 2007)
I created an all-weather portfolio for the past twenty-five years as shown in Table #2. There is a tradeoff between risk and return. A younger me aggressively invested one hundred percent in stocks, while an older and more conservative me now holds a traditional 60% stock to 40% bond allocation based on matching withdrawal needs with time horizons using the Bucket Approach. The Chaos Protected Portfolio reflects my personal biases that one should maintain diversified portfolios, and in the coming decade, I expect bonds to perform better than stocks on a risk-adjusted basis. The Chaos Protected Portfolio would have returned 5.9% with a maximum drawdown of 22% over the past twenty-five years compared to a return of 10% for the S&P 500 with a maximum drawdown of 51%. MFO Risk for the Chaos Protected Portfolio is estimated to be “2” for Conservative, and the APR rating is Above Average.
Table #2: Chaos Protected Portfolio (25.8 Years)
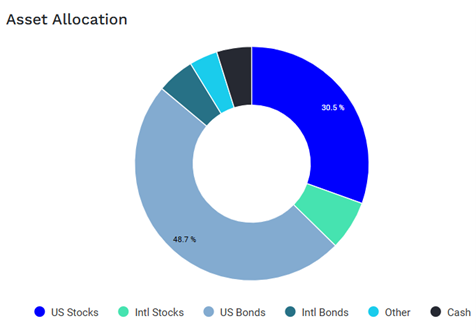
I used Portfolio Visualizer to see the current asset allocation of the portfolio which is about 37% stocks with seven percent allocated to international stocks.
Figure #1: Chaos Protected Portfolio Asset Allocation

Source: Author Using Portfolio Visualizer – Backtest Portfolio Asset Allocation
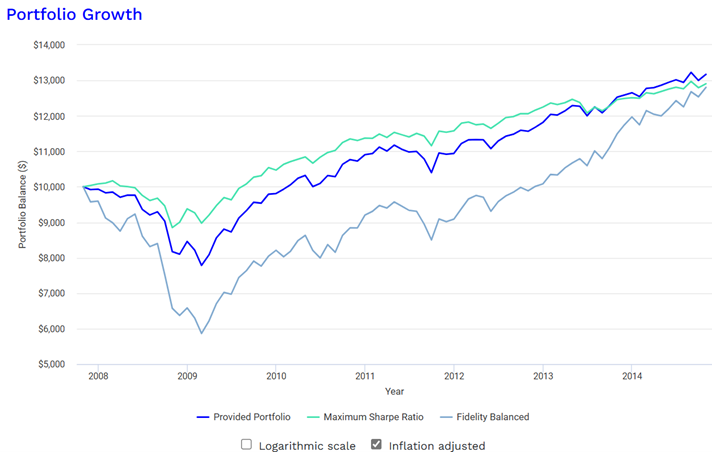
Figure #2 shows how the Chaos Protected Portfolio would have performed during the Great Financial Crisis compared to the same funds that maximized the Sharpe Ratio and to the Fidelity Balanced fund. The returns are adjusted for inflation. It would have taken seven years for the Fidelity Balanced Portfolio to catch up to the level of the Chaos Protected Portfolio. This is known as “sequence of return risk”.
Figure #2: Chaos Protected Portfolio Performance During the Great Financial Crisis

Source: Author Using Portfolio Visualizer – Portfolio Optimization – Great Financial Crisis
I am currently reading How to Retire: 20 Lessons for a Happy, Successful, and Wealthy Retirement by Christine Benz, Director of Personal Finance and Retirement Planning for Morningstar which was released in September. There is a wealth of information in it even for those of us already in retirement. She points out that sources of withdrawals should be based on market conditions, and mixed asset funds may not be as advantageous as a mixture of stock and bond funds for selecting where to withdraw funds. She advocates allocating ten percent to cash because in some years both stocks and bonds may perform poorly. Another point that I find useful is to structure your portfolio to be flexible with withdrawals and match discretionary spending to market conditions.
Extending tax cuts are likely to have a positive effect on stocks in 2025 and perhaps 2026 but with high valuations, returns will probably be dampened. High standard deductions and lower tax rates will help retirees. There will be winners and losers in tariff wars. Deregulation will help financial institutions, but increase risk.
I use Fidelity to manage a portion of my assets using the business cycle approach, and Vanguard to manage a portion using a low-cost buy-and-hold approach. I manage the rest based on my expectations. I have adjusted part of my portfolio along with the concepts in this Chaos Protected Portfolio article and the Bucket Approach advocated by Ms. Benz. Through small adjustments and rebalancing, my allocation to stocks has been reduced by about three percentage points. I view this as taking a little risk off the table after the recent rise in the stock market. I concentrate risk in my Bucket #3 for long-term growth and to minimize taxes.
I maintain diversified bond funds in my conservative tax-advantaged accounts. With interest rates high and a soft landing likely, I recently increased allocations to moderately riskier actively managed bond funds including Vanguard Global Credit Bond (VGCIX), Vanguard Intermediate-Term Investment-Grade (VFICX), Vanguard Multi-Sector Income Bond (VMSIX), and Fidelity Advisor Strategic Income (FADMX/FSIAX). This is consistent with this article of building a Chaos Protected Portfolio. I prefer these funds to High Yield funds.
I have appointments set up with my advisors next year to withdraw from more aggressive tax-advantaged accounts instead of conservative accounts to further pull a little risk off the table while replenishing Bucket #1 for living expenses.
Enjoy a safe and happy holiday season!


