Dear friends,
Planting trees is a venture into the future, it is a hand held out to other generations.
Mirabel Osler
Embracing Chaos: Reflections on Growth Amidst Uncertainty
As I sit down to write this month’s letter, I’ve been wandering around my garden thinking what an unsalvageable mess it is: an unlovely and unidentifiable tangle of dead stems, fall leaves, stubble, trash mysteriously blown in, and the occasional corpse. (Typically avian.) It’s hard not to despair of it. And, hard not to imagine parallels to the political world.
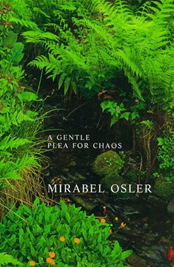 British gardeners excel at quirkiness. Even among them, I could imagine that Mirabel Osler (1925-2016) ranked in the top tier. Mirabel Osler crafted an unconventional path in gardening and writing, coming to both later in life. She lived in Thailand, where she adopted her son, and Corfu, then returned to England. After her husband’s death, she transformed their Shropshire garden into what she called “controlled chaos,” incorporated snails (which most relentlessly extirpate) into the plan, joked about not letting god know that she was playing god, and, at 64, wrote A Gentle Plea for Chaos (1989), which advocated for letting plants grow naturally rather than forcing them into artificial arrangements.
It’s a short book though, in truth, I think it would have been better as a pamphlet or an hour-long conversation over dinner.
Here’s the argument: nature is chaotic, which is beautiful and necessary. Chaos, in its essence, is not inherently destructive—it is a force that can either nurture growth or sow havoc, depending on how we engage with it. Humans, and human spaces such as gardens, need to grasp that and deal with it. The interplay of light, soil, and seed creates something far more resilient and alive than any meticulously planned arrangement. She draws a distinction between the kind of chaos that breathes life into a system—productive chaos—and the kind that tears it apart, which we might call havoc.
In nature, productive chaos is the storm that clears deadwood, making way for new growth. It is the unpredictable interplay of species that fosters biodiversity and resilience. Havoc, on the other hand, is the invasive species that chokes out life, the erosion that strips the soil of its vitality. The difference lies in the outcome: one creates the conditions for renewal, while the other leaves only destruction in its wake.
This distinction feels particularly relevant today. The political chaos we are witnessing could be seen as a form of havoc—a force that threatens to erode trust, destabilize institutions, and deepen divisions. Yet, within this turmoil, there is also the potential for productive chaos: the opportunity to reexamine old systems, to challenge entrenched norms, and to cultivate new ways of thinking and being. Just as a garden thrives when it embraces a degree of wildness, societies and economies can find strength in adaptability and innovation.
This is not to minimize our current anxieties. But just as a garden’s apparent chaos conceals complex systems of resilience, our democratic institutions have deep roots and multiple layers of resistance to authoritarian impulses. Independent courts assert their authority. Civil servants maintain their professional ethics. International relationships, built over decades, prove more resilient than any individual’s declarations. Markets, like nature, have a way of routing around damage and finding new paths forward.
As investors, we are no strangers to chaos. Markets, like ecosystems, are dynamic and unpredictable. Yet, it is precisely in these moments of uncertainty that the most compelling opportunities often emerge. This may be a pivotal moment. The key is to discern between the chaos that signals transformation and the havoc that portends decline.
Until we have a handle on how far the repercussions will spread, we have two sets of recommendations.
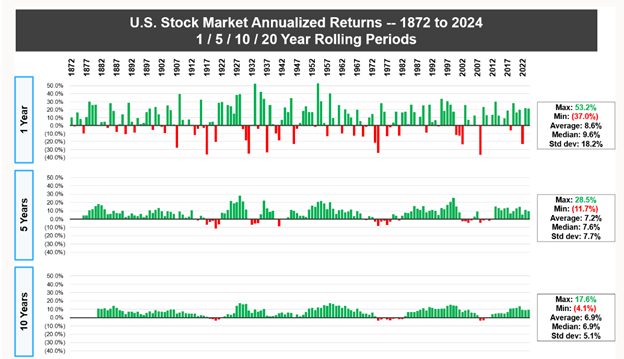
For folks born since 1990 or so, take a deep breath.
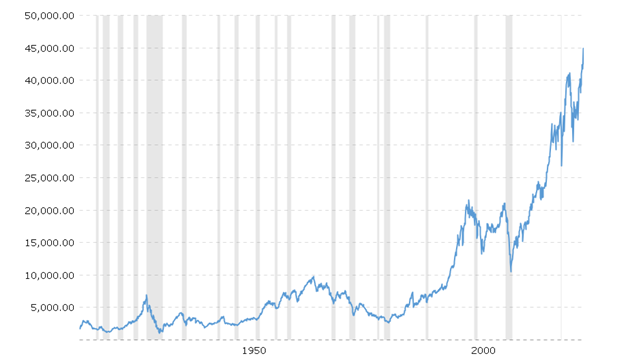
See that broad blue-gray bar over toward the left? That was the Great Depression and the rise of Hitler’s empire. Arguably, the worst period in world history since the Dark Ages. Twenty-five years later, it was left in the dust. Quicker, if you’d continued investing in a diversified portfolio. Every subsequent disaster has recovered in about a decade. Probably the best use of your time just now is not guessing about the market or gaming Bitcoin. Concrete actions:
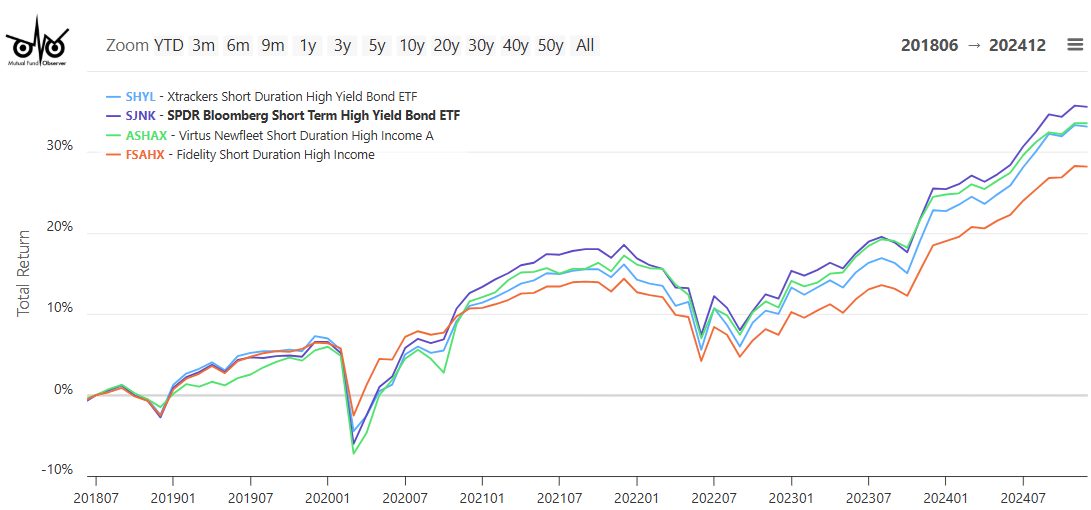
- Fund your emergency account – really, knowing that you’ve got the next two to three months’ worth of bills covered buys a lot of peace of mind. My portfolio uses RiverPark Short Term High Yield for that role, but Schwab has a bunch of money market funds yielding over 4% just now.
- Don’t make bets on markets – remember the adage, “The house always wins.” Find a boring investment – high-quality stocks, short-term high-yield bonds – that makes long-term sense for you but is soooo dull. Invest modestly and regularly. Look in on it about once a year.
- Obsess about politics only if you choose to engage in politics – that is, doom-scrolling carries an enormous psychological cost. If you’re using your heightened vigilance to plan action, that’s great. If you’re merely addicted to the horror genre, it’s time to step away from your feed. Valentine’s Day impends. Why don’t you track down a new recipe, research some cool dinner music, find a friend, make a friend, invite a friend (or friends), and hug them? That’s a simplified version of sound psychological advice.
For those of us with shorter time horizons, we’d consider five immediate actions:
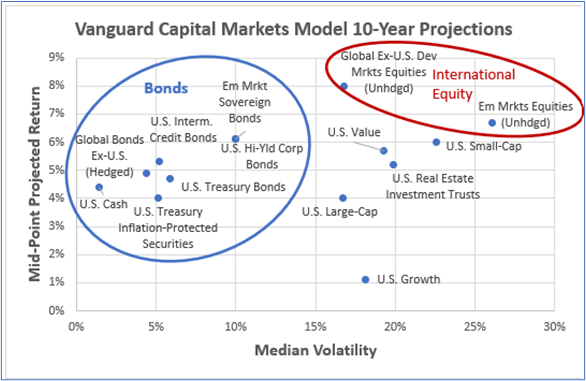
- Do not count on the stock market – valuations are at epic levels, with speculative funds like ARK Innovation ETF popping up 10% in the month of January, far more than the 2-3% gains of more mainstream market indexes. Such markets tend to be incredibly fragile.
- Prefer quality over momentum – “momentum” comes down to “what was working will continue working,” which has been an intermittently disastrous assumption. While quality rarely soars, it also is typically underpriced and resilient.
- Consider a small position in a hedge-like fund – they tend to be expensive and few have justified their existence, but we’ve tracked a handful of well-run funds that have succeeded with hedged equity positions or with a managed futures strategy that uses very short-term signals to short falling classes while investing in rising ones. Standpoint Multi-Asset charges 1.49% with a five-year return of 12%, a beta of 23, and a downside capture of 22. Dynamic Alpha Macro, meanwhile, weighs in with a 1.98% e.r. but booked top percentile returns in its Morningstar peer group during its first year of operation. The argument here is simple: it’s far easier to remain calm and focused when something in your portfolio is holding up as the little voice in your head shouts “run! Run! Runnnnn!”
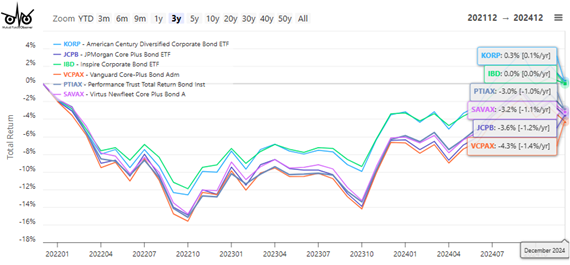
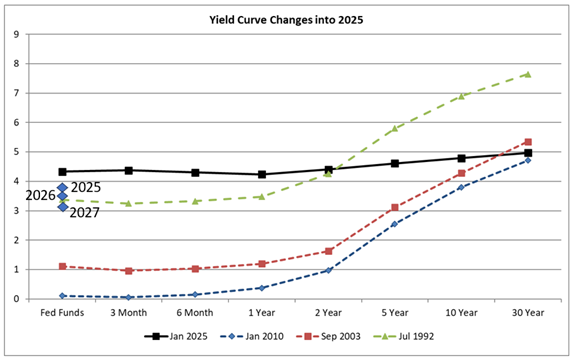
- Do not rule out bonds as a competitor to stocks – while I’m skeptical of debt-weighted bond index funds, Lynn makes a strong argument for the asset class just now.
- Fund your emergency account – really, knowing that you’ve got the next two to three months’ worth of bills covered buys a lot of peace of mind. My portfolio uses RiverPark Short Term High Yield for that role, but Schwab has a bunch of money market funds yielding over 4% just now.
 Even in the wildest of gardens, there is a quiet order beneath the surface—a reminder that life, in all its complexity, finds a way to flourish.
In this month’s Observer …
In “The Rising Tide of Water Infrastructure: A Guide for Strategic Investors,” I follow up on suggestions from MFO discussion community members to recognize the unique opportunities offered by investments targeting water infrastructure.
“The Indolent Portfolio, 2024” is the latest installation in my annual portfolio disclosure. It offers suggestions for how to build a low-maintenance portfolio and a three-fund alternative to my admittedly sprawling collections. (PS, the portfolio itself did just fine last year.)
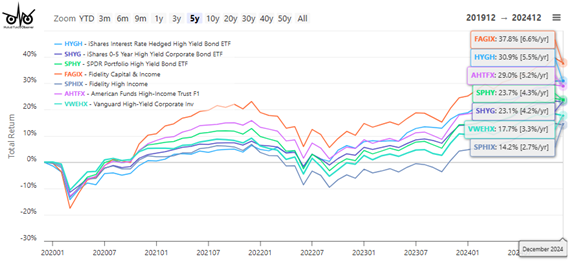
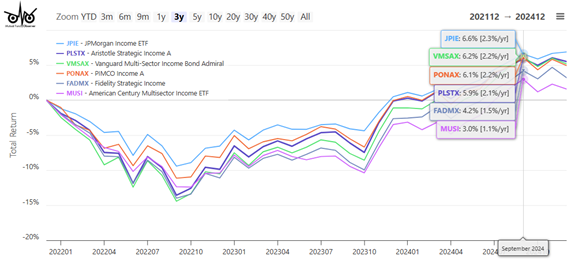
Our colleague Lynn Bolin does a sort of fixed-income tour de force with three related articles. “Income Investment Strategy for 2025” highlights concerns about high stock valuations, persistent inflation, and expectations of “higher for longer” interest rates. Lynn discusses his personal portfolio adjustments, reducing stock exposure to 60% and emphasizing income-generating investments. The article presents a thoughtful approach to building a diversified bond portfolio with a mix of core bonds, bond ladders, municipal bonds, and high-yield options.
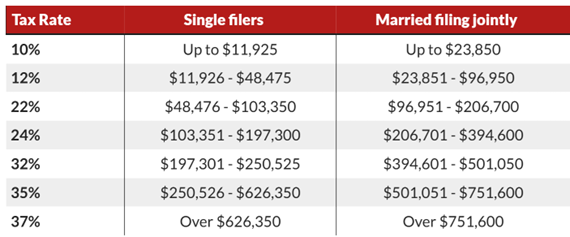
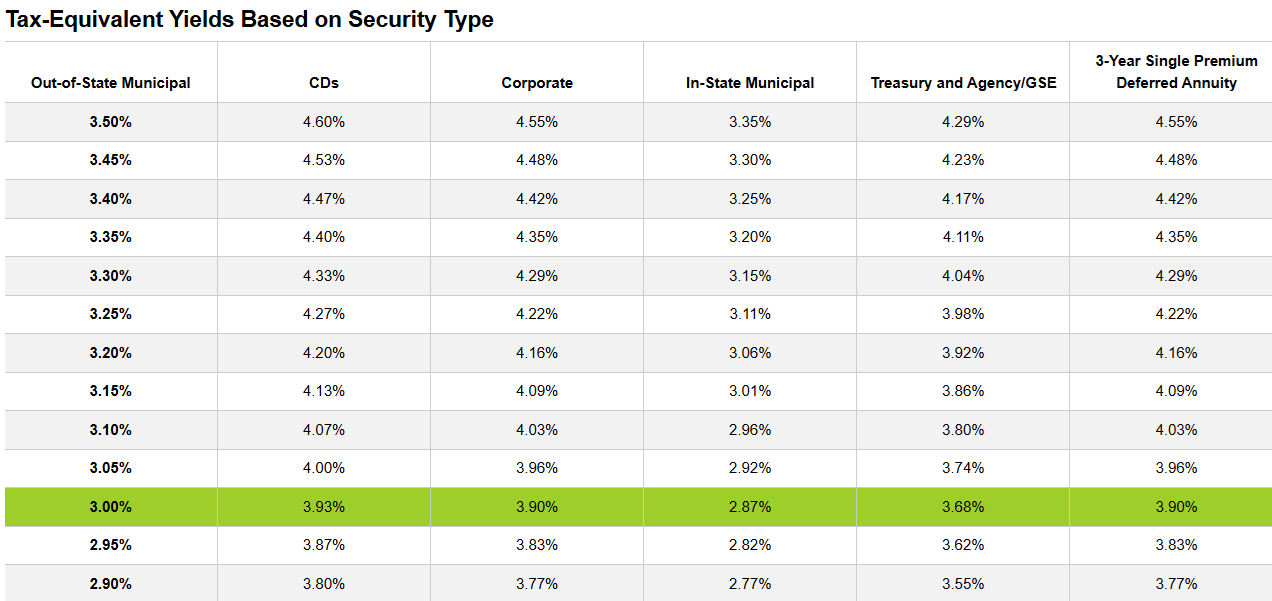
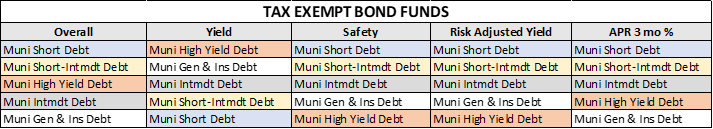
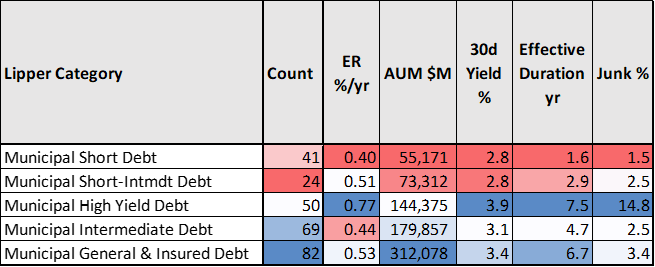
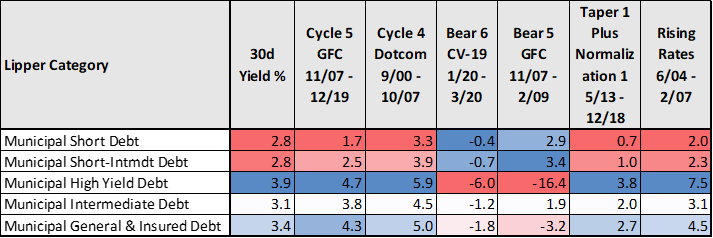
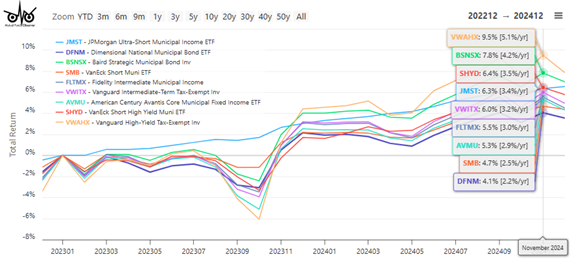
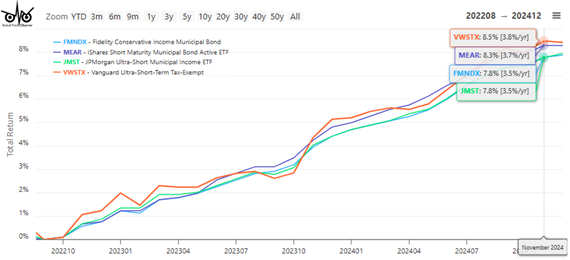
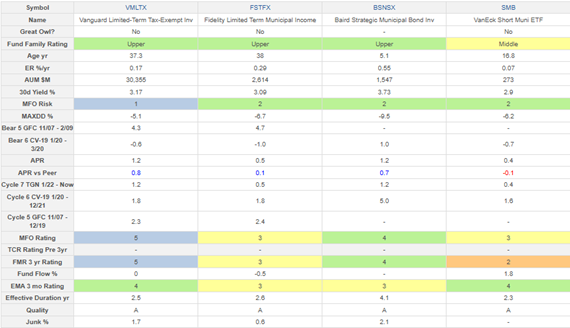
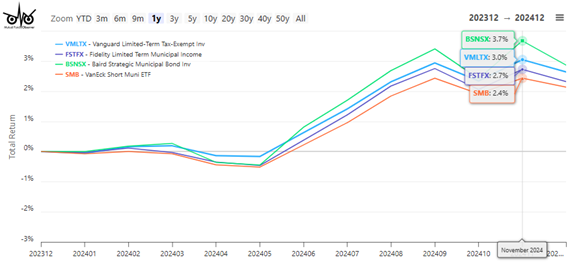
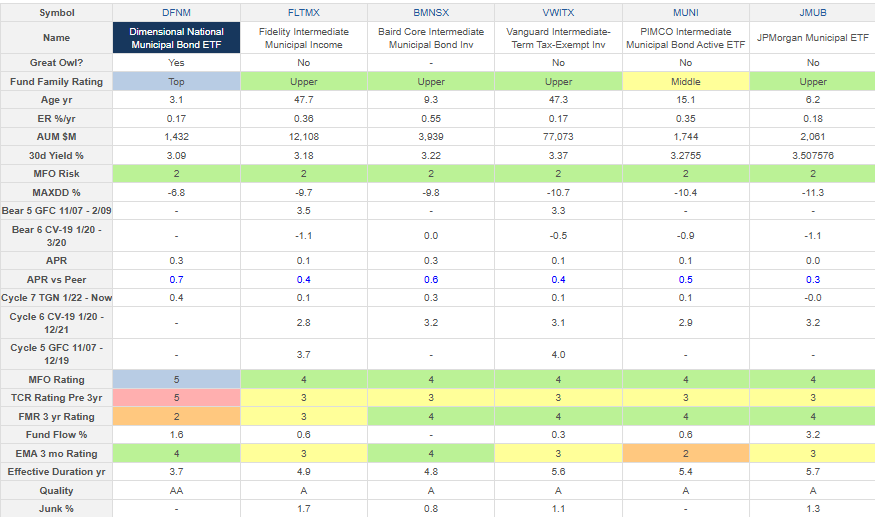
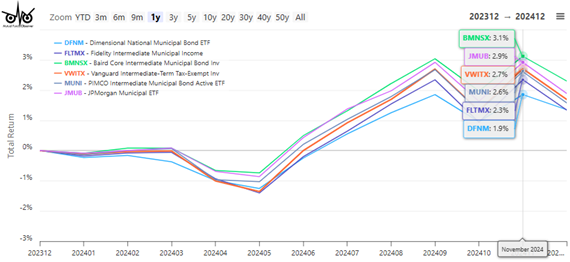
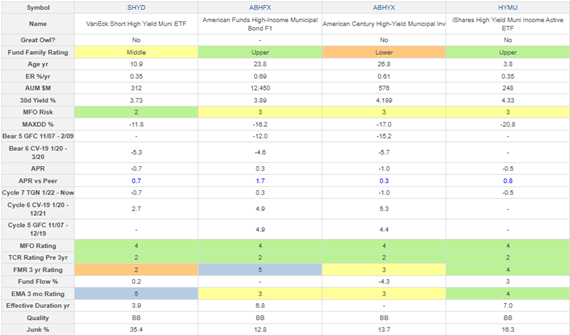
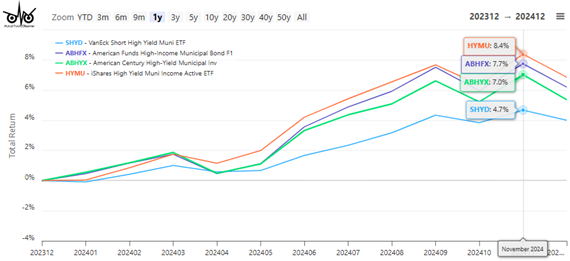
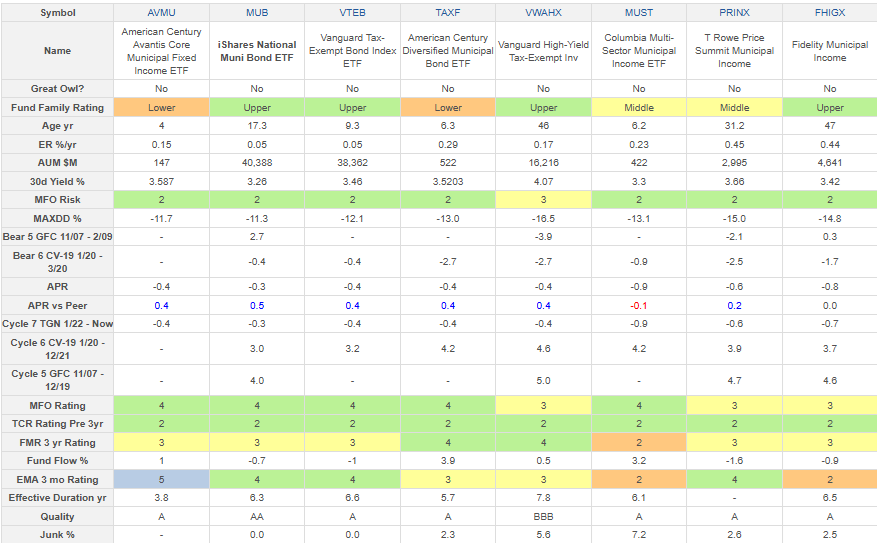
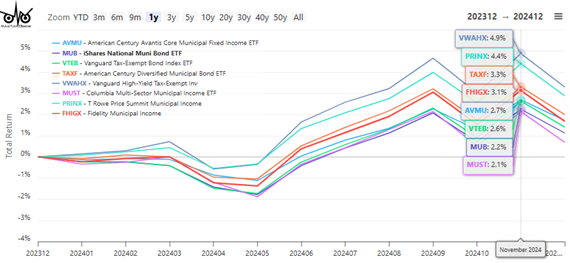
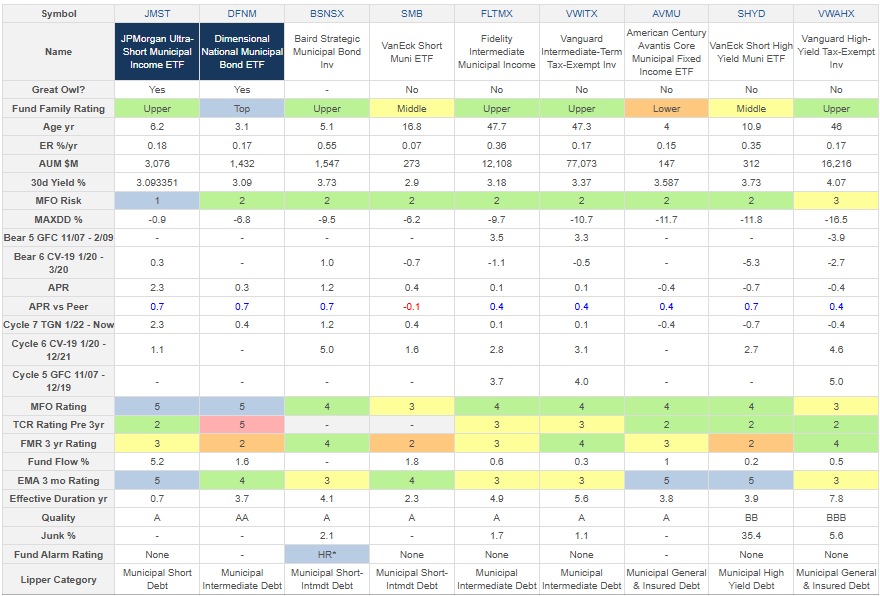
“Searching for High Tax-Exempt Yield” is an exploration of municipal bond investment opportunities across different risk categories. Lynn examines five Lipper municipal bond categories, analyzing their risk-adjusted returns and tax advantages. He provides detailed comparisons of various municipal bond funds, from low-risk short-term options yielding around 3% to higher-risk options yielding around 4%. The piece includes practical tax considerations and explains when municipal bonds might be appropriate for different investor profiles.
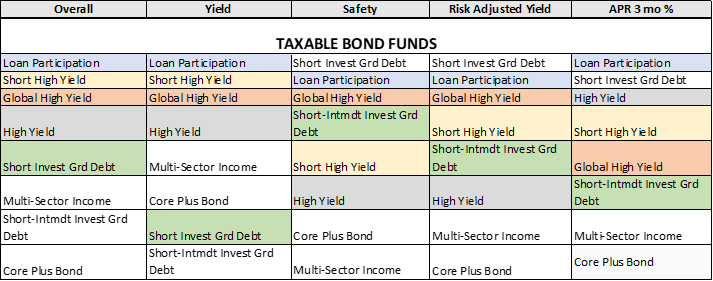
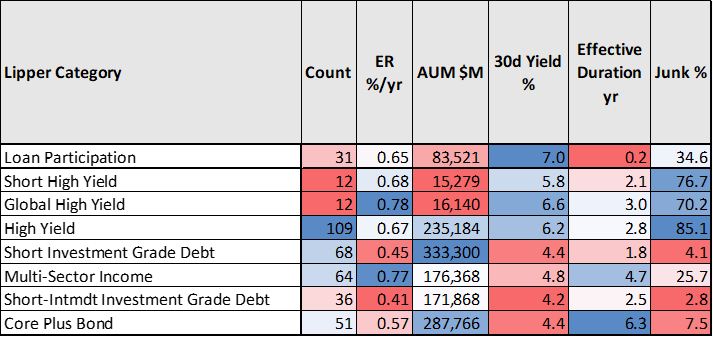
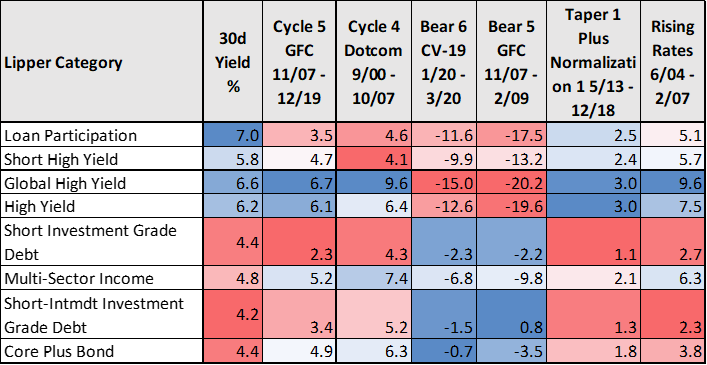
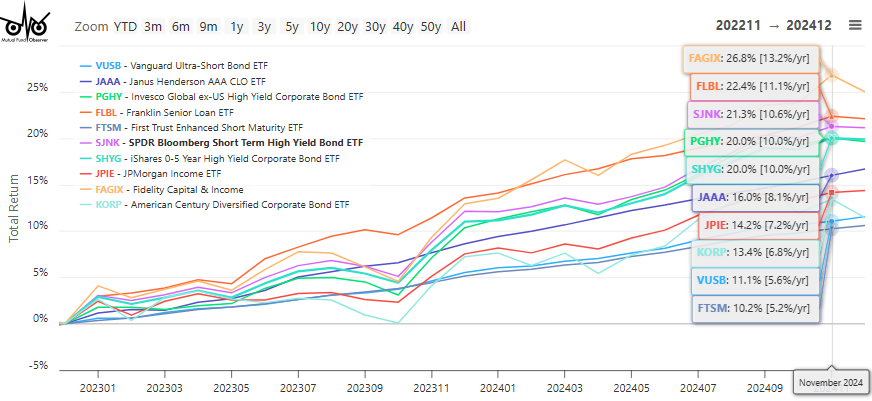
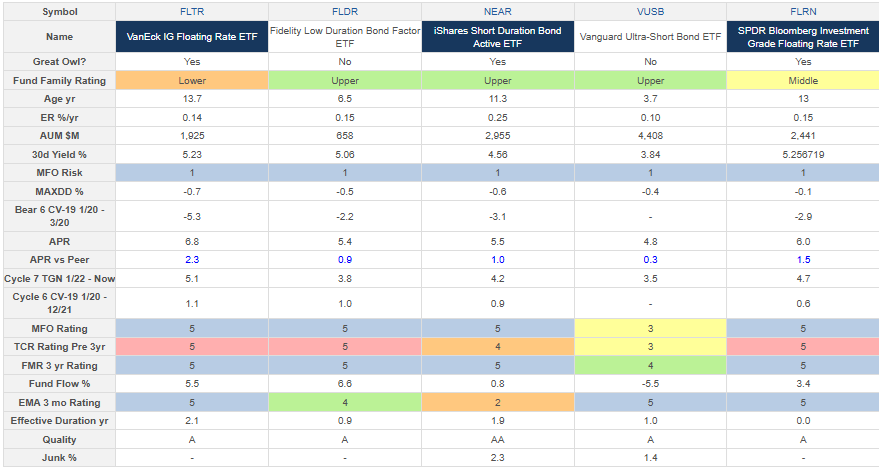
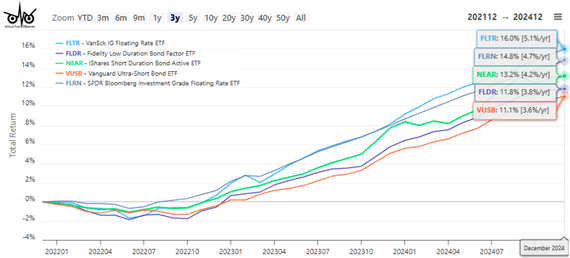
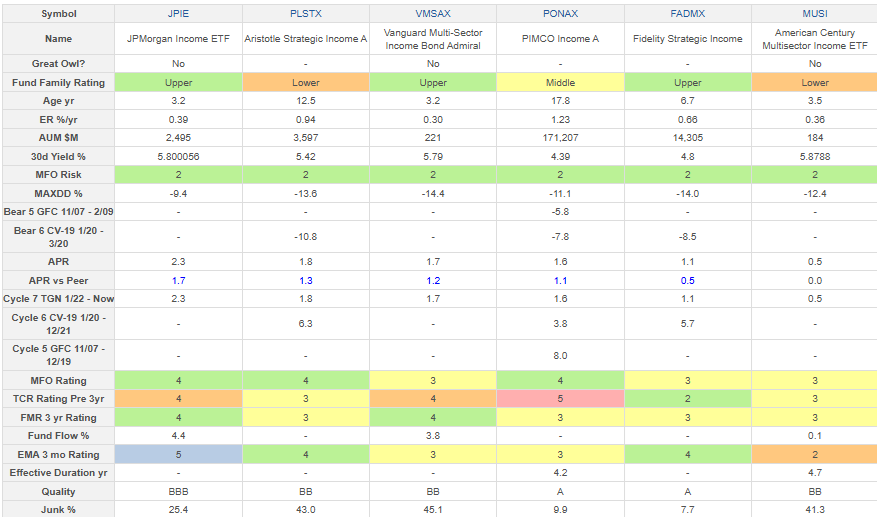
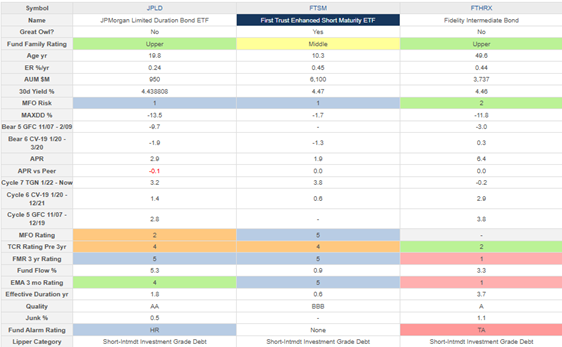
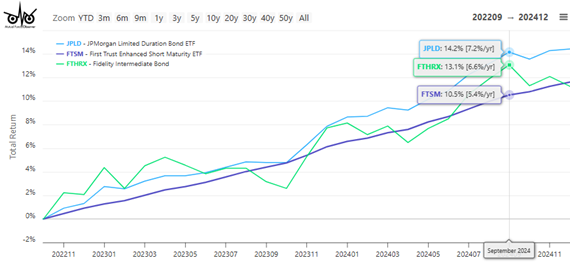
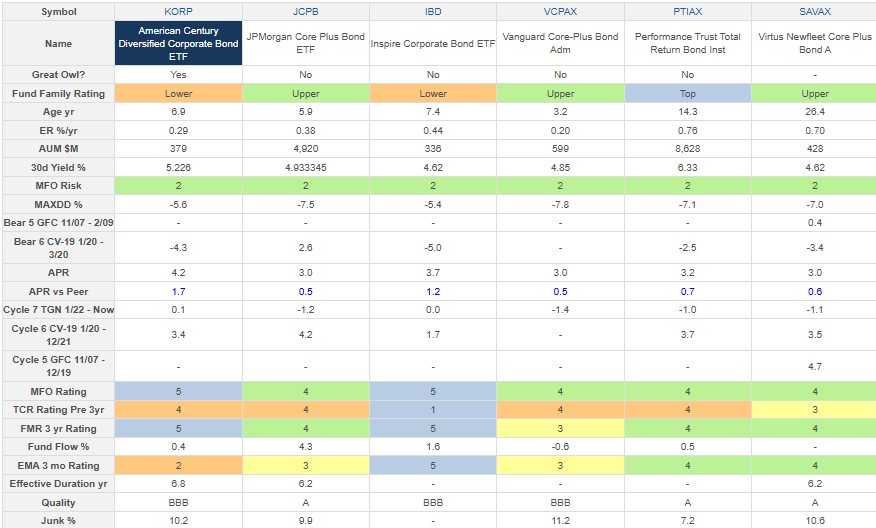
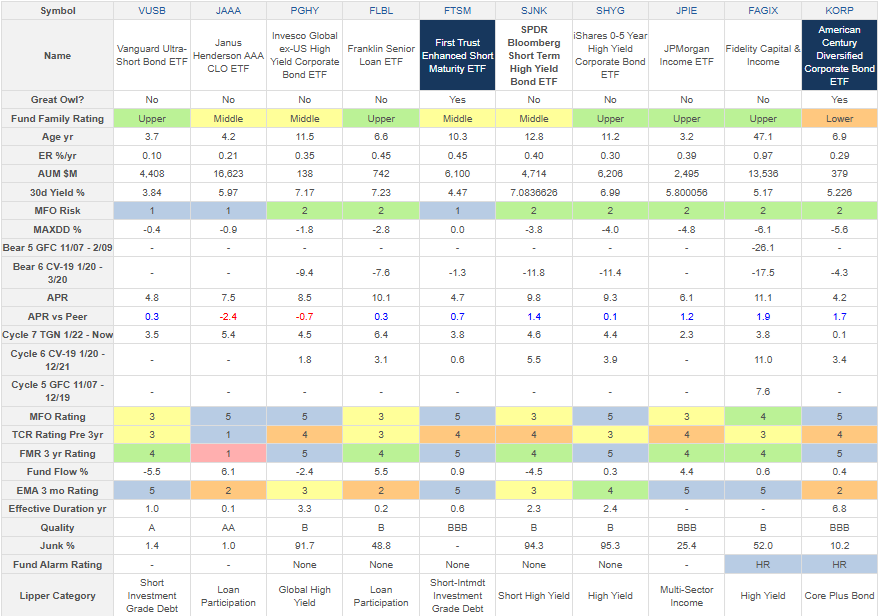
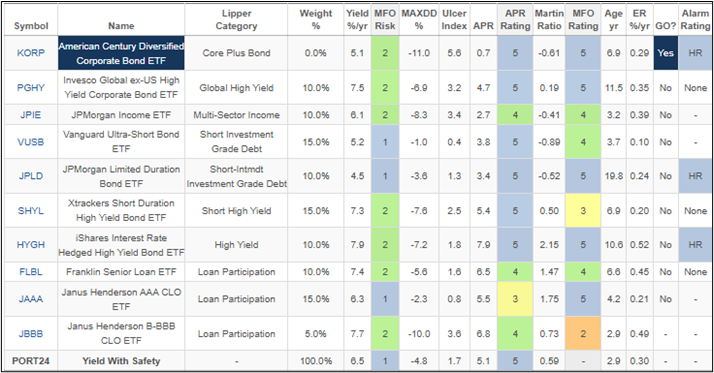
Finally, “Searching for Yield in All The Safe Places” is a comprehensive analysis of eight Lipper bond fund categories, focusing on finding higher yields while managing risk. Lynn develops a ranking system combining multiple factors including risk, yield, return, quality, trend, and tax efficiency. He particularly highlights loan participation funds, discusses various high-yield options, and provides a detailed analysis of specific fund recommendations within each category.
Across them all Lynn builds upon a recognition of the current “higher for longer” interest rate environment and leverages the powerful tools at MFO Premium to generate analyses at both the investment class and fund level. He shares a strong focus on risk management while seeking yield with careful attention to tax efficiency in fixed-income investing.
The Shadow, as always, offers his “Briefly Noted” recap of the industry’s twists including the rising tide of active ETFs and ETF conversions and the magnitude of the retreat from sustainable investing.
Thanks, as ever …
To our faithful “subscribers,” Wilson, S&F Investment Advisors, Greg (I hope I can continue to speak to realities beyond portfolios and the passing storms), William, William, Stephen, Brian, David, and Doug, thanks!
To Andrew from Akron and Krishna from Skokie, thanks! And for more than just financial support. You make a difference.
Giving back, paying forward …
The folks at MFO don’t get regular financial compensation for the work they share with you. Chip and I do look at the books at the end of each year to see what we can, in good conscience share with the folks who make MFO possible. We’re modestly in the red but have built enough of a reserve that we were pleased to offer a small honorarium to our colleagues. And pleased, though not surprised, when they asked that we divert it instead to those whose needs are greater than ours.
Lynn recommended that we make a contribution to Habitat for Humanity in honor of the late President Carter. We have done so.
The Los Angeles fires have slipped from the front pages and lead stories, but three major fires rage on – one uncontained – and hundreds of thousands still face the challenge of reassembling lives. The “Informal Economist,” friend and long-time contributor to the Mutual Fund Observer community shared a fascinating Guardian article, “GoFundMe, Mandy Moore and the unfairness of disaster relief.” The gist: GoFundMe and many self-aid projects are regressive; aid flows primarily to disaster victims who are rich because their social circles are rich folks and their appeals go live immediately and smoothly. Poor folks, known mostly to other poor folks, get ashes. Government aid, tied to property values, has the same unintended effect.
The article links to an intriguing resource, the Black Families (also Latino, Filipino, disabled, and musicians) GoFundMe directory. It allows you to find and help families far outside your circle. Chip and I contributed to several families. At a time when there’s a lot of darkness available to curse, we thought it wise to light a candle.
A more conventional approach: check Charity Navigator’s “LA Fires” page for a dozen highly-rated charities, including a number supporting abandoned pets. Regardless of your choice, you can make a difference.
More broadly, we think it wise to support independent journalism. The phrase “If you give people light, they will find their own way” is attributed to Dante Alighieri. The simplest way to support journalism is to surrender to the core capitalist impulse: pay for what you want! Subscribe. News is not free. You pay for every word of it. If you have a paid subscription, you’re controlling who profits and can understand their biases. The Guardian does good work from a non-US perspective and allows you to pay what you wish. ProPublica does the hard work of investigative journalism that’s picked up by others. The Conversation publishes exclusively the work of subject-area experts, covering everything from hip-hop to homelessness. The National Review, founded by William F Buckley Jr in 1955, has a long and loud tradition of unyielding, principled conservatism. Our own subscriptions – to The Wall Street Journal, The New York Times, Financial Times, Consumer Reports, and others – reflect that imperative.
As ever,