A young lady where I volunteer asked me when I started saving. I started saving as a child, but had no money saved until nearly thirty years later when I started down a “stable” career path after graduating with an engineering degree and an MBA. I described to her that Fidelity’s guideline is to have one year’s income saved by age 30 and 10 times your income by the time you retire. The next question was, “How do you protect your savings from severe corrections in retirement?” I explained that inflation is the silent risk of being too conservative and described target date funds as perhaps being ideal for someone starting out in savings when the daily challenges of home and work life weigh heavy on time requirements.
Overview of Secular Markets
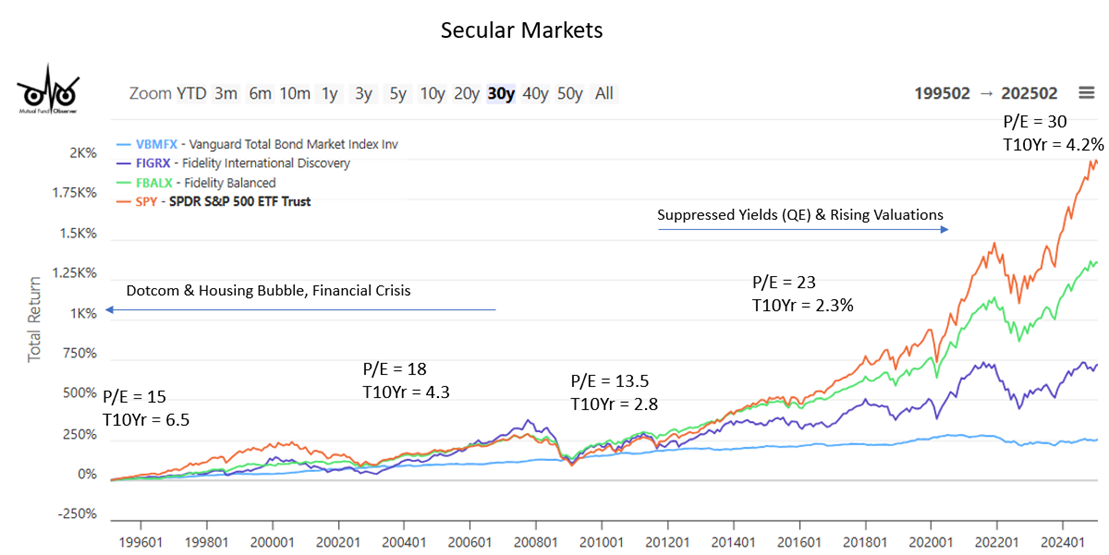
Secular markets can play a major role in your success as an investor over your lifetime. Figure #1 shows the returns for the past thirty years for the S&P 500 (SPY), Vanguard Total Bond Market fund (VBMFX), Fidelity International Discover fund (FIGRX), and Fidelity Balanced fund (FBALX). The obvious conclusion is that the S&P 500 has outperformed the other asset classes by a large margin, but it would be a poor assumption to assume that this holds true for the next ten or twenty years.
Figure #1: Equity and Bond Markets with Valuations and 10-Year Treasury Yields
Three of the most important factors for future returns are starting valuations and yields, along with inflation. Ed Easterling is the founder of Crestmont Research and author of Unexpected Returns: Understanding Secular Stock and Probable Outcomes: Secular Stock Market Insights, which provide incredible insight into the relationship of these factors. For those interested in long-term trends for the stock market, I recommend reading Mr. Easterling’s The P/E Report: Annual Review Of The Price/Earnings Ratio. He concludes that the “stock market’s valuation remains too elevated for an extended period of above-average returns.” He describes that this may occur “either by a significant decline over a shorter period or by a minimal decline over a longer period.”
Secular Markets 1995 – 2012
NOTE: During the 1995 to 2012 period, real GDP averaged 2.6% annually. The population growth rate declined from 1.2% in 1995 to 0.73% in 2012. Population growth is a key driver of economic growth.
Notice in Figure #1 above that the Fidelity Balanced fund (FBALX) performed as well as the S&P 500 for the first twenty years. Why? For the first twenty years, the price-to-earnings ratio (P/E) hovered around the long-term median outside of recessions of about 15 except for the 1997 to 2002 run-up in the Dotcom bubble, which reached 34. Secondly, an investor could make decent returns in bonds. The Vanguard Total Bond Market fund (VBMFX) had an average annualized return of about 6.5% from 1995 through 2022. The Fidelity Balanced fund (FBALX) did as well as the S&P 500 because stocks and bonds are inversely related, and when stocks decline, bonds typically go up. Also, notice that international stocks performed as well as the S&P 500 throughout most of this time period. A diversified portfolio would have performed well.
Secular Markets 2012+
NOTE: From 2013 to 2024, real GDP grew at an annualized rate of 2.5% annually. Population growth fell to 0.59% during this time period.
The Great Financial Crisis of 2008/2009 changed the market environment with Quantitative Easing that the Federal Reserve began in 2008 and the Troubled Asset Relief Program (TARP) that Congress passed in 2009. They served their purpose to avert a major depression by providing stability and stimulus. However, continued easy monetary policy and more stimulus during the COVID recession have suppressed bond yields for most of the past fifteen years. The P/E ratio has risen to close to 30, which is near the expensive levels of the Dotcom years. Quantitative Tightening, a recovering economy, and Inflation have pushed bond yields back up to normal levels.
The Federal deficit has risen from 2.5% of gross domestic product (GDP) in 1995 to over 6% last year. This caused the Federal debt to rise from 65% of GDP to 122% now. This is unsustainable.
Current Investment Environment
The Federal Reserve released its March 19, 2025, FOMC Projections in which the median estimates of real GDP are 1.7% to 1.8% for 2025 through 2027 and 1.8% for the longer run. Inflation for Personal Consumption Expenditures is estimated to fall to 2.2% in 2026 and reach the baseline of 2.0% in 2027. The Federal Funds rate is estimated to fall gradually to 3.1 in 2027 and be 3.0% in the longer term. Of course, tariffs add uncertainty to forecasts.
Davide Barbuscia reports in “Moody’s Says US Fiscal Strength On Course For Continued Decline” at Reuters that “the U.S.’ fiscal strength is on track for a continued multi-year decline as budget deficits widen and debt becomes less affordable.” Moody’s says that debt affordability is weaker than for other highly rated sovereigns. According to Moody’s, persistently high tariffs are likely to hinder growth.
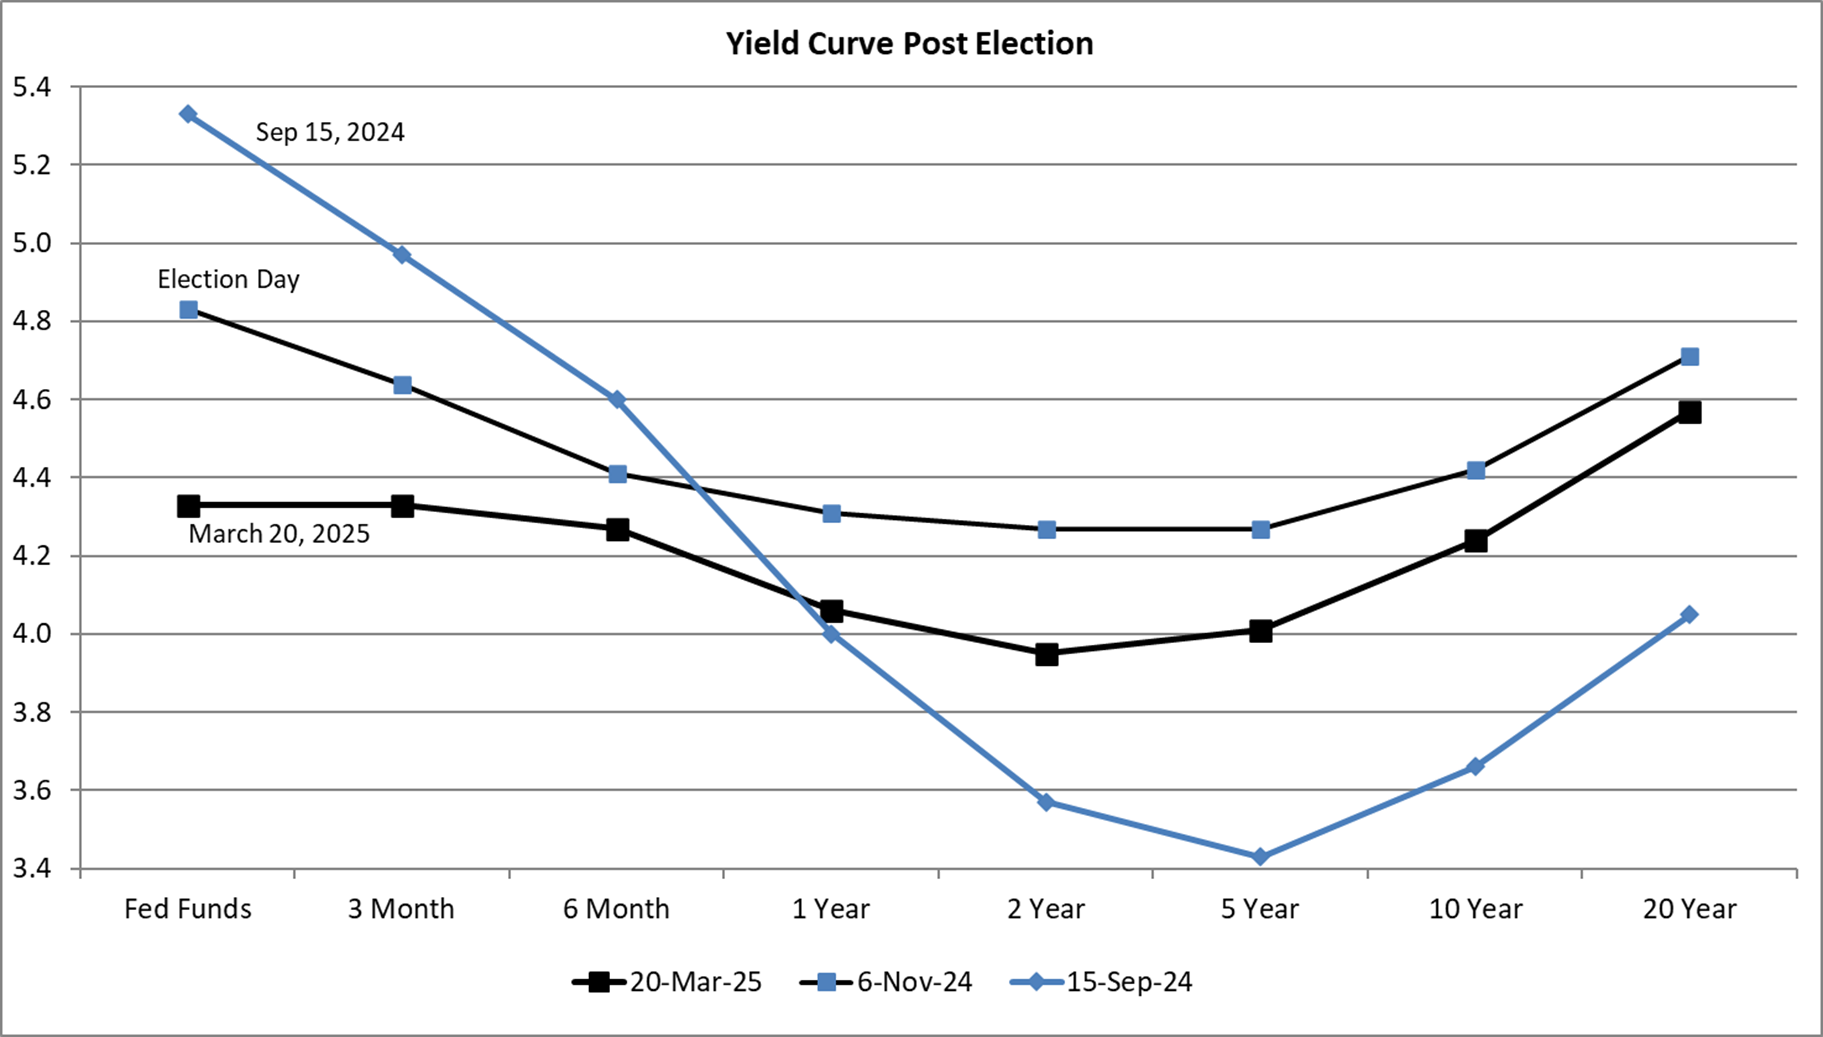
An inverted yield curve is when long-term rates are lower than short-term rates. It makes it harder for banks to lend money, which greases the wheels of industry. An inverted yield curve has been a reliable indicator of recessions. Figure #2 shows the inverted yield curve in September before the Federal Reserve lowered short-term interest rates. The yield curve on Election Day suggested that investors thought the Federal Reserve might achieve a “soft landing” and avoid a recession. Parts of the current yield curve have inverted as investors are now concerned about tariffs increasing inflation and that the economy is slowing.
Figure #2: Treasury Yield Curves – Past Six Months
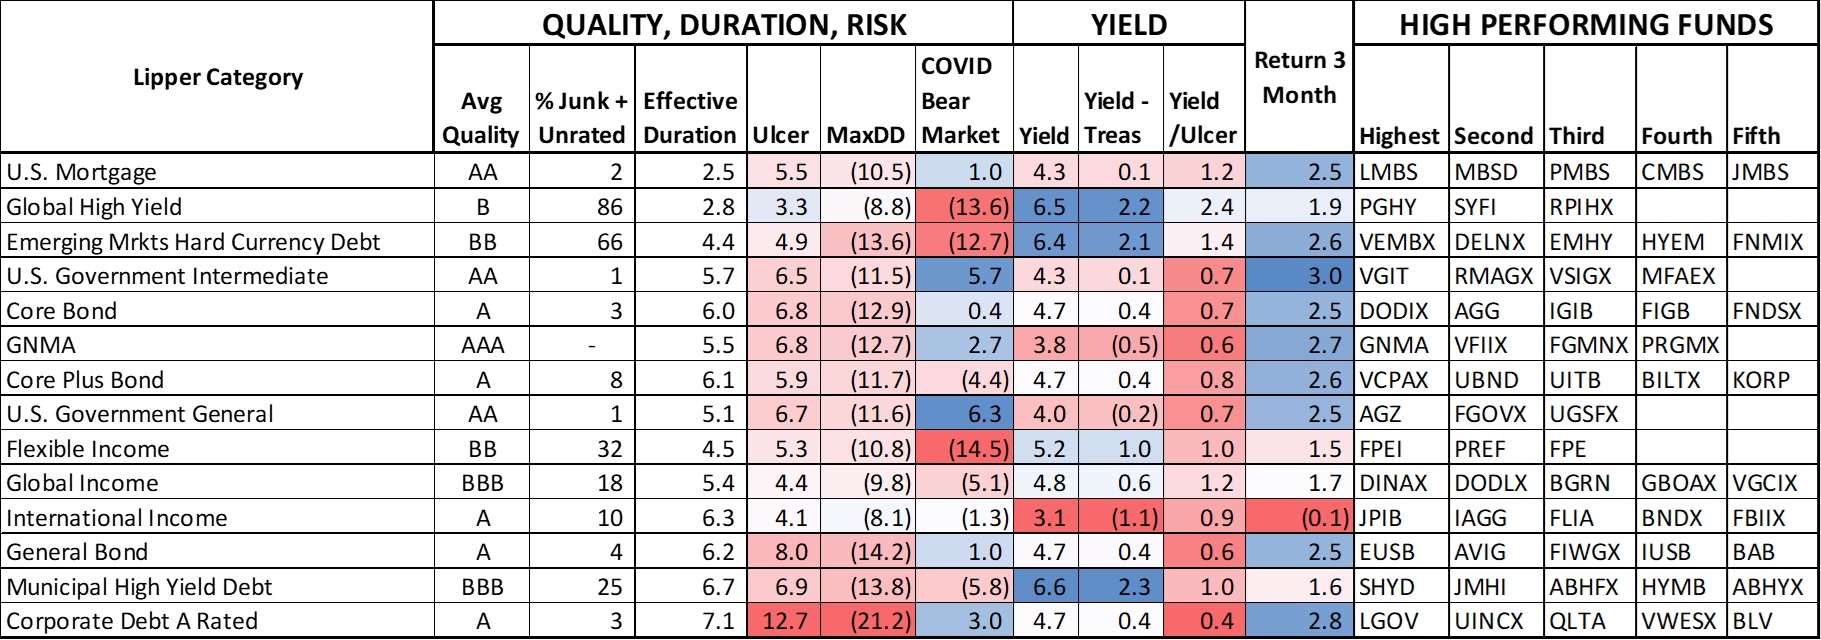
Table #1 contains Lipper Bond Categories that I put in my long-term investment bucket strategy. Intermediate yields have been falling, so bonds with longer durations have returned 2% to 3% over the past three months. Yields are mostly over 4%, providing income for retirees.
Table #1: Investment Bucket #3 – Bonds with Author’s Top-Rated Funds
Source: Author using MFO Premium fund screener and Lipper global dataset; Morningstar for three-month return as of March 21st
Table #2 shows what I call Tier One Lipper equity categories with low Price-to-Book (P/B) valuations, lower risk (Ulcer Index), and higher yields compared to the S&P 500 as of March 21st. The S&P 500 is down 4.2% for the past three months but has corrected about 10% from its February high. International equity funds have returned 8% to 13% over the past three months. The P/B is less than half of the S&P 500, and yields are two to three times that of the S&P 500. Buybacks for US companies have contributed to lower yields in the US because capital gains are generally taxed at lower rates than ordinary dividends. Rising international equity funds have reduced the impact of the S&P 500 falling in diversified portfolios.
Table #2: Lipper Equity Categories with Low Valuations, Lower Risk, and High Yields

Source: Author using MFO Premium fund screener and Lipper global dataset; Morningstar for three-month return as of March 21st
The Coming Decade(s)
The Congressional Budget Office published Projections of Deficits and Debt Under Alternative Scenarios for the Budget and Interest Rates last month which analyzed the case where provisions of the 2017 tax act that changed the individual income tax are extended indefinitely, including lower statutory tax rates, the changes to allowable deductions, the larger child tax credit, the 20 percent deduction for certain business income, and the income levels at which the alternative minimum tax takes effect. They conclude that if the 2017 Tax Act is extended, “Primary deficits over the first decade of the projection period (fiscal years 2025 to 2034) are about $4 trillion larger. By 2054, the primary deficit equals 3.7 percent of GDP, 1.5 percentage points higher than in CBO’s extended baseline.”
Inflation is a rise in prices for goods and services. Tariffs are a tax on importers, which undoubtedly will be passed on to consumers. Tariffs are a one-time increase in prices to a higher level. The impact is higher long-term prices until supply chains have time to at least partially adjust. Economists attribute the trade deficit to a high rate of domestic consumption and a low savings rate. High labor rates in the US compared to developing countries and mobility of technology have also contributed to the deficit. Increasing tariffs doesn’t address these factors.
Mixed Asset Funds
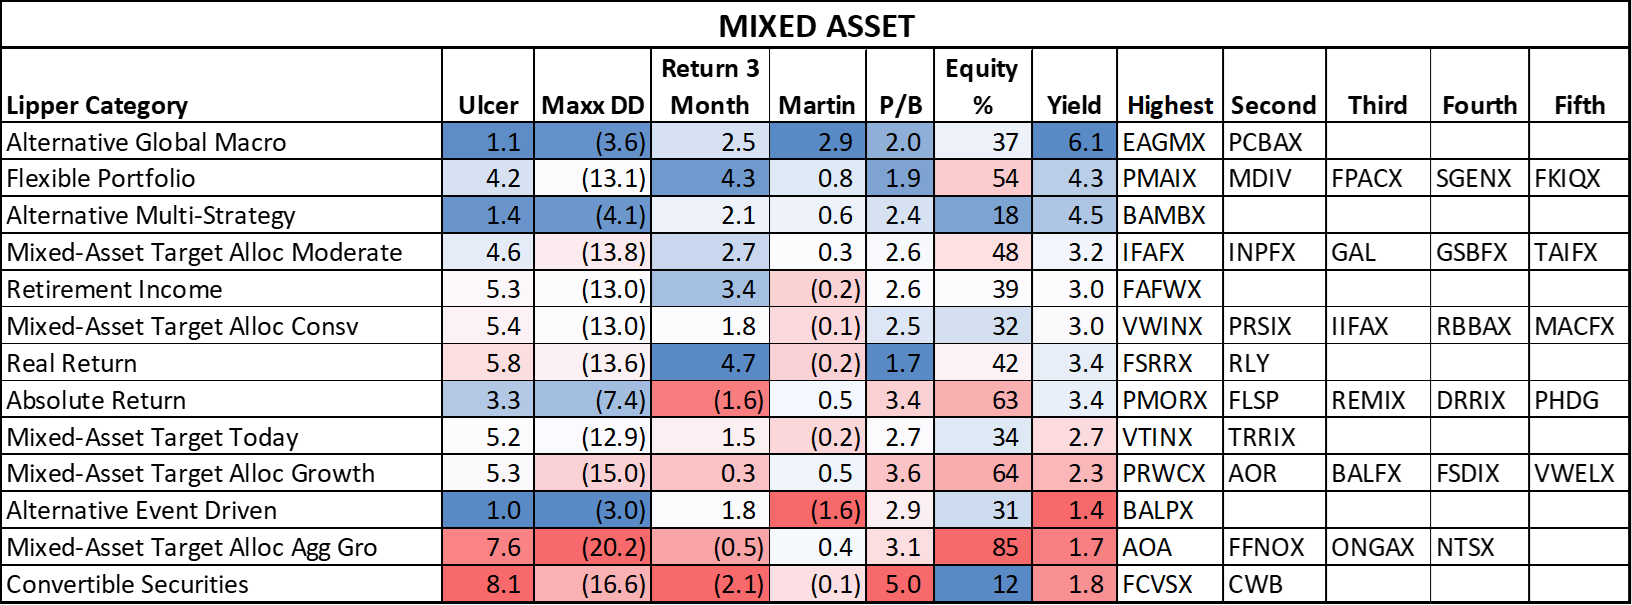
Mixed-Asset (MA) funds invest in multiple asset classes, including stocks and bonds, and may include international equities. I like them for younger investors who want a professional manager to select investments and rebalance. In retirement, I like having more control over withdrawal strategies and only having a small amount invested in MA funds.
Table #3 contains a subset of the mixed-asset funds that I track. The return over the past three months shows how they are performing now, but I suspect it also provides a glimpse into the future. I expect funds with lower valuations, international exposure, higher allocations to bonds, and higher yields to outperform on a risk-adjusted basis.
Table #3: Mixed Asset Funds with Author’s Top-Rated Funds
Source: Author using MFO Premium fund screener and Lipper global dataset; Morningstar for three-month return as of March 21st
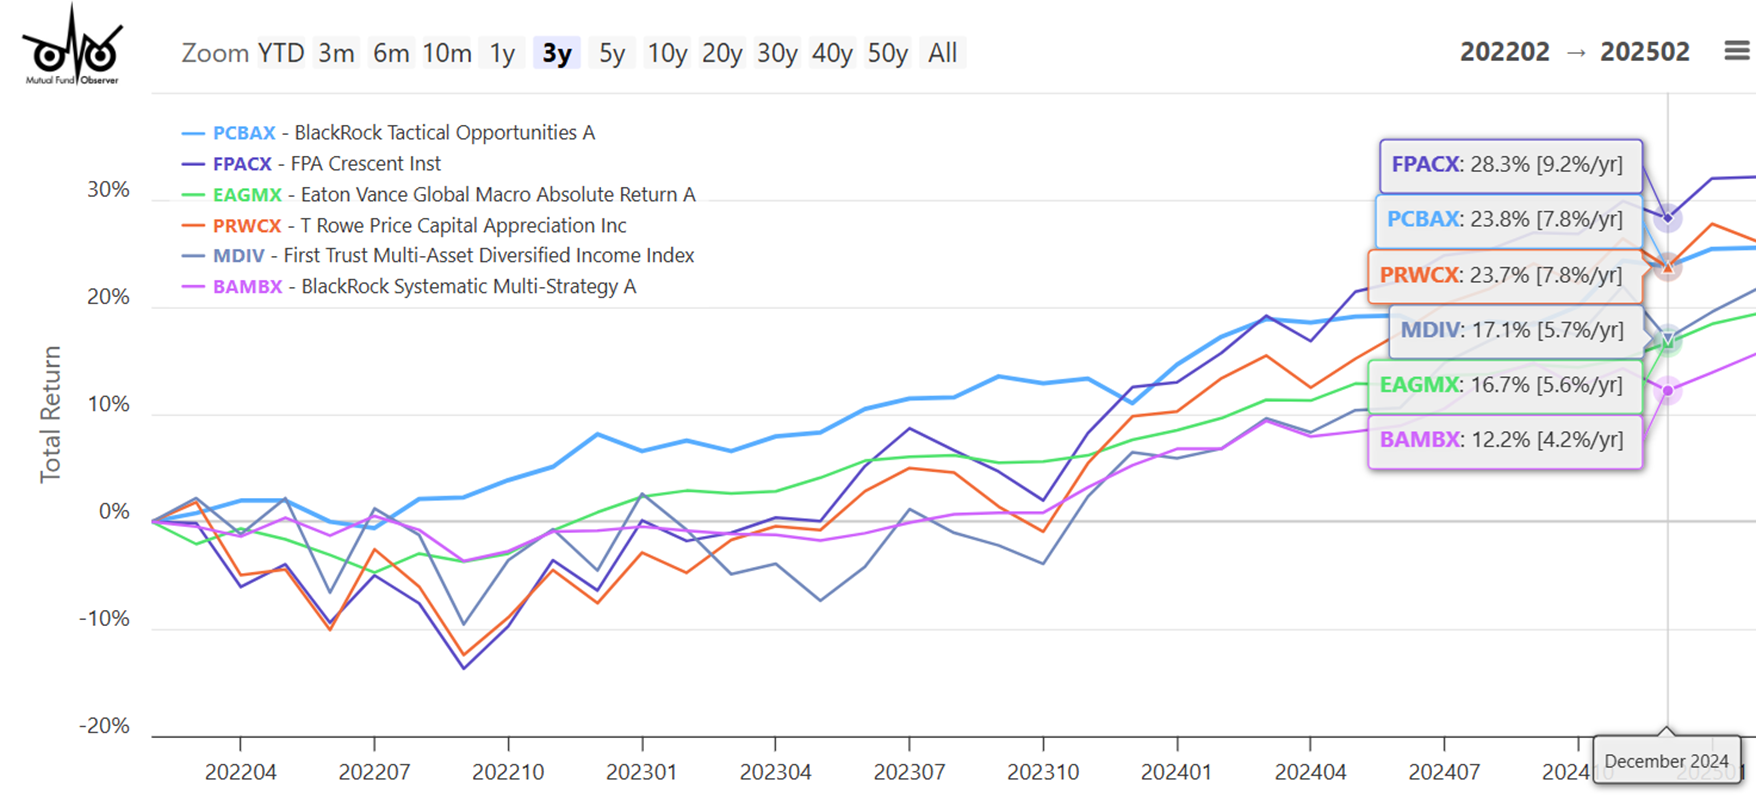
Figure #3 shows the three-year performance of selected funds. Below are shown some interesting possibilities. I will watch the markets for the next few months before making any decisions. At first glance, BlackRock Tactical Opportunities (PCBAX) and Eaton Vance Global Macro Absolute Return (EAGMX) appeal to me. Both are available at Fidelity without transaction fees and with the load waived.
Figure #3: Selected Mixed-Asset Funds
Closing
What has propelled the US stock markets higher over the past several years is easy monetary policy, Federal stimulus, and rising valuations. I believe that uncertainty is taking its toll on investors and consumers. A diversified portfolio with bonds and international equities should perform well in the coming decade because of favorable valuations internationally and normalized bond yields.


