Monthly Archives: September 2024

September 1, 2024

By David Snowball

Dear friends,

Welcome to the September (aka “back to school”) issue of the Mutual Fund Observer. The joyful tumult of which has slightly delayed our launch.

Despair is easy. If you ever want an antidote, drop by Augie at the beginning of September. As many of you know, in my day job, I am a professor of communication studies and director of the Austin E Knowlton Honors Program at Augustana College. I am also an advisor to first-year students. I’ve spent much of the last week meeting with and learning about my new charges. I am amazed by them, defying as they do all of the hysterical media headlines about entitled brats using college to polish their social media profile.

Pfeh.

We’re welcoming 766 new Vikings, including 171 international students (we now have representatives from more countries than US states which is incredibly cool because when I first taught at Augie our international student population were three Swansons and a Johnson, all from Sweden), 162 US students of color and 80 transfers. 42% of our kids are eligible for Federal Pell grants, which are available only to low-income families. (Chip, whose community college students have even more modest backgrounds than ours, fumed briefly at a recent New York Times article about the rise of interior decorators who specialize in dorm room décor at about $10,000 a pop. Dear Lord. Not here. Think: Target.)  As we talked I learned that Alonso, from Arequipa, Peru, has been reading the works of Nazi propaganda minister Joseph Goebbels in German for a year-long high school project. Aji, from Nairobi, Kenya, chatted happily about studying in Seoul, South Korea. Collectively their aspirations range from becoming pediatric surgeons to speech pathologists. They are funny, brave and scared.

What more about any of us hope for?

In this month’s issue of MFO …

In penance for an article about my portfolio in BottomLine: Personal (“The Lazy Man’s Mutual Fund Portfolio: For Both Good Times and Bad,” 9/1/2024), I propose two two-fund portfolios appropriate for small investors looking to get started without looking to babysit. My own portfolio as outlined in the BottomLine article, is designed, in part, as a tool to help me track a range of interesting possibilities but, at 10 funds, it’s far more sprawling than necessary. I try to correct that by creating two low-risk, flexible portfolios to meet the needs of sensible younger investors through FPA, Intrepid, Leuthold, and RiverPark funds.

In celebration of Warren Buffett’s 94th birthday, our colleague Devesh Shah surveys the maelstrom and guides you through it to a Buffett-like conclusion: “meh, maybe a tweak or two, then off to McDonald’s for dinner!”

Charles will walk through a useful new feature at MFO Premium: ETF Benchmarks. We now offer the data to guide all those people who ask, “Wouldn’t I be better off just buying an ETF or ten?”

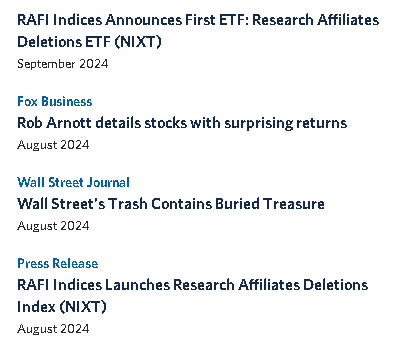
We also present our first near-Launch Alert, for Research Affiliates Deletions ETF. It is RAFI’s first fund marketed under their own brand and it targets an interesting and persistent market anomaly: companies booted out of cap-weighted indexes tend to enjoy a five-year run of success following their deletion. There’s a bunch of research and a bunch of possible reasons, including the fact that such firms tend to be small-cap value, they benefit from regression to the mean, and they were booted after the worst of their troubles were behind them. RAFI is talking about the fund today and you’ll be able to buy it in a week.

The Shadow, as ever, documents the industry’s developments, both its brilliance and its occasional cowardice, in Briefly Noted.

Ben Carlson: assuming the world goes to hell, your portfolio …

…will probably make about 10%.

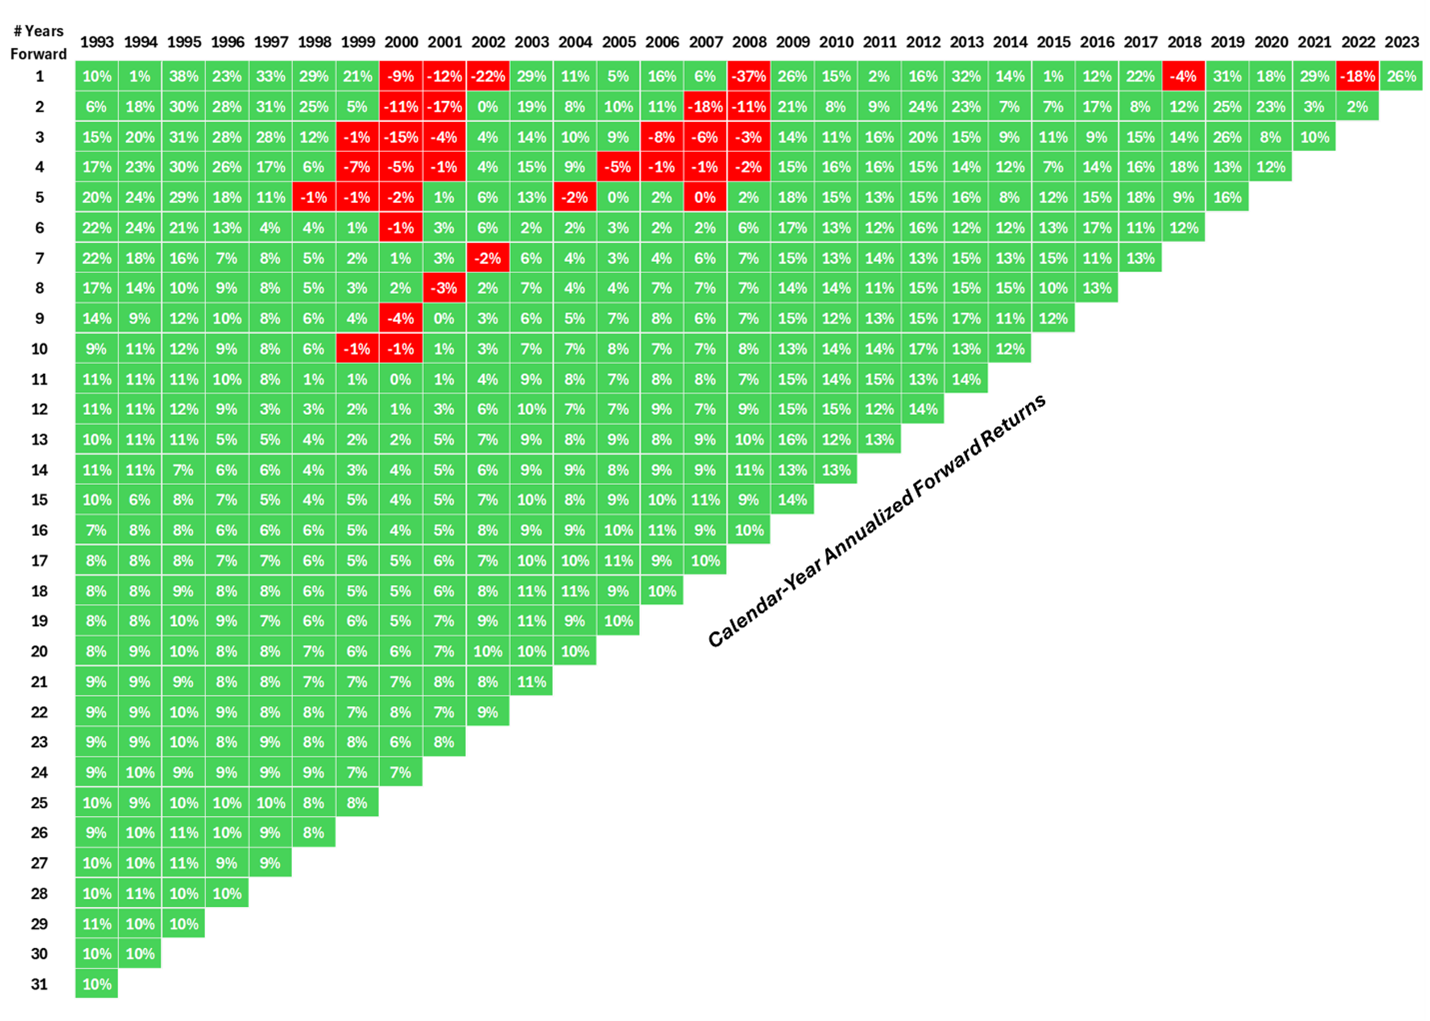
Mr. Carlson, who manages portfolios for institutions and individuals at Ritholtz Wealth Management LLC, writes the exceptional Wealth of Common Sense blog. In this month’s entry, he addresses our universal jitters about the stock market by looking at … the stock market. In particular, he calculated the average annual returns for investments made in each of the past 30 years.

So, for example, if you look at the column labeled 2000 – a largely sucky year in the market – then the row labeled 15, you’d see that a particularly poorly timed investment made in 2000 would have returned about 4% annually over the following 15 years. Sad, but not an apocalypse.

His greatest optimism comes from reading along the jagged edge: the long-term returns for every investment period. “The 31-year annual return from 1993 through 2023 was around 10% per year, right at the long-term averages.” That despite:

An emerging markets currency crisis in 1998, the Long-Term Capital Management blow-up, the dot-com bubble, 9/11, the housing bubble, the Great Financial Crisis, the European Debt Crisis, the pandemic, and the highest inflationary spike in four decades.

We also sprinkled in a few recessions, two massive market crashes, two bear markets, and ten double-digit corrections.

His recommendation, which tracks ours: “Regardless of what returns the stock market produces in the future, thinking and acting for the long-term remains the most sane strategy for investors.”

Buy quality. Hold quality. Get on with life!

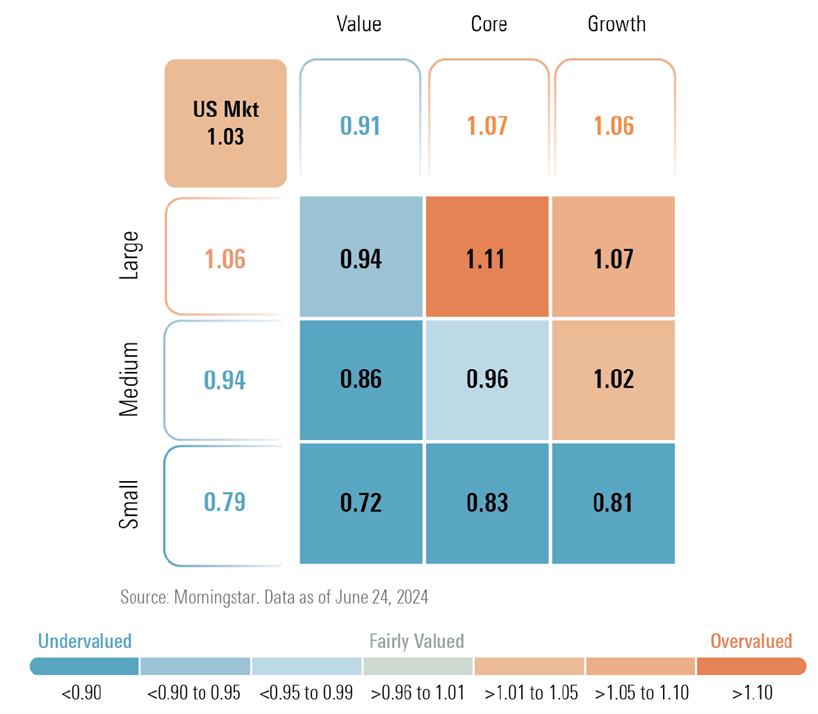
Morningstar: It’s time to consider US large cap value, US small caps and emerging markets

Bryan Armour, director of passive strategies research for North America and editor of Morningstar ETFInvestor newsletter, is pushing for folks to look in the unloved, left-behind corners of the market. He’s declared, “alarm bells are ringing for me (8/27/2024).” Among the triggers:

Collectively, Microsoft, Apple, and Nvidia represent 12% of the entire global equity market.

Apple and Nvidia are both almost entirely reliant on a single product line (iPhones and data center products, respectively)

By market cap, Nvidia is valued at more than all of the stocks in the Russell 2000 index (which have 30 times Nvidia’s revenue) combined, or all of the stocks in the UK, Germany, and Canada combined.

So the people who are out of favor are way out of favor.

Where to look? We screened for funds that have earned both a FundAlarm Honor Roll designation (for outperformance over the past 3- and 5-year) periods and MFO Great Owls (for exceptional risk-adjusted performance) then sorted by Sharpe ratio (an alternate risk-adjustment tool), diversification (we won’t recommend a fund that concentrates on a single emerging market, such as Taiwan, regardless of its recent record) and accessibility.

In small value, the two top funds are Brandes Small Cap Value (BSCAX) and PIMCO RAE US Small Fund (PMJAX). Brandes is a bottom-up, contrarian value sort of operation with a small, compact portfolio and a 98.5% active share. RAE signals Research Affiliates Equity. PMJAX is a quant fund whose model overlays traditional value metrics alongside quality indicators, momentum signals, and other relevant data points and then “dynamically rebalances” as conditions evolve. Pretty consistently five-star as well as an MFO Great Owl.

  Five-year APR APR versus peers Risk versus peers Ratings
Brandes SCV 17.6 5.0 Low Five star, Great Owl
PIMCO RAE US Small 17.3 4.7 Above average Five star, Great Owl

In large cap value, check any of the flavors of Fidelity Large Cap Stock (FLCSX). It’s the only large value fund to pass our screen, though it does so in several different flavors including Fidelity Series, K6, Advisor, and Regular. Mr. Fruhan has been running the strategy for 19 years. He looks for firms that exhibit strong potential for earnings and dividend growth over a two to three-year horizon. The fund aims to capitalize on perceived mispricing in the market by conducting a thorough bottom-up fundamental analysis. Our other pick, excellent in its own right, is FPA Queens Road Value (QRVLX).  Mr. Scruggs pursues a sort of “quality value” strategy: he seeks high-quality firms (strong balance sheets and strong management teams) whose stocks are undervalued (based, initially, on price/earnings and price-to-cash flow metrics). They sell very rarely which is reflected in a single-digit turnover ratio.

  Five-year APR APR versus peers Risk versus peers Ratings
Fidelity Large Cap Stock 16.7 4.7 Average Four star, Great Owl
FPA Queens Road Value 13.7 1.7 Average Five star

In emerging, PIMCO RAE Emerging Markets Fund (PEIFX) has the same heritage and charms as the Small Fund we discussed above. Oceans of data + a multi-layer selection screen = win. Roughly.  Pretty deep-value, a pretty large cap. GQG Partners Emerging Markets Equity (GQGIX) is the flagship fund of one of the world’s most successful EM investors. Rajiv Jain has an obsessive focus on quality and a record of spectacularly successful funds. They target high-quality companies characterized by financial strength, sustainability of earnings growth, and quality of management. The goal is to manage downside risk while providing strong long-term returns.

  Five-year APR APR versus peers Risk versus peers Ratings
PIMCO RAE Emerging Markets Fund   10.9 6.1 Average Five star, Great Owl
GQG Partners EM Equity 9.9 5.1 Low Five star, Great Owl

Our own preferences tend toward “high quality” and “low risk” portfolios. The screener at MFO Premium, though, would allow you to test a huge variety of investments against a huge variety of metrics across a huge variety of time frames.

Thanks, as ever …

In response to our (slightly sad) note that we’d ended our fiscal year in the red, several folks stepped up with contributions for which we’re deeply grateful. Thanks to Craig from Delaware, Lee of San Antonio, OJ, Paul from Florida, Jeroen of Anchorage (We do our best!), Michael from DMS, and of course, our regular crew, Wilson, S&F Investment Advisors, Gregory, William, William, Stephen, Brian, David, and Doug.

Thanks to George C from San Pablo for his thoughtful feedback on the “Indolent Portfolio” article in BottomLine and on some issues with how the site works for him.

And, most especially, to our colleague Lynn Bolin. Lynn, recently retired, spends time traveling, with family and in helping the Loveland, Colorado, Habitat for Humanity. Habitat recently celebrated Lynn, and we wanted to share their brief story with you:

We made a (matched) contribution to Habitat in Lynn’s honor this month. We urge you to do likewise, either directly to Lynn’s Loveland, Colorado chapter of Habitat or to your local Habitat chapter. Better yet, follow the example set by Lynn, Jimmy Carter, Jon Bon Jovi, Garth Brooks, Trisha Yearwood, and others, pick up a hammer and make the world just a bit better.

We face exciting times. If you get a chance, smile at the next person you meet and tell them they look good. Through such small gestures, communities are built.

Take care,

david's signature

The Young Investor’s Indolent Portfolio

By David Snowball

An indolent portfolio is an investor’s best friend. It is a portfolio designed to be ignored for a year at a time. Why is that a good idea? Two reasons, really. First, almost everything you do with your portfolio will be a mistake. Morningstar’s long-running series of “Mind the Gap” studies looks at the difference between investor’s actual returns and the returns of the funds in which they are invested.

Those annuals routinely show that investors’ returns are lower than the returns of the funds themselves, because of poorly timed purchases and sales of fund shares. The most recent version shows that investors missed out on almost a quarter of the money they would have made if they had simply bought and held over the 10 years. Two other findings are important as you think about creating your portfolio: (1) the gap was lowest for investors in funds that invested in several different assets, such as both stocks and bonds, and (2) investors in actively managed funds had a smaller gap than investors in passive funds and ETFs.

Second, indolent portfolios are good because you’ve got a life to live! Why on earth would you want to spend time babysitting a bunch of investments when you could be rafting or dating or having really good dinners with friends?

In this essay, we’ll do two things. First, we’ll talk about why you want to act now and not wait until you’re “ready.” Second, we’ll walk step-by-step through the process of creating an indolent, two-fund portfolio for cheap.

Why now?

The one great advantage that investors in their 20s and 30s have is time. If you start with a pittance (say $100) and add a pittance ($50) monthly in a perfectly ordinary US stock fund, at the end of a year you have … a pittance, probably! (Stock markets are unpredictable and volatile in the short term so we can’t guess your 12-month return on your hard-earned $650 investment.)

Pittance after 12 months: who knows?

Pittance after 20 years: $31,000

Pittance after 30 years: $83,000

Pittance after 40 years: $206,000 (source: Investor.gov compound interest calculator, assuming $100 initial, $50/month, 9% nominal rate of return and 9% standard deviation)

Here’s the other way of putting it: if you bite the bullet and start today, you end up with $206,000. If you wait 10 years “until your student loans are paid and you can afford to invest,” you end up with $83,000. In this projection, you lose 60% of your portfolio to delay.

Don’t delay.

What to do?

The one great disadvantage that investors in their 20s and 30s have is uncertainty. Not sure how to get started. Not sure what’s a scam. Anxious about making a big mistake. 

It’s not that hard. We can help you construct an Indolent Portfolio, that is, one that you don’t have to babysit so that you can get on with life and still have the prospect of some financial security now and in the future.

Three easy steps:

  1. Step up an account at an online brokerage. It takes under 10 minutes. Chip and I use Schwab, other MFO members have other preferences. You’ll need your banking information so you can move money easily between your savings account and your investment account.
  2. Set up a two-fund portfolio. One fund should be designed to act like a savings account on steroids; that is, it earns enough interest to overcome the effects of inflation without the prospect of serious loss. The other fund should be designed to generate substantial long-term growth while still being very risk-conscious so that you can still sleep at night.
  3. Invest equal amounts automatically in each fund monthly. The first fund will serve as your emergency fund, it acts as a financial safety net for unexpected events like job loss, medical emergencies, or major repairs. Planners recommend having enough money set aside to pay your bills for three months if you’re sick or out of work. In reality, if you create a $1,000 safety fund and don’t dip into it for routine stuff, you would be in the top half of all Americans for financial security.

We screened over 8,000 funds and ETFs to identify income funds that consistently produced returns of 3% or more and almost never had negative returns and growth funds that consistently produced returns of 8% or more with exceptional risk protection.

  Ticker Role Returns Why this fund? Minimum investment at Schwab
RiverPark Short-Term High Yield RPHYX Income 3% – 10-year avg. David Sherman’s fund has the best risk-adjusted returns of any fund in existence. Period. It generates 3-4% most years and has never gone negative. $100
Leuthold Core LCORX Growth 7%  – 20-year avg. Leuthold Core pursues capital appreciation and income through the use of tactical asset allocation. The objective is to avoid significant loss of capital and deliver positive absolute returns while assuming lower risk exposure and lower relative volatility than the S&P 500. (There’s also an ETF version of the fund, LCR.) $100
Intrepid Income ICMUX Income 4.2% – 10-year avg. The managers invest mostly in shorter duration corporate bonds, both investment grade, and high yield, to get a higher yield than ultra-safe US Treasury securities without taking significant default or interest rate risk. $2500
FPA Crescent FPACX Growth 8.4% – 20-year avg. Crescent started life long ago as a hedge fund seeking, then and now, to produce positive absolute returns by investing across capital structures, geographies, sectors, and market caps. $2500

Nota bene: Snowball owns substantial personal positions in FPA, Leuthold, and RiverPark but we have no financial stake in these or any of the firms we write about.

We had Perplexity.ai create two portfolios for you: LCORX + RPHIX and FPACX + ICMUX. Both started at 50/50 and were annually rebalanced back to 50/50.

Leuthold Core + RiverPark Short-Term High Yield generated average returns of 5.1% annually over the past decade. You would have had two losing years over the volatile past decade, but in each case, your portfolio would have declined by just 1.9%. RiverPark, your income fund, would never have lost money so your emergency fund would have kept growing. Your portfolio would generate 70% of the long-term returns of a typical 60/40 balanced fund, represented by the passive Vanguard Balanced Index Fund (VBINX) or the active Vanguard STAR Fund (VGSTX) but would subject you to just 45% of the risk. The price for creating this portfolio starts at $200.

FPA Crescent + Intrepid Income generated average returns of 7.7% annually over the past decade. In exchange for those higher returns, you would have had three losing years with an average loss of 3.8% in your down years. Intrepid, your income fund, would have lost money in three years with an average loss of 1.7%. Your portfolio would match the 10-year returns of the Balanced Index or STAR with only 75% of their volatility. Another win! The starting price here is between $2500 (start with one fund then add the other once you hit $5000 total) and $5000.

Bottom Line

Your best hope for financial security starts here. Invest slowly and steadily, not in flashy possibilities, but in funds that have performed well across the years and have prevailed against many challenges.

Happy 94th, Warren! In celebration, I did not nothing

By Devesh Shah

The bouncing baby Warren Edward Buffett entered the world on 30 August 1930, the only son of Laila and Howard Buffett. In celebration of this 94th birthday, I looked seriously at my portfolio … and did absolutely nothing.

That was hard, but baby Warren would have wanted it that way.

Introduction

In this article, I look back at the market lows in October 2022. I recollect how I felt, how the portfolio was doing, and the tools I used to look forward to a possibly rosy future. Then, I contemplate the current state of US bonds and stock markets. I wonder if markets are now fully valued, which might explain the higher levels of daily volatility, and occasional craziness we observed recently.

The world’s always uncertain. The world was uncertain on December 6th, 1941, we just didn’t know it. The world was uncertain on October 18th, 1987, you know, we just didn’t know it. The world was uncertain on September 10th, 2001, we just didn’t know it. The world—there’s always uncertainty. Now the question is, what do you do with your money? And if you—the one thing is if you leave it in your pocket, it’ll become worth less… (CNBC interview, 2011)

“What could I have done differently?”

I remember the day well at the beginning of October 2022. I was staring at my portfolio and other broadly diversified allocation portfolios (and funds) around mid-afternoon. Value stocks were holding up better than growth portfolios. Despite my strong concentration in large-cap value, I was still down 15% on the year. However, I distinctly remember, that some balanced portfolios were down as much as 25% on the year. The equity allocation in my portfolio had gone down from 58% to 40% on the back of some trimmings, but also a decline in nominal values.

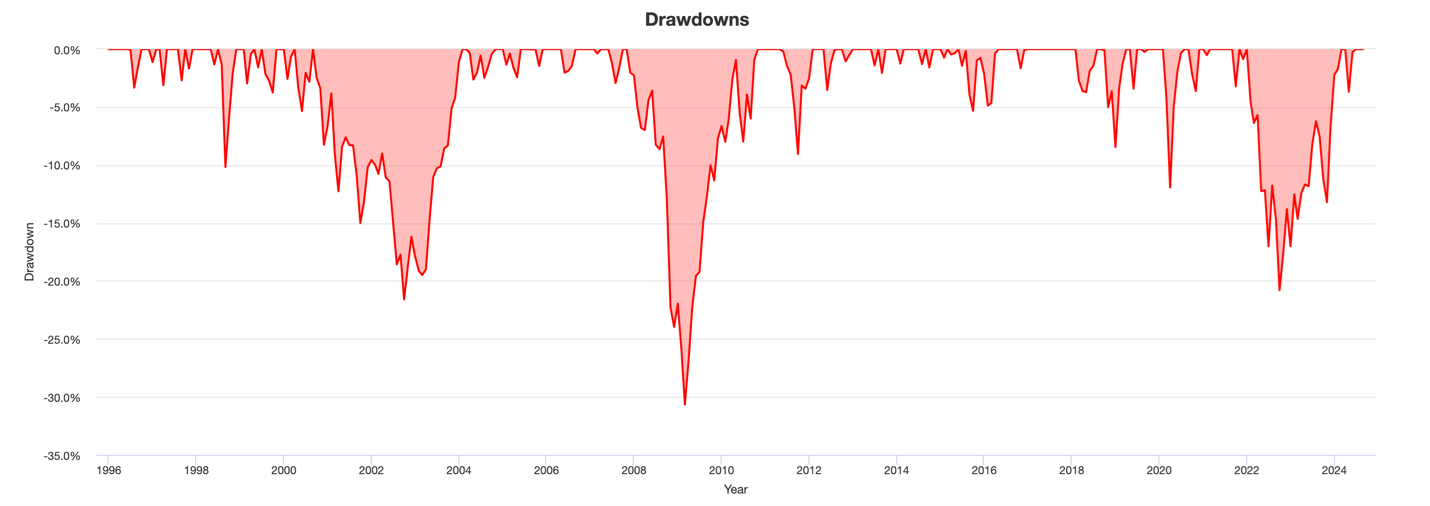
Here is a chart of Portfolio Drawdowns of a simple 60/40 US Stock-Bond Portfolio going back almost thirty years. I used Vanguard Total Stock Market (VTSMX) for US Stocks and  Vanguard Total Bond Market (VBTIX) for US Bonds.

Here are the same numbers in tabular format:

  Peak Date Trough Date Drawdown
LTCM 1998-07 1998-08 -10.17%
Dot com bust 2000-08 2002-09 -21.59%
GFC 2007-10 2009-02 -30.66%
USA Credit Downgrade 2011-04 2011-09 -9.05%
Covid 2020-01 2020-03 -11.93%
Inflation 2021-12 2022-09 -20.80%

(I used Anthropic’s AI engine, Claude, to come up with this table. It was a rather frustrating experience. AI keeps getting simple drawdown numbers wrong for the same reason it cannot count the number of f’s in fluffy. The way to get AI to get the number of f’s correct is to get AI to write programming code to calculate the number of f’s. In a few years, hopefully, we won’t have to teach AI how to write code to solve simple math problems.)

No one likes their portfolio down double digits. Even though I was outperforming other balanced portfolios, I was perturbed, and kept asking myself this one question, “What could I have done differently coming into the year?”

After a lot of analysis, I concluded what many long-term investors would have always known and internalized: “There was nothing to do. Every once in a while, even a well-managed balanced portfolio is going to be down double digits.”

Accepting this outcome helped me move on. Very important to maintain investor sanity.

The next question in my mind was, “How have these portfolios performed AFTER crashing?”

What came after the crash?

When I ran the portfolio performance six, twelve, twenty-four, and thirty-six months AFTER the crash, the returns were positive and significantly so.  

(It’s possible Claude AI got some of these numbers wrong, but I tried to spot-check most of them).

During the GFC, balanced portfolios were down more than 30%. Was it possible the inflation-led 2022 selloff could get much worse? It could. And I wish I had good data from the 1970s and early 1980s when both stocks and bonds were down heavily, but Portfolio Visualizer does not have data for bonds going back then.

I convinced myself that inflation, at the end of the day, is good for nominal earnings, as long as the Federal Reserve is bent on beating inflation. The Fed was late, but not absent, in its fight.

Equipped with data from the table above, I decided it was time to go long the market. I took up my Equity allocation from the low 40s to 75%. I also bought long-dated 30-year TIPS to buy bond duration. I was right on Stocks and wrong on Bonds. The latter looked good for a few months, but inflation was still raging, and it rocked bonds badly in 2023. I learnt my lesson to invest henceforth in bonds with a duration of no more than 5 years. 30-year TIPS were too long for me.

The good news is the positive returns came. Here is the table updated to include the 2022 selloff:

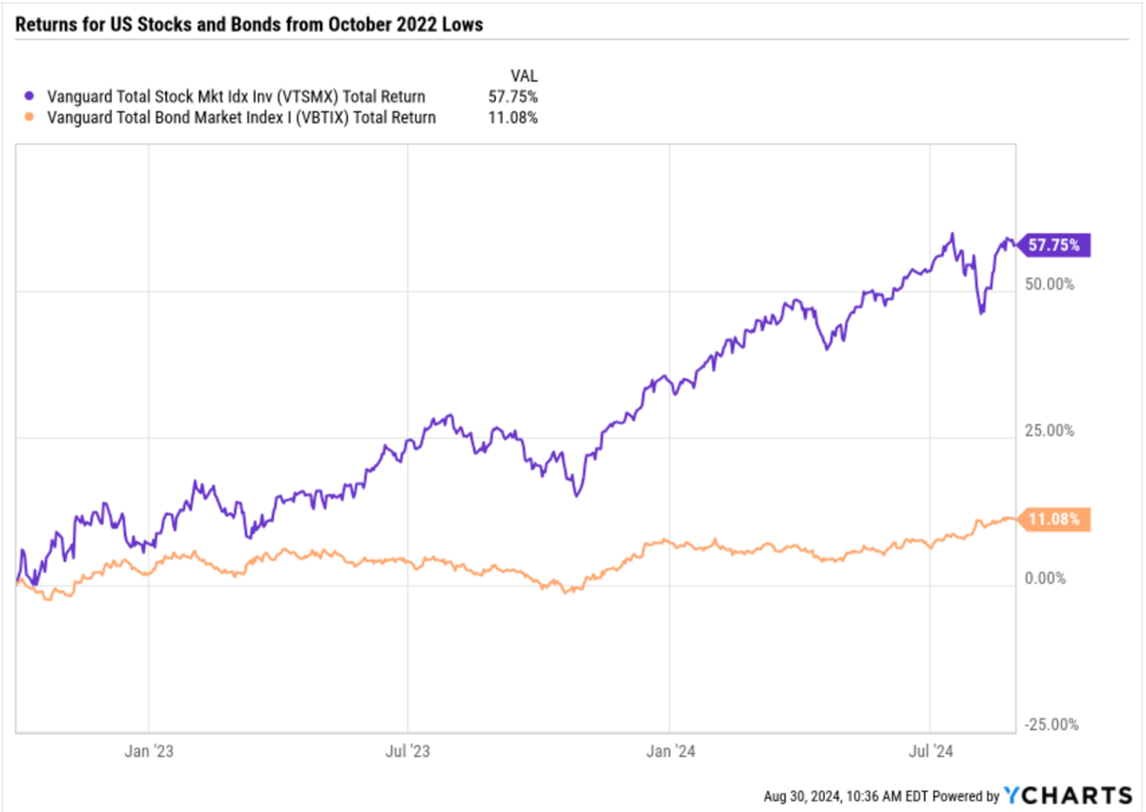
The 60-40 portfolio is up 37.5% from October 2022 to August 2024 (which I used to populate the 24-month Return in yellow above).

“Time is the friend of the wonderful company, the enemy of the mediocre” (widely attributed without a demonstrable first source, certainly consistent with WB’s investing)

Where did the returns come from?

Almost exclusively from the stock market, with a small assist from bonds.

What does this mean for us today?

It’s all well and good to talk about what worked in the past but what investors care about is what now?

“Beware the investment activity that produces applause; the great moves are usually greeted by yawns” (Shareholder letter, 2008)

Bonds

I’ll admit I don’t like to own US Government longer duration bonds. It’s possible I was burnt by 30-year TIPS duration and now am trying to avoid getting tattooed again. After all, annualized inflation is now closer to 2% and the Federal Reserve is about to embark on an interest rate-reduction cycle.

But I take my cues from two people in the market: David Sherman, who runs the Crossing Bridge family of Bond funds, and Warren Buffett.

In his quarterly commentary, Mr. Sherman, who generally eschews making interest rate prognostication or bets, still believes that the yield curve will normalize at some point with short-dated yields being lower than longer-dated yields.

Mr. Buffett continues to hold almost $276 Billion in Treasury Bills, putting his money to work in a part of the bond curve with no duration.

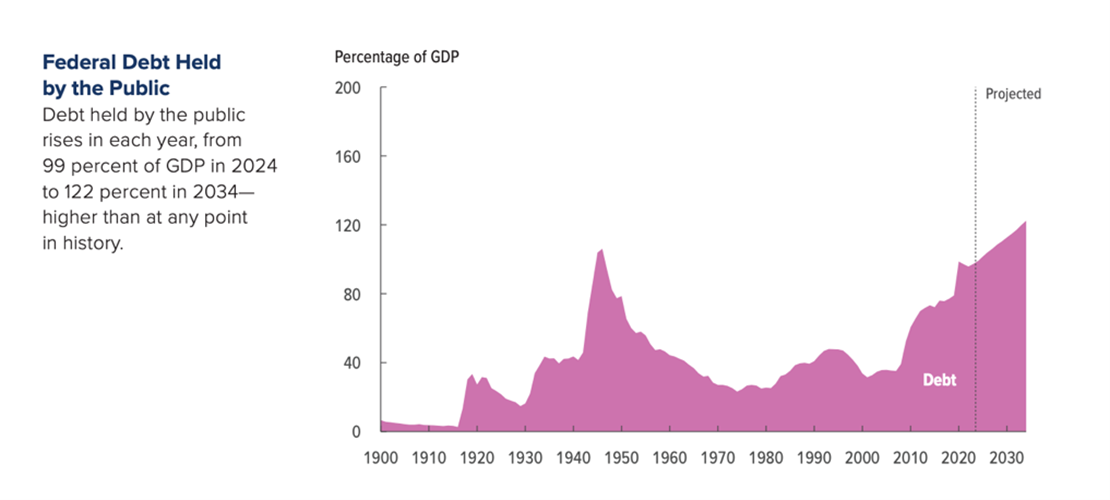
It’s clear that neither of the two political parties in the US are committed to bringing the deficit down. I don’t want to finance long-dated debt for the US government or US municipalities.

Here’s a chart I revisit to not buy long-term bonds:

Source: US Congressional Budget Office Update to the Budget and Economic Outlook (06/2024)

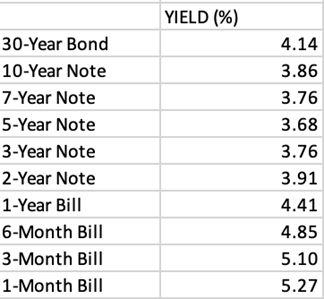
For the record, these are the US Government Bond yields as of August 30th, 2024.

Practically, disliking long-term bonds means three things to me:

One, I own T-Bills, and don’t bother with trying to “lock in” higher yields before the Federal Reserve cuts interest rates.

Two, I own some low duration, high coupon, AAA credit NY Municipal bonds for tax purposes.

Three, I like the higher yield from the short-duration high-yield bond funds. I made a list of some of the funds earlier in the year.

When someone smart pointed out that Holbrook’s Yield was 14.5%, I called Scott Carmack who co-manages the five-star Holbrook Income Fund (HOBIX). He was incredibly nice and both he and his co-manager, Ethan Lai, who manages Holbrook Structured Income fund (HOSIX), spent a few hours taking me through their portfolios.

HOBIX owned some B. Riley Financial Inc. paper, the company was in distress, and the bond yields had shot up 50%. Those bonds were skewing the yield for the total HOBIX portfolio.

I started investing in short-duration high-yield through David Sherman’s Crossing Bridge funds. But I wanted to diversify the holdings. So, I looked up and added other funds.

Still, I didn’t think I would be owning 50% yield to maturity bonds. That was not the high I hoped to get in high yield!

I wanted to beat Treasury Bills by investing in low-duration, “money good” paper. I wasn’t looking to crush the bond market.

I exited HOBIX and watched that the fund this year has earned similar returns to the other bond funds in my sample but with more volatility.

“What were you expecting buying High Yield?” I asked myself.

And the cheeky answer I supplied was, “I was hoping to get away with a little extra yield.”

HOBIX experience with B. Riley and the accompanied volatility was a good research exercise. The fund manager has the right to invest in messy situations.

If I don’t like the volatility of high yield, I should probably not be in High yield. Or I should be prepared to hold just one or two funds without the need to diversify across them.

Lesson learnt. I now have a sharper high-yield fund concentration.

“Predicting rain doesn’t count. Building arks does” (Shareholder letter, 2001)

Stocks

Investors have greatly benefitted from owning US stocks from October 2022. In less than two years, the S&P 500 has risen from about 3600 to 5600. Including dividends, the S&P 500 Total Return Index is up 61%, and thank you! But we care about what is next, not what we have already received.

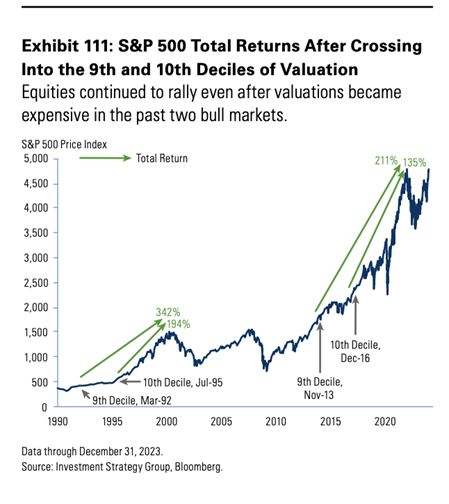
In the depths of the brutal market meltdown of October 2022, I came across a chart from Goldman Sachs. The chart is titled: S&P 500 Total Returns After Crossing into the 9th and 10th Deciles of Valuation. It’s meant to draw the point that valuations should not be a reason to lower equity allocations.

Let me take you through this picture which says a thousand words:

  1. The S&P 500 had a huge bull market in the 1990s. The market was expensive compared to earnings and other financial metrics.
  2. The S&P 500 entered the 9th decile of Valuation in March 1992, and the 10th, the most expensive decile, in July 1995.
  3. The S&P 500 kept on rallying despite the high valuations and did not peak until March 2000.
  4. Therefore, if we had used Valuations alone as a reason to get out of equities, we would have left a lot of money on the table. How much money?
  5. Starting from the months the S&P 500 entered its 9th and 10th decile to the market top in 2000, the S&P Total Return (TR), which includes dividends, rose 342% and 194% respectively.
  6. Bottom line: don’t worry too much about equity index valuation as long as corporate earnings are healthy, growing, and we are not in an economic recession.

The chart picks up again when the S&P 500 bull market began in 2009. Based on Valuation metrics alone, the S&P 500 entered its 9th decile valuation in November 2013 and the 10th decile valuation in December 2016. We have already been living for the last eight years with expensive equity valuations and the market keeps rolling on. The question is how much more can we roll on if we were to replicate the 1990s market patterns?

I have updated this chart in a table for the current level of the S&P 500. I have to use the Total Return index as the Dividends become meaningful over the years.

Step by step:

  1. Chart says we entered 9th and 10th decile valuations in Nov 2013 and Dec 2016.
  2. I used the average level of the S&P 500 Total Return Index for those two months.
  3. I used the 342% and 194% from the 1990s 9th and 10th decile Entry to market top return numbers.
  4. I derived the Implied level for the S&P 500 TR Index and…
  5. …compared it to the Actual level of the Index as of August 2024
  6. The last column in bold, shows that we are at the bottom of the 9th innings in baseball analogy.
  7. We can expect another 3-15% increase in the stock market if the bull market history were to exactly repeat itself.
  8. In terms of the S&P 500, that brings us to between 5750 and 6425. Mid-way is 6087 on the S&P 500 Price Index.

If the S&P 500 reached ~6100 in a few months, the great 15-year bull market would have caught up with the other great bull market run of the 1980s and 1990s.

Since the previous bull market ended in a dot com bust, are we going to crash again this time?  

At the minimum, it’s fair to say, the easy money has been made. When market valuations reach full price, volatility picks up. The mini-episode of market crash in early August when the S&P 500 dropped almost 10% and the VIX suffered an abnormal spike, might not be a one-off. We should prepare for volatility to be higher.

One may question, “Is this why Buffett is selling a lot of stocks?”

He does still own a lot of stocks, but a healthy cash buffer held in T-Bills has its place in every portfolio.

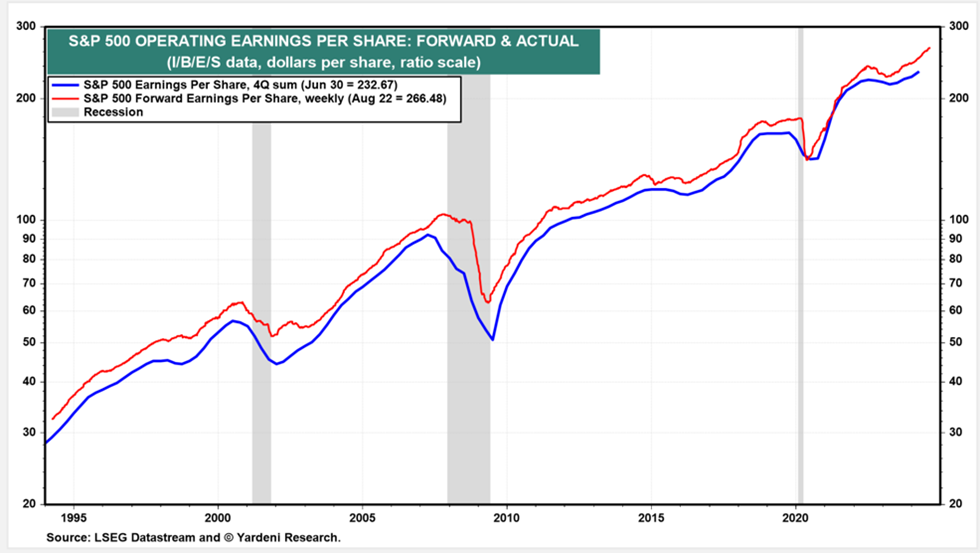
I present two other charts, with US corporate earnings.

Using Ed Yardeni research’s chart treasure trove, we see that S&P 500 Earnings per share continue their steady ascent.

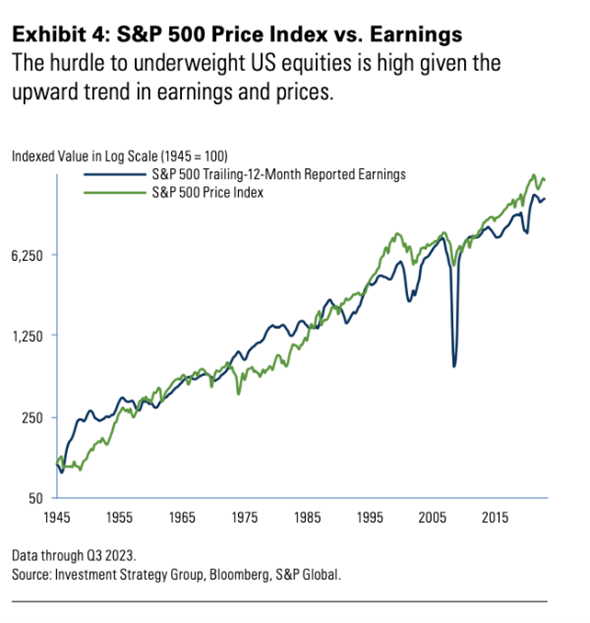
Yet another chart from Goldman, from the mid-1940s to today, tells us that the S&P 500 marches with Corporate earnings.

I am not trying to hedge myself by making arguments for both sides. I am frankly nervous about the stock market here (just as I am about the bond market).

There are some who argue midcap, small-cap, international, emerging, and value stocks are cheap. I disagree. I think all stocks are more or less at the same expensive valuation. The only question now is how long the bull market will be supportive. The stock market, my friends, might not be done, but the easy money is over.

Easy money over does not equal to crash. The US economy could continue humming along. The stock market can earn its way to greater heights, but the hard work starts now.

“Margin of safety is always building a 15,000-pound bridge if you’re going to be driving a 10,000-pound truck across it.”

Conclusion

Boy, am I a party pooper!

In October 2022, when there was only the abyss, I prepped myself by looking up at forward positive returns. Those of us who sold stocks in the great bull run have come to regret it. It’s paid to be bullish equities.

In August 2024, after a wonderful two-year run, where bonds have held in and stocks have crushed it, I am forcing myself to temper my bullishness and to look at the other side – the dark and pessimistic side.

It is true that none of the other assets are good substitutes for a US stock–bond balanced portfolio. Over the summer of 2024, three months not normally known for robust investment returns, an investor in a plain vanilla, ultra-cheap 60/40 index fund would have reaped a 6.9% return.

But it is also true that the US stock-bond portfolio has given us too much of a good thing in too short of a time.

MFO Premium Introduces ETF Benchmarks

By Charles Boccadoro

Our colleague Devesh Shah encouraged the incorporation of ETF Benchmarks into MFO Premium. Traditional benchmarks cannot be purchased. Similarly, category averages, which are the basis for much of the ratings on MFO Premium, also cannot be purchased. Establishing an ETF “benchmark,” Devesh argues, makes for a more relevant and practical comparison.

Furthermore, the exchange-traded funds ETFs selected for these benchmarks are all index-based and passively managed. Devesh remains skeptical of most actively managed funds and recommends they be viewed through the prism of a passively managed, index-based alternative.

[As a side note, like former MFO colleague Ed Studzinski, he asks when evaluating actively managed large-cap funds: What do they offer that Berkshire Hathaway BRKA does not?]

Since MFO’s inception in 2011, David Snowball has consistently employed comparisons with several “reference” funds in his fund profiles, which now tally 133. These comparisons are integral to our Risk Profile tool, which is freely available to the MFO community, along with QuickSearch, Great Owl, Three Alarm, and Dashboard of Profiled Funds tools.

The five venerable Vanguard reference funds: Total Bond Market Index (VBMFX), Balanced Index (VBINX), Vanguard STAR (VGSTX), Total Stock Market Index (VTSMX), and Vanguard Total International Stock Index (VGTSX). Each is further delineated in the table below.

David’s Reference Funds

Here is a link to the Risk Profile for Dodge & Cox Global Bond Fund (DODLX), which David profiled in 2014, to demonstrate comparative use of the reference funds. DODLX just passed its 10-year mark and is currently an MFO Great Owl. Risk Profiles can also be obtained by clicking on ticker symbols in almost any tool on the site.

The ETF Benchmarks expand this concept for 123 of the 174 rated categories, comprising more than 9,000 actively managed funds. (Yes, it’s true … there are nearly 12,000 US funds and the vast majority are actively managed.) Against these funds, 71 ETFs based solely on their target category have been assign, as summarized in table below. Generally, the ETFs are widely recognized (e.g., Vanguard or BlackRock), have lower ER, enjoy longevity, and retain larger AUM for better liquidity.

The ETF Benchmarks


In some cases, typically mixed asset, two broadly recognized ETFs are combined, like VTI and AGG, to form allocation ETFs, denoted VA6040, in this example, or VE5050 in the case of VWO and EMB.

Granted, this approach is subject to the same shortcomings as other benchmarking methodologies: category drift, survivorship bias, mis-categorization. But it keeps things simple and transparent. And presents the persistent challenge: What does this actively managed fund offer that a broadly used ETF does not?

Users can also pull-up these benchmarks in MultiSearch by selecting PreSet Screens/Benchmarks & Reference/ETF Benchmarks. Performance ratings based on them carry the designation APRBE. (Users can pull-up David’s Reference funds in same place.)

So, what can we do with the new benchmarks?

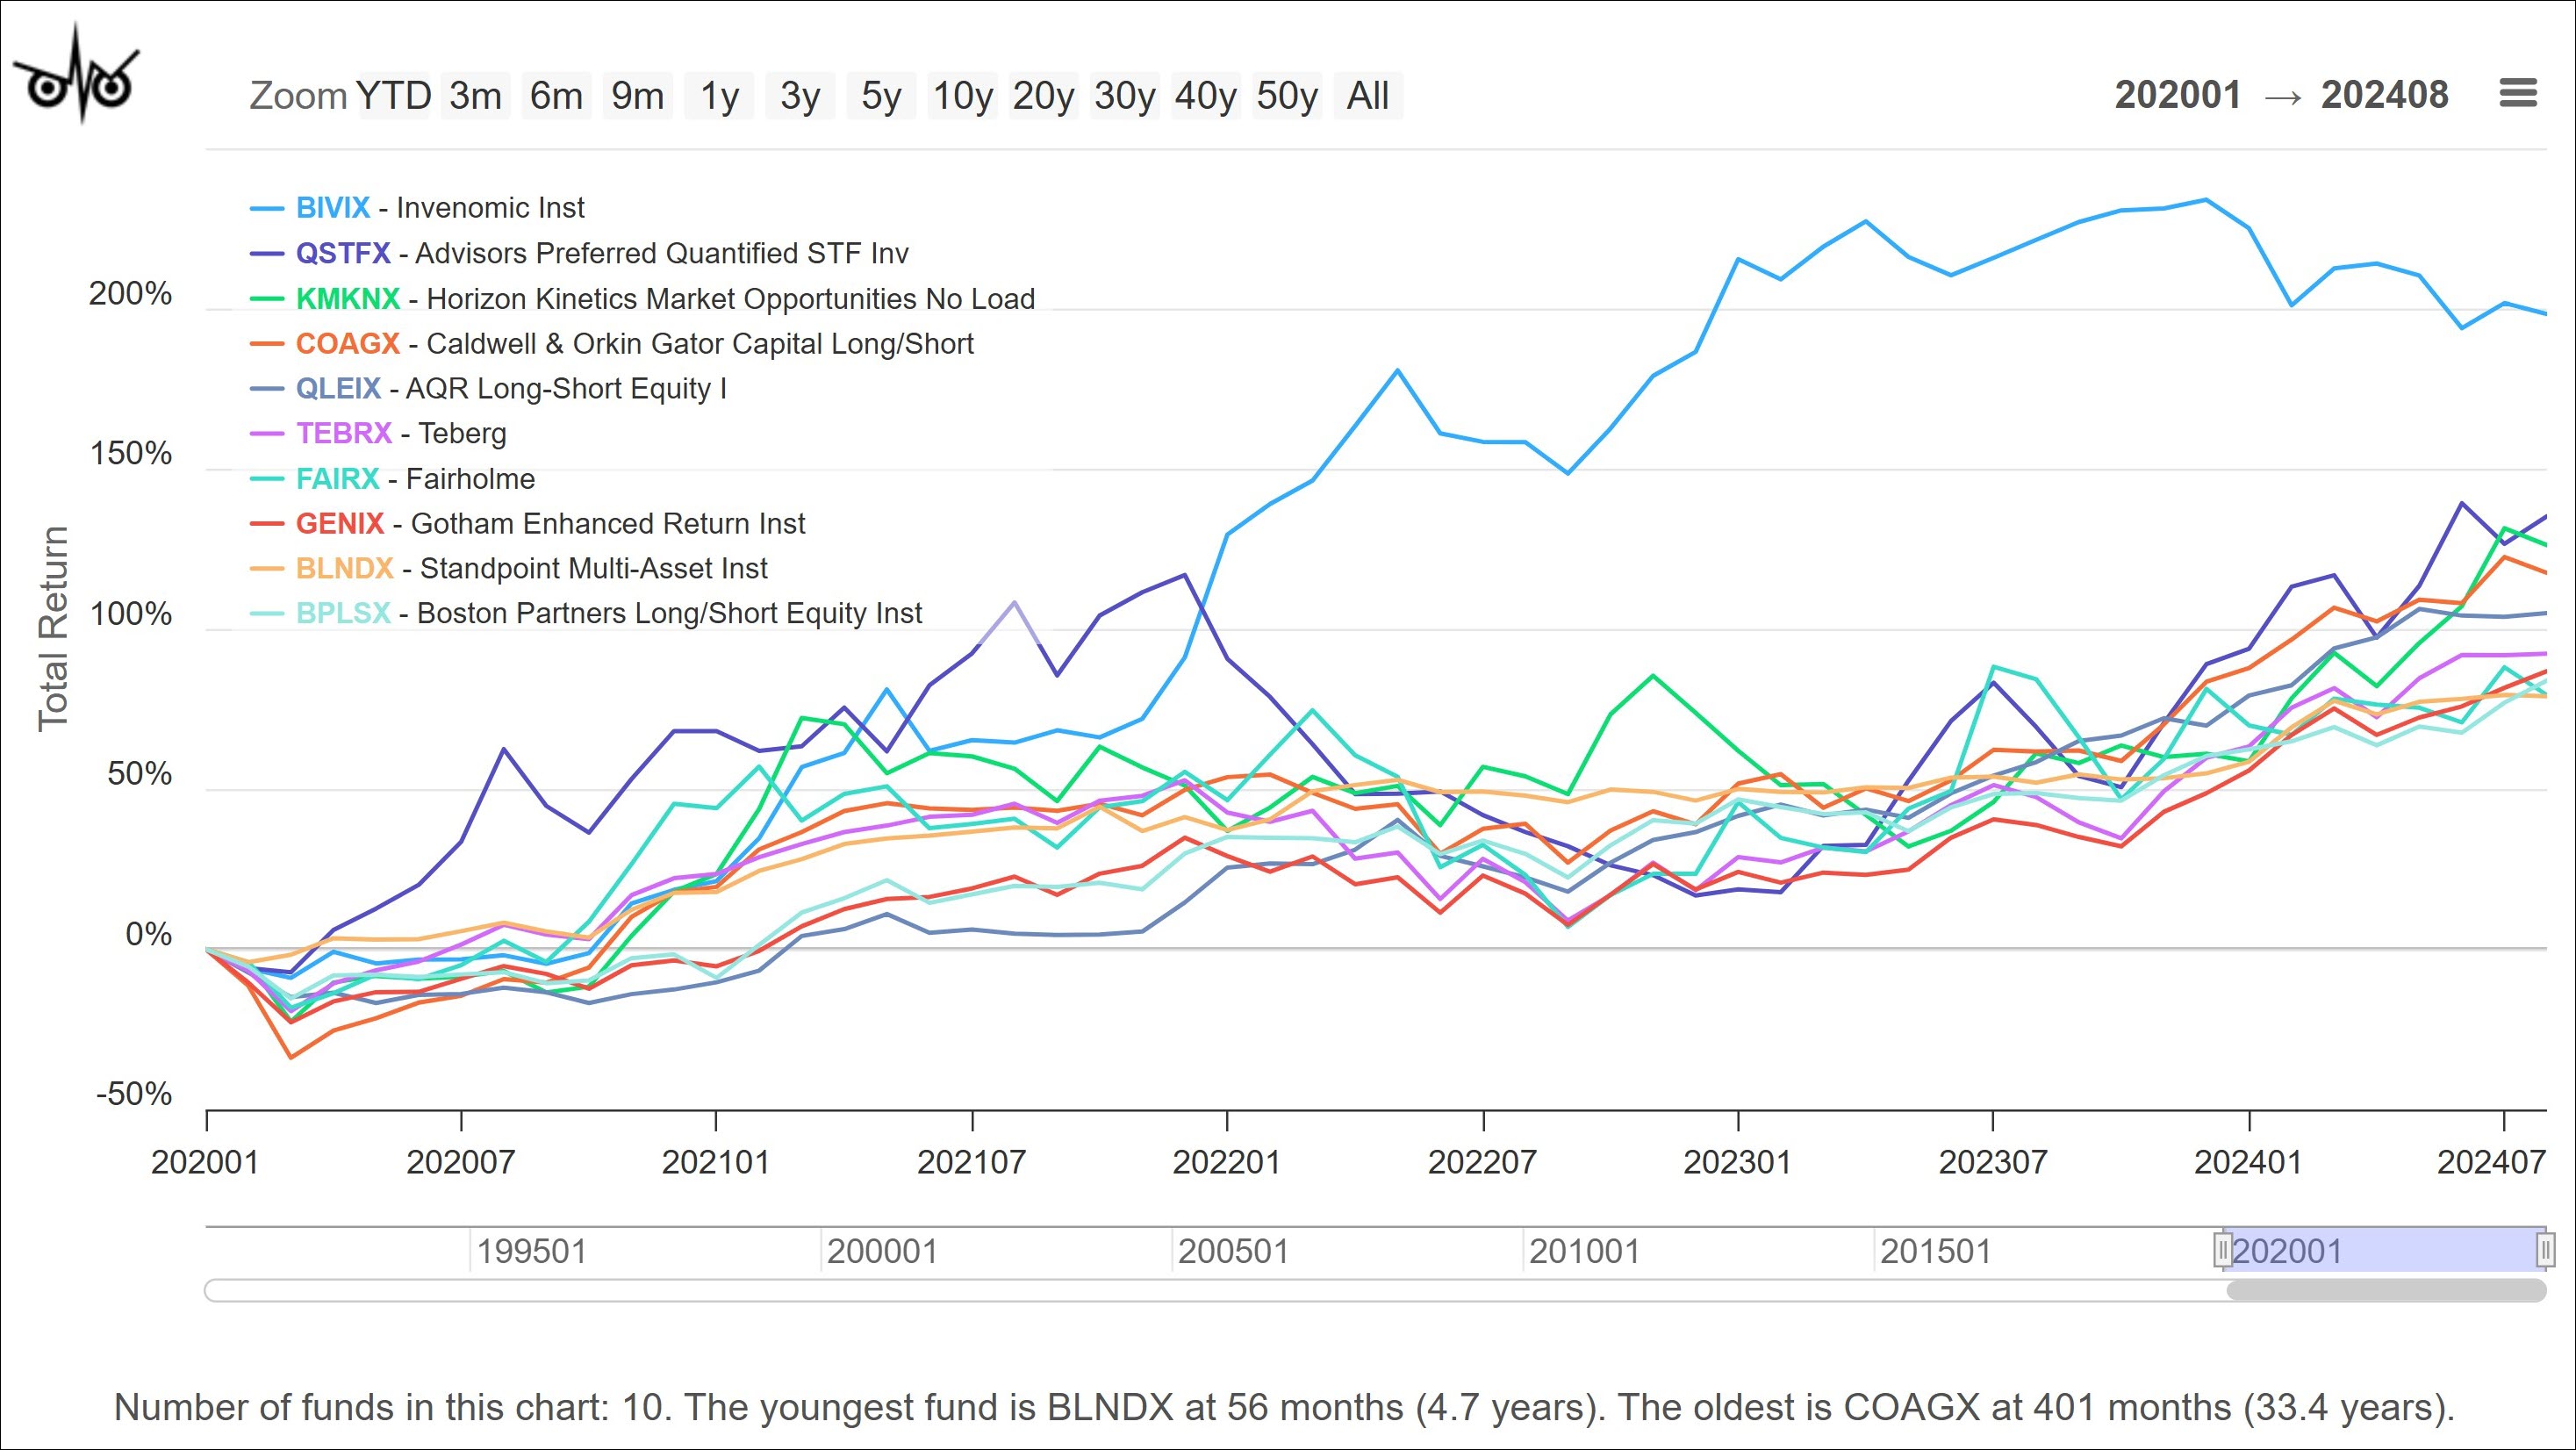
Below are the top performing mutual funds by absolute return since COVID, almost five years ago, when compared to their ETF Benchmark Mixed-Asset Target Alloc Moderate [VTI/AGG 40/60]:

Top Funds Since COVID with ETF Benchmark VA4060

They include Invenomic (BIVIX), AQR Long/Short (QLEIX), Fairholme (FAIRX … can you believe?), and Standpoint Multi-Asset (BLNDX). BIVIX was profiled by David in 2019. QLEIX profiled (by Sam Lee) in 2016. BLNDX profiled last January.

The ETF Benchmarks come with attendant ratings, called APRBE Rating, short for APR vs ETF Rating. (APR is Annualized Percent Return, typically.) All actively managed funds of a particular fund type, like Equity or Bond, are rated based on APR vs ETF return across a specified evaluation period. Those with highest decile performance are assigned a 10 (best).

In MultiSearch, users can screen for APRBE Rating by selecting desired decile or, alternatively, an absolute APR vs ETF percentage. Users can also examine category averages to see if some categories have consistently beat their ETF Benchmarks. Best to explore in MultiSearch, the site’s main search tool, specifically using Risk & Return selection criteria, plus other criteria like Asset Universe (e.g., Mutual Funds), Fund Type (e.g., Equity), and Display (or evaluation) Period.

MultiSearch Selection Criteria – Risk & Return Metrics


In addition to MultiSearch, where users would be well advised to compare a fund’s performance to its ETF Benchmark, we’ve included the APR vs ETF return metric in our Launches Dashboard and Dashboard of Profiled Funds, using the period since the launch alert or fund profile was last posted.

For users that desire a more fundamentals-based benchmark, MultiSearch also includes so-called “Best-Fit” Benchmarks. Currently, LSEG (formerly Refinitiv, formerly Lipper) assigns 163 indexes as “Best Fit” Benchmarks to most funds in the database, actively or passively managed. This benchmark is a market-recognized index that best correlates with the performance of the fund; therefore, it gives some idea of what role a given fund might play in an investor’s portfolio. Unlike benchmarks often defined by a fund’s manager, these indexes are broadly used and available. Like with our new ETF Benchmarks, the Best-Fit benchmarks have attendant metrics and ratings, like APRBF Rating, short for APR vs Best-Fit Rating. They can be accessed in MultiSearch in much the same way.

All the various types of benchmarks included on the site are described on the Definitions page. For what it’s worth, my impression is that benchmarking and indexing have become a big business in the fund industry, with almost as many indexes as funds themselves. A bit of an exaggeration perhaps, but not by much. In the meantime, I find the incorporation of Devesh’s ETF Benchmark idea to the site quite satisfying. I trust you will too.

Launch Alert: Research Affiliates Deletions ETF (NIXT)

By David Snowball

On September 10, 2024, Research Affiliates will launch its first ETF. Research Affiliates was founded in 2002 by Rob Arnott to provide professional and institutional investors with innovative research and product development. Mr. Arnott is iconic, having published 150 or so research articles that received both attention and rewards. His most extensive work is The Fundamental Index: A Better Way to Invest (2008). Most traditional indexes are capitalization-weighted, so they lock in a large/growth/momentum bias. Arnott notes that the bias may contaminate performance and argues for “fundamental” indexes that give preference to firms that are, oh, I don’t know, consistently profitable and efficient. That insight eventually gets incorporated into what are called “smart beta” products.

RAFI’s focus is on “smart beta and enhanced indexing, quantitative active equity, and multi-asset products” and is driven by the idea that markets are not efficient and their inefficiencies are predictable and exploitable. Like Leuthold before, their research business generated calls for them to offer products driven by research (rather than, more commonly, by marketing). Up until now, most investors are exposed to Research Affiliates through their RAFI collaborations with Invesco (for instance, Invesco RAFI Strategic US ETF) and PIMCO (as in PIMCO RAFI ESG US ETF, the only fund that has to be rendered entirely in capital letters). As of June 30, 2024, the firm has over $147 billion in assets using strategies developed by Research Affiliates.

Research Affiliates is about to launch its first directly branded ETF, the Research Affiliates Deletions ETF (NIXT). NIXT will buy the companies ejected from large cap (“the 500”) and mid-cap (“the 1000”) indexes. They will hold those companies in an equal-weight portfolio for five years, rebalancing annually.

Why? Investors have long known that the companies dropped from the S&P 500 tend to outperform the S&P 500 (and, in particular, outperform the companies that replaced them). RAFI systematized that observation in a recent research piece, “Nixed: The Upside of Getting Dumped” (August 2024). They found that “stocks deleted from market-cap weighted indices have soundly beaten the small cap value benchmark over the past 30 years, including during this last difficult decade for small-cap value companies.” In particular, they outperform for about five years, hence the fund’s holding period.

Why might you be interested? First, it provides a small cap value fund that’s going to be very different from its peers. Second, it provides return drivers that are structural and uncorrelated with the market. Cap-weighted strategies rise when, if, and to the extent that, the market rises. Strategies with uncorrelated alpha (some long/short and arbitrage strategies, as examples) have the prospect of prospering in flat or falling markets, while still participating in rising ones.

The fund has its own website and advertises an expense ratio of 0.09%.

Briefly Noted

By TheShadow

Updates

Tortoise Capital Advisors is merging three closed-end funds, with combined assets of over $300 million, into a single actively managed ETF. The current funds are Tortoise Power and Energy Infrastructure Fund (TPZ), Tortoise Pipeline & Energy Fund (TTP), and Tortoise Energy Independence Fund (NDP). They will be supplanted by the Tortoise Power and Energy Infrastructure ETF which will adopt TPZ’s strategy for its own. As a warning: the Morningstar star ratings on the funds (two-, three- and zero stars) are somewhere between useless and misleading. The number of funds in their respective peer groups is 7, 9, and 3.

At the same time, they’ve decided to sell their UK-based Ecofin Advisors Limited business and its private credit unit.

Tortoise is based in Overland Park, Kansas, and manages about $8 billion in assets. Their founder, Tom Florence, had a long career at Fidelity then founded and was president of Morningstar Investments Services.

Briefly Noted . . .

More fund-to-ETF conversions are in the pipeline: sometime in the first quarter of 2025, abrdn Focused U.S. Small Cap Equity Fund becomes abrdn Focused U.S. Small Cap Active ETF (though really, wouldn’t abdrn fcsd us smll cap qty fall trippingly from the tongue?) and abrdn Emerging Markets Dividend Fund morphs into abrdn Emerging Markets Dividend Active ETF. It’s still pronounced “Aberdeen,” by the way.  A witty Wikipedia entry attributes the disemvowelling of the funds to the fact that the website “Aberdeen.com” had already been claimed by something else while the nonsensical “abrdn.com” was still free and on the loose.

Brown Advisory Flexible Equity ETF is in registration.  The ETF will be actively managed by Maneesh Bajaj.  The ETF invests primarily in securities of medium and large market capitalization companies that the Adviser believes have strong, or improving, long-term business characteristics and share prices that do not reflect these favorable fundamental attributes. Medium and large market capitalization companies are, according to the Adviser, those companies with market capitalizations generally greater than $2 billion at the time of purchase utilizing a “flexible equity” philosophy. Flexibility allows the Adviser to look at many types of opportunities expanding the bargain-hunting concepts of value investing to a broad range of opportunities. Expenses have not been stated as of this writing.

The FPA Short-Term Government ETF is in registration. The ETF will invest primarily in at least 80% of its assets in debt securities issued or guaranteed by the U.S. government and its agencies and instrumentalities, and in repurchase agreements in respect of such securities. Abhijeet Patwardhan, who manages the FPA New Income Fund, will be the day-to-day manager. Expenses have not been disclosed.

FinTrust Income and Opportunity Fund (HROAX) might be getting a new management team. Not sure yet, but “FinTrust Capital Advisors, LLC (“FinTrust”), is the current adviser to the Fund … FinTrust recommended that M3Sixty Capital take over management of the Fund under the New Advisory Agreement or that the Fund be liquidated, effective on the Closing Date.” Well, let me guess how this will play out.

In November 2024, New America High Income Fund, a third-party closed-end fund, will transfer all its assets – about $175 million – into the T. Rowe Price High Yield Fund. New America has two distinguishing features: (a) it is about 30% leveraged and (b) it’s been managed since inception by the T. Rowe Price High Yield managers. The merger is a major win for New America shareholders who have been footing a charge of 4.29% annually which is just about half of the portfolio’s average return over the past five years.

Vanguard announced plans to introduce Vanguard Core Tax-Exempt Bond ETF (VCRM) and Vanguard Short Duration Tax-Exempt Bond ETF (VSDM), two active municipal ETFs that will be managed by Vanguard Fixed Income Group. Vanguard Core Tax-Exempt Bond ETF will offer all-curve exposure to primarily high-quality, investment-grade municipal bonds that offer tax-exempt income. Investors in Vanguard Short Duration Tax-Exempt Bond ETF can expect a portfolio of short-duration and primarily high-quality, investment-grade municipal bonds that generate tax-exempt income with lower interest rate sensitivity. 

Vanguard Core Tax-Exempt Bond ETF will have an estimated expense ratio of 0.12% compared with the average expense ratio for competing funds of 0.37% as of June 30, 2024. Vanguard Short Duration Tax-Exempt Bond ETF will also have an estimated expense ratio of 0.12% compared with the average expense ratio for competing funds of 0.24% as of June 30, 2024. Vanguard intends to launch the ETFs before the end of the year.

On August 16, 2024, UBS Asset Management agreed to transfer the management of UBS AM’s Quantitative Investment Strategies business, which includes the portfolio management team of the Funds to Manteio Scalable Technologies LLC. Manteio has no operating history and is a newly formed investment adviser who is in the process of registering with the SEC. In consequence, the Credit Suisse Managed Futures Strategy Fund will become the Manteio Managed Futures Strategy Fund while the Credit Suisse Multialternative Strategy Fund morphs into the Manteio Multialternative Strategy Fund.

Western Asset Management co-chief investment officer Ken Leech faces a potential enforcement action from the Securities and Exchange Commission as part of a probe into whether some clients were favored over others in allocating gains and losses from derivatives trades. Franklin-Templeton acquired Western Asset with its 2020 purchase of Legg Mason.

Small Wins for Investors

Amplify Cash Flow Dividend Leaders ETF has extended its fee waiver so that investors pay 0.0% to own the fund.

Closings (and related inconveniences)

Old Wine, New Bottles

Effective on or about January 8, 2025, Allspring Emerging Markets Equity Income Fund becomes Allspring Emerging Markets Equity Advantage Fund. Given that there are no changes to the fund’s strategy, the “advantage” in question seems to be “equity income.”

On or about October 14, 2024, the Amplify Global Cloud Technology ETF descends from the clouds and becomes the Amplify Bloomberg AI Value Chain ETF. What, you ask, is an AI value chain, and will it make you nearly as rich as your blockchain fund did?  The advisor reports, “The Bloomberg AI Value Chain Index tracks the performance of [the top 45] cloud computing, semiconductor, and hardware companies focused on the next generation of computing needs.”

Effective on August 19, 2024, AQR Sustainable Long-Short Equity Carbon Aware Fund was renamed AQR Trend Total Return Fund. Yep, “renamed.” This strikes us a lot like declaring that Billy Bob’s Deep Sea Mining Fund has been “renamed” Billy Bob’s Short-Term Municipal Income Fund.

On or about October 15, 2024, the AXS Astoria Inflation Sensitive ETF becomes the AXS Astoria Real Assets ETF. The “real assets” in question are natural resource-linked securities, inflation-linked bonds, and global real estate.

Effective October 10, 2024, BlackRock Future Financial and Technology ETF becomes iShares FinTech Active ETF with a newfound (and statutory) affection for FinTech stocks.

The five-star, $1 billion  CrossingBridge Low Duration High Yield Fund has become CrossingBridge Low Duration High Income Fund, effective late August 2024.

They are renaming in response to (1) evolving guidance from the SEC about naming, and (2) in recognition of the fact that the fund has traditionally been a multi-sector vehicle (one of the reasons for hiring a high-yield specialist that is they know when more high yield is not serving their investors). Historically the fund doesn’t exceed about two-thirds in high yield, and Morningstar already recognizes it as multi-sector. Manager David Sherman agrees that that assignment is fair.

The name change reflects those two factors. In conversation, Mr. Sherman was clear that it does not reflect any change to what they do or how they do it.

Morningstar holds a robo-driven disdain for the fund’s advisor, Cohanzick Management, despite admitting that “It has had a five-year risk-adjusted success ratio of 100%, meaning that of the strategies with a five-year track record, 100% have survived and beaten their respective category median on a risk-adjusted basis.”

Effective August 26, 2024, DGA Absolute Return ETF became DGA Core Plus Absolute Return ETF with no changes in fees, strategies, or leadership. It’s a small, young ETF-of-ETFs that incorporates a strategy that uses diversification and hedging to target a downside capture of less than 50% of the market and an upside capture of more than 50%. The manager had run the same strategy with some fair success while at Doliver Advisors LP in Texas.

Effective August 29, 2024, ERShares Private-Public Crossover ETF will replace ERShares Entrepreneurs ETF as the name of the fund.

Effective October 7, 2024, the Glenmede Responsible ESG U.S. Equity Portfolio will be changed to the Glenmede Environmental Accountability Portfolio. Hmmm … interesting game.

On September 30, 2024, Jensen Quality Value Fund will be rechristened Jensen Quality MidCap Fund. The name change is accompanied by an embrace of “the name rule,” which means the fund will probably continue to use the same value discipline but commit to investing at least 80% in quality mid-cap stocks.

Effective August 1, 2024, Towle Deep Value Fund became Towle Value Fund. It remains a deep value fund but doesn’t want to burden you with that reminder.

The Ninety-One Funds, formerly the investment arm of Investec, are being adopted by American Beacon, and so on November 15, 2024, Ninety-One Global Franchise Fund and the Ninety-One International Franchise Fund added American Beacon to the front of their names. Ninety-One Emerging Markets Equity Fund follows suit on or about February 21, 2025. There is, to date, no compelling evidence to draw investors toward the funds which, nevertheless, hold about $700 million between them.

WCM Developing World Equity Fund is on the road to becoming First Trust WCM Developing World Equity ETF, an actively managed ETF, as is the larger, more successful WCM International Equity Fund. Developing World is a three-star, $2 million fund that has derived about half of its assets from the three managers’ personal investments. International, managed by the same team, sits at $80 million with four stars. The trio came to WCM from Thornburg and, WCM avers, that their managers are “audacious.” Finally, the four-star, $456 million WCM Focused Global Growth Fund, managed by a different team, will become WCM Focused Global Growth Fund. The changes are submitted to shareholders in September and will likely, become effective before the year’s end.

Off to the Dustbin of History

Allspring Conservative Income Fund will be liquidated on or about October 25, 2024.

Allspring Municipal Sustainability Fund, contrarily, is slated to cease sustainment two weeks earlier, on or about October 9, 2024.

The Amplify Treatments, Testing and Advancements, Inflation Fighter, and Emerging Markets FinTech ETF will be liquidated on or about September 10, 2024. (Was there a point at which any of you thought “I want to ride the tip of the spear! Emerging. Markets. FinTech, baby!!”?)

Bridgeway Managed Volatility will be liquidated on or about November 18, 2024. We sort of tepidly endorsed the fund because it’s … you know, nice. Sensible. Stuck to its knitting. It never wowed anyone but it wasn’t designed to; it was designed to have a slight asymmetry to the upside: an upside capture ratio slightly higher than its downside capture, which it did. But it never caught on, ending up with $32 million in AUM.

On or about September 13, 2024, the Fidelity Latin America Fund will be merged into the Fidelity Emerging Markets Fund. It will be a tax-free reorganization, as most are.  

Harbor International Growth Fund will be liquidated and dissolved (you have to appreciate the thoroughness) on October 23, 2024. It’s a $150 million, one-star fund that’s been under Baillie Gifford’s guidance for the past decade. Bad news: it’s returned about 3.7% annually and trailed 94% of its peers. Better news: over the past 15 years, it trailed 99% of its peers so there was some improvement.

Manning and Napier Real Estate will become unreal on October 11, 2024.

MDP Low Volatility Fund will be liquidated on or about September 24.

On August 15, 2024, a series of iShares ETFs were liquidated: the iShares Currency Hedged MSCI Germany, Gold Strategy, International Developed, MSCI Intl Size Factor, USD Systematic Bond, and Virtual Work and Life Multisector ETFs all became former funds.

Royce Global Financial Services Fund, which “is being liquidated primarily because it has not maintained assets at a sufficient level for it to be viable,” departs on September 9, 2024.

Veridien Global Investors LLC reports “experiencing financial difficulties, which has led to the resignation of the Sub-Adviser’s Chief Investment Officer, who was one of the Fund’s portfolio managers.” In light of her resignation, the Veridien Climate Action ETF was liquidated on August 20, 2024.