Monthly Archives: June 2024

June 1, 2024

By David Snowball

Dear friends,

It’s been a whirlwind month for us. In just about 30 days, I got married (waves to Chip!), finished my 68th trip around the big ball o’ fire in the sky, bade farewell to my 40th group of seniors (just a heads up, world. They’re coming for you!), visited with the managers from FPA (really, if you put Mr. Scruggs in a cardigan he’d totally rock the Mr. Rogers’ look), watched the Dow hit 40,000 and visited my brothers and sisters in Pittsburgh for the first time in two years.

There’s a certain vogue in decrying today’s college students as unserious cell phone junkies more interested in their social media presence than in their intellectual development.

That is, so far as I can tell, mostly delusional. They are different than I was as a college student, but their world is different. If they hadn’t adapted, they couldn’t survive it. They are certainly constantly connected, for good and ill. For the good, they leave no one behind. When I went to college, my ties with high school friends mostly withered, and I became a creature of Pitt (the college) rather than Wilkinsburg (the high school). Them not so much. They seem to maintain vibrant ties across communities and chapters of their lives.

For the ill, the technology that we pressed upon them has made them less inclined to linear thought. The web was created by Tim Berners-Lee, who was trying to craft an environment hospitable to those – like him – who tended toward ADHD. The old joke is that he created an environment for those with ADHD and then trained us all to be ADHD.

They are a remarkable bunch. Ayo, whose college education was ended by the collapse of his uncle’s business but who worked to the last day to do his best work. David, who spent 29 years in prison for a crime he was exonerated of and who aspires to be a counseling psychologist. T.Y., whose brother was murdered mid-term and who returned after an absence of just four days with renewed determination to succeed. The Film Cluster, three students who were sharing a film and theatre major and nearly bubbled over at the start of each class. Sean, who began to speak about his WAsian – white Asian – identity and his crazy family. Genevieve, whose mind grew like a weed. And many who wondered whether the world they were inheriting would remain hospitable.

They’re good kids. We just sent some your way. It will take them a bit to find their footing, but they will work … and work to craft a better home for us all. Rejoice.

In this month’s Observer

We begin summer with a really exceptional, thoughtful analysis by Devesh Shah on how to think about allocating assets to international equities. The conventional wisdom, driven by Yale’s former CIO, is to start with 18% international. Devesh looks at why that’s been a multi-decade loser and offers evidence for an efficient frontier portfolio with about 5% international equity.

Lynn Bolin likewise embraces the data to identify the best fund families for equity ETFs. He combines the resources of the MFO Premium fund screener and the Portfolio Visualizer analysis to determine the firms that most consistently get it right and then looks at the implications in both a model portfolio and in his own.

As you’ll read below, I spent a bit more than a day with the FPA managers at the FPA Investor Day in Chicago. It renewed my admiration for Steve Scruggs, his team at Bragg Financial, and the performance of his FPA Queens Road Small Cap Value Fund. The short version is brilliant protection when you need it most, solid upside the rest of the time, and some thoughtful evolution of the investment discipline, and so we’ve published an updated profile of the fund.

In commemoration of Augustana’s newest corps of graduates, the 164th in our history, I offer unsought words of advice for young people who need to be thinking about the role of money in their futures. Here’s the short version: money is not your ruler, it’s your servant, and here’s how to set the foundation of a long and healthy relationship with it.

Finally, The Shadow has been doing faithful sleuthing on the industry … and on the MFO Discussion board. He commends two thoughtful discussion threads – on commentaries by the managers of GMO US Quality Equity ETF and Palm Valley Capital Fund – to your attention and also shares the industry’s churning as funds become ETFS or … well, corpses.

FPA Investor Day: Minds in Motion

It’s no secret that most active managers are nice people who simply don’t earn their keep. MFO’s founding principle is that 80% of funds could be shuttered immediately with no loss to anyone but their advisers. There are some arenas where their odds are somewhat better – emerging markets, developed international equities – but those are few.

MFO’s mission is to connect thoughtful individual investors with the small cadre of thoughtful professional investors whose skills might materially increase your chance of success. What is “success”? Our mantra is simple: success is when the sum of your resources exceeds the sum of your needs at the moment you need them. It’s not about investing as a game; if your portfolio beats the market ten years out of 10 and your resources are less than the sum of your needs, you’ve lost. If your portfolio never beats “the market,” but at the finish line, you have the resources you need to live the life you’ve worked for, you’ve won.

What characterizes the 20% of managers who are actually worth your attention? They keep it simple so you can understand what’s happening to the money you entrust to them. They loathe the idea of losing your money. They have managed successfully across time and market cycles. They invest beside you (the research is great: having the manager invested improves risk-return performance a bit, having the trustees – the manager’s bosses – invested improves it a lot, and having their mother-in-law in the fund … golden!), they communicate openly with you, and they are accessible to you (it’s called a “telephone,” and only some advisers appear to own one). And, finally, they are still learning. The phrase is “ancora imparo.” In Latin, it’s attributed to Michelangelo at age 87 and translates as “I am still learning.”

That often leads us toward the near-extinct tribe of absolute value investors, guys who have an instinctive aversion to the excuse, “Well, it’s the best of a bad lot.”

On May 21-22, FPA hosted their Investor Day in Chicago, Illinois. I was pleased to be able to attend.

FPA is a Los Angeles-based adviser managing about $26 billion in assets. Their mission statement is “We aim to be recognized as a leading practitioner of value investing. We seek to offer our clients a prudent place to invest their capital, and to provide them with market-beating returns over the long term while emphasizing preservation of capital. We also seek to foster a culture of excellence, to maintain high ethical standards, and to adhere to our Core Values.” They advise five FPA funds (three open-ended, one close-ended, and one ETF) and, through a strategic partnership with North Carolina’s Bragg Financial, the two FPA Queens Road funds.

  Portfolio Managers Ratings Manager Ownership
FPA Crescent Fund (FPACX) Steven Romick Mark Landecker Brian A. Selmo Five star
Silver
MFO Honor Roll
LipperLeader for Total Return and Consistent Return
Over $1,000,000 Over $1,000,000 Over $1,000,000
Source Capital (SOR) Steven Romick Mark Landecker Brian A. Selmo Abhijeet Patwardhan Four-star
LipperLeader for Total Return and Consistent Return
Over $1,000,000 $100,000-$500,000 $100,000-$500,000 $10,000-$50,000
FPA Flexible Fixed Income Fund (FPFIX) Abhijeet Patwardhan Four-star
Bronze
MFO Great Owl LipperLeader for Total Return and Consistent Return
Over $1,000,000
FPA New Income Fund (FPNIX) Abhijeet Patwardhan Four star
Bronze
LipperLeader for Total Return and Consistent Return
Over $1,000,000
FPA Queens Road Small Cap Value Fund (QRSVX) Steven H. Scruggs Five star
Gold
LipperLeader for Total Return and Consistent Return
Over $1,000,000
FPA Queens Road Cap Value Fund (QRVLX) Steven H. Scruggs Five star
Gold
LipperLeader for Total Return and Consistent Return
Over $1,000,000

We had a chance to listen to, question, and dine with each of their teams.

Highlights thereof:

the folks at FPA are (1) good and (2) still learning.

Each manager began by explaining what they do and continued on to explain how what they do is evolving. The former is richly explained in our profiles of the funds and on the FPA website, so I’ll just say a few words about the latter.

Steve Romick and Brian Selmo, representing FPA Crescent and Source Capital, their closed-end fund:

Crescent launched in 1993 and became an FPA fund in 1996. It has a famously flexible portfolio with an absolute return focus and the ability to invest across capital structures, geographies, sectors, and market caps. Source launched in 1968 and was adopted by the FPA Crescent team at the start of 2016. Over the past one-, three- and five-year periods, the correlation between the funds is between 98-99.

  1. The most pronounced change over the past 10-15 years has been a reversal of the fund’s exposure to quality stocks versus special opportunities (aka distressed securities). Currently, the fund is about 70% high-quality equity and 30% special opps; it used to be reversed.
  2. The fund works hard to avoid investing in disrupted companies but tends not to pursue their disruptors either.
  3. Volatility has been helpful as speculators with no attention span (by their estimate, 20-30% of all stock trades are in reaction to quarter earnings calls) sell to investors with long-term ones. Mr. Romick referred to the time-arbitrage advantage as people with 90-day perspectives sell to people with five-year ones.
  4. Inflation is likely to be higher over the next 10-20 years than has been experienced in the past 10-20 years. If that holds true, the fund will likely have greater equity exposure than it traditionally has. Higher inflation makes cash a losing proposition and it’s rarely a friend of fixed income, so equities will default to a higher weighting.

By way of full disclosure, Crescent is my largest non-retirement holding. I first invested in it near the turn of the century and added to it recently.

Abhijeet Patwardhan, representing FPA New Income, a risk-averse fund investing in short-term investment grade and high-yield debt, and FPA Flexible Income, an institutional fund with more duration flexibility:

  1. Patwardhan is Fed agnostic. He does not know what the Fed will do and can’t guess right often enough to justify the effort.
  2. Bonds have an asymmetric risk-return profile: they have zero upside (hold them to maturity, and you get exactly what you paid for) but unlimited downside (i.e., default). As a result, there’s a strong focus on downside management.
  3. The high-yield market is not currently worth the effort.
  4. Contrarily, they are being paid to move out of the maturity spectrum a bit. In 2021, the fund had a duration of 1.4 years; that’s now climbed to 3.04 years.

Steve Scruggs, representing FPA Queens Road Small Cap Value Fund, the archetype of a quality-at-a-reasonable price portfolio:

  1. As with Crescent, the attractiveness of cash has been diminished. Mr. Scruggs ran an analysis of the impact of cash on the portfolio. His finding was the security selection produced about two-thirds of the fund’s downside protection. In consequence, he expects to dial back the fund’s cash holdings with an effective cap of about 10% cash. As recently as 2020, they sat at about 23% cash.
  2. He’s focusing on companies with pricing power in anticipation of an extended stretch of higher inflation.
  3. He suspects that artificial intelligence might have the same magnitude of impact as did the internet. While he’s certainly not ever going to dash in the direction of the current equivalent of a dot.com darling, he is actively assessing the ways in which AI will impact – for good and ill – the prospects of portfolio companies.
  4. The small cap universe is seeing some of its lowest valuations since the days of the dot.com bubble. That said, many small caps are trash, and high-quality small caps available at reasonable prices are harder to find. He’s willing to pay a bit of a price premium for great companies but is more demanding on the valuations of merely quite good ones.

On the whole, I came away with a sense of continuity and change. The firm’s commitment to quality, to risk management, and to standing with their investors has not changed at all. Their understanding of the changed economic and technological environment has led them to make thoughtful, incremental changes to the process of portfolio constructs.

The process and the results both are encouraging.

The climate

The most common story surrounding the global climate can be summarized in two words:

We’re.

Screwed.

Collectively, we’re also in a curious denial. Two-thirds of the American public agrees that things are going from bad to worse, and then we rush out to buy another living room on wheels. Light trucks, including pickups and SUVs, are now around 80% of all “car” sales. Good for manufacturers (the profit margin on SUVs is about five times as great as on cars), bad for drivers (they’re expensive and have a habit of getting into accidents because they’ve about as easy to maneuver as the Queen Mary), and terrible for the planet (ummm … my sister’s mid-sized SUV clocks in at 15.5 mpg).

In case you’re wondering about the “living room on wheels” sobriquet, here’s a quick look at the 50-year evolution of pickup trucks from utilitarian job site haulers to … well …

It is worth remembering, however, that a lot of people are working to change our fate. From government incentives to encourage renewables and conservation (the Inflation Reduction Act is creating a surprising surge in the deficit precisely because so many businesses, farmers, and homeowners are finding its incentives compelling) to smart scientists and businessfolks who are finding ways to do more with less (carbon), there have been some incredibly positive changes.

At one level, our carbon emissions may already have passed their peak levels. The New York Times “Climate Forward” newsletter:

Amid a deluge of terrifying headlines about destructive tornadoes, blistering heat waves, and DVD-sized gorilla hail, here’s a surprising bit of good news: Global carbon dioxide emissions may have peaked last year, according to a new projection.

It’s worth dwelling on the significance of what could be a remarkable inflection point.

For centuries, the burning of coal, oil and gas has produced huge volumes of planet-warming gasses. As a result, global temperatures rose by an average of 1.5 degrees Celsius higher than at the dawn of the industrial age, and extreme weather is becoming more frequent.

But, we now appear to be living through the precise moment when the emissions that are responsible for climate change are starting to fall, according to new data by BloombergNEF, a research firm. This projection is roughly in line with other estimates, including a recent report from Climate Analytics. (“Climate: The right kind of tipping point,” 5/30/2024)

At a more micro-level, several manufacturing changes have emerged that might revolutionize two industries, solar and steel. (Yes, steel.)

The Wall Street Journal reports that a well-funded company has a process for substantially reducing the price of producing solar cells, allowing US manufacturers to compete with half-price Chinese cells.

Steel production, in which iron ore is heated with coal to produce iron oxide, accounts for 8% of the world’s greenhouse gas production. Boston Steel, a US-based start-up, has received $300 million in funding to commercialize its process for producing carbon-free steel.

That doesn’t make it all better. Far from it. But it does remind us of a simple point: things can get better if we’re willing to work together. It will require a temporary end to our recent fixations with conspiracies and circuses in favor of conscious action, but our fate remains in our own hands.

Morningstar on tap

Both Charles Boccadoro, maestro of MFO Premium, and I will be bouncing around the Morningstar Investment Conference in late June. Feel free to reach out to Charles or me if you’d like a chance to chat during the newly abbreviated gathering.

Thanks, as ever …

To the folks who reached out to celebrate the wedding of Chip and me. Thanks especially to The Grinch (a pseudonym, I suspect) for a celebratory donation to MFO and, for the beautiful flowers, to Dick who, like me, has spent much of his adult life in academe.

To Sharon, whose matched contribution made the FPA Investor Day trip way more manageable … and to the FPA folks for being such exemplary hosts.

To Matthew from Bellevue, Russell of WI, Kevin, and Mark. Gracias!

And to our faithful regulars, Wilson, S&F Investment Advisors, Gregory, William, William, Stephen, Brian, David, and Doug, míle buíochas!

david's signature

To Augustana’s class of 2024: money is not your master

By David Snowball

Hi, guys.

You made it. You survived Covid and being kicked off campus midway through spring of your freshman year. You survived a year of Zoom. You survived that weird casserole the dining commons kept serving. You survived me. And, at the end of it, you were standing together, laughing and glowing. We’re incredibly proud of you and hopeful for the good you can do in the world.

I’ve never aspired to deliver a “last lecture” for graduates, but you might consider this as my last advice before you sail too far from the safe harbor we’ve offered. Here’s the gist of it:

Do not let money rule your life. Money is just a tool to help you live a life that will make you feel engaged, secure, and satisfied. Money is not the object of life. Don’t obsess about it.

That has two parts: (1) live a conscious, frugal life. Buy what you need, not what you want. Spend money on experiences and time with friends. And (2) use reasonable frugality as a way to build security. That is, in the long term, you’re better off spending a little less and putting aside a little more because, when push comes to shove, your needs will be modest, and your resources will be rich.

Let me walk you through that.

A young investor has one great enemy: inflation.

We often think of inflation’s concrete, daily manifestations: a medium latte (they can call it “grande” if they want, but it’s “medium”) is four bucks, and a “one pound can of Folgers” now weighs 9.6 ounces. As if to reassure you, Cheerios now comes in MEGA SIZE (21.7 ounces), GIANT-SIZE (20 ounces), FAMILY SIZE (18 ounces – don’t blame me, the all-caps thing is their idea), LARGE SIZE (12 ounces) and, I guess, regular size (8.9 ounces). Regular translates to six wimpy bowls of cereal.

For an investor, inflation is an insidious enemy that chews your savings to bits. Inflation sits at about 3%. Deposit $100 in a savings account today (once you get past the teaser rates and asterisks, banks pay 0.05% on savings today), and it will buy $75 worth of stuff in 10 years. $56 worth of stuff in 20.

A young investor has one great ally: time.

The American economy and its stock market have grown relentlessly for 150 years. In the short term, there are horrifying setbacks. In the medium term, there are flat periods. But in the long term, there’s relentless growth, after inflation is accounted for, of about 8% per year. Here’s what that looks like: if you just put $100 into the market and walk away, then what happens if you budget $100 a month forever?

Starting value of $100 Inflation-adjusted return Real return if you add $100 / month
10 years later $215 18,300
20 years later 466 57,700
30 years later 1006 142,300
40 years later 2176 326,000

“Real return” is the amount you have after accounting for the effects of inflation. Your “nominal return” is the amount you’d see on your brokerage statement. At the end of 40 years, your account would have $564,000, but that would buy the equivalent then of having $326,000 today.

By the way, $100 in a savings account for 40 years leaves you with $30 in spending power. Add $100 a month to that savings account, and at 3% inflation, you’d end up with $14,900 in buying power.

For visual learners, here’s the combination of starting early, chipping in monthly, and making purely ordinary returns in the stock market.

Yes, I know. Student loans. New apartment. Work clothes. Here’s your plan: you’ll get serious about investing in 10 years when you’ve paid off your loans and such. Here’s the price of surrendering ten years to inflation:

Start now: end with $326,000

Start in 10 years: end with $142,000

Start now, and it takes $100/month to hit $326,000 in 40 years. Starting in 10 years, it will take $220 a month for the next 30 years. Start now, and $48,000 in lifetime contributions will get you $326,000 in real returns. Wait a decade, and it will take $84,000 to get you there.

Can you imagine how happy you’d be to one day look in a shoebox under the bed and discover $564,000 in it? That’s what you’re capable of.

Don’t wait.

The three-step plan

    1. Avoid stupid consumption.

      You know this is my specialty (Comm 240 / Advertising and Consumer Culture for the past 30 years) and my passion. Collectively, marketers and advertisers in the US spend about $500 billion a year trying to get you to buy s**t you don’t need. Here’s the ugly truth: if you actually needed it, they wouldn’t have to spend a half trillion dollars to motivate you.

      Do not buy from Shein. Their stuff is designed to last only two or three uses before being landfilled. The average Shein shopper spends… wait for it! $100 a month on disposable clothing on that site.

      Do not subscribe to Amazon Prime. The cost keeps going up, and they’re playing danged intrusive ads on their movies. Amazon Prime tricks you into impulse purchases you’d never make if you had to pay a reasonable shipping fee. The average Amazon Prime subscriber spends $1400 a year at Amazon, more than twice what other people do. Including the Prime fee, you’re likely to sink $1550 a year into the Bezos Machine. Don’t.

      Do not buy a high-end cell phone. We both know that you hate being addicted to them. That’s $1599 to have your life sucked away, pixel by pixel. You’d enjoy life a lot more with a flip phone/dumb phone/feature phone at $90. If your phone is sufficiently boring, you might be forced to, you know, stop phubbing, meet people and talk with them. And, who knows, maybe have sex? 35% of smartphone users admit that their love lives have sort of … shriveled.

      Do not buy an SUV. Ever. SUVs and the things that used to be pickup trucks are 80% of new car sales in the US. They are huge, unwieldy, unsafe, and crazy expensive. They average $38,000 … and that’s before you factor in loan payments. The profit margin on an SUV is five times greater than on a car. They’re selling you a fantasy about domination and freedom and nature. Dude, you’re just going to the mall. Upgrade your fantasies, downgrade your vehicle.

      Do not buy a new car. Ever. Nothing falls faster in value than a new car. The average price of a new Camry (my car) is $30,000. A year-old Camry runs $25,000. A two-year-old is around $23,000. With reasonable care, a Camry lasts 12-15 years. If your car loan is 48 months, you get 8-11 years without a car payment.

      Don’t default to living in a trendy city. Much of America’s housing crisis is driven by the insistence that you really, really, really want to live in Phoenix (average house: $480,000, average July high: 104 degrees), Dallas ($370,000 and 97 degrees), Denver ($550,000, 84 degrees) or Chicago ($370,000, 86 degrees). Consider Green Bay ($250,000, 80 degrees), Pittsburgh ($217,000, 84 degrees) or the Quad Cities ($170,00, 86 degrees). And before you say anything silly, there are good jobs and interesting things to do there. Smaller cities tend to be more affordable, often offer a better quality of life … and many are located outside the Furnace Zone.

    2. Open a brokerage account at Schwab.

      It takes about ten minutes, a copy of your bank account information, and virtually no mental activity. Once you have an account, set it up to automatically transfer, say, $100 from your bank account to your Schwab account around the first of each month.

      Really. Ten minutes.

    3. Create a low-stress investment portfolio, then get on with life. In general, you want boring investments. Deadly dull stuff that you never need or want to look at. Interesting investments are dangerous, and exciting investments are deadly. Two reasons. First, because you’ll start looking hourly and tweaking daily and screw yourself by getting it wrong more often than you get it right. Second, because by the time you’ve learned about “the next big thing,” a million other people – including tens of thousands of predatory professionals with huge honkin’ computers and high-frequency trading algorithms – got there ahead of you and have thoroughly gamed the system.

      No memes. No crypto. No AI. No fine art.

      For the bold, an all-stock, all-the-time investment fund: GQG Global Quality Equity Fund. One of the world’s premier stock investors, Rajiv Jain, builds a portfolio of 40 exceptional companies, which he purchases only when the price is good. The fund has returned 16% a year for the past five years. Cost to open an account: $100.

      For the bold, who prefer exchange-traded funds: GMO US Quality ETF, which is the first fund for regular people offered by GMO. This ETF uses the same process used in the $10 billion, five-star GMO Quality fund, which has made 17% a year over the past five years. Two differences: the ETF only invests in the US. And the ETF does not require a $5 million minimum purchase.

      For people who really just want to start a one-stop retirement fund, Schwab Target 2060 Index. This ultra-cheap fund invests in a collection of other index funds; that is, funds that passively mirror the market rather than trying to outperform it as GQG and GMO do. It starts out by investing 95% of your money in stocks, but as retirement approaches, it becomes systematically more conservative so that you have less risk of falling victim to a stock market crash just as you were thinking of retiring. Minimum purchase: $1.

      Finally, for people who would really prefer not to lose much money along the way (stock markets periodically cause 25-60% of your investment to evaporate, which some find disquieting), FPA Crescent combines the absolute value discipline that infuses the FPA operation with the willingness to invest in any part of an attractive firm’s capital structure: common or hybrid equity, debt, loans or whatever. The team’s emphasis is buying high-quality companies plus a small set of intriguing, shorter-term opportunities as they present themselves. At base, the absolute value investors say, “We’ll only buy if we’re offering an attractive security priced with a compelling margin of safety; absent that, we’re going to wait.”The fund has returned 11% a year over the past five years with dramatically less risk than the market. Minimum investment: $100.

I have enjoyed our time together. You have made my life richer with your intensity, your silliness, your questions, and your goofs. They’ve kept me alert and cheerful. I hope these final words do something similar for you, young Jedi.

Asset Allocation & International Equities, Part I: What is the right percentage allocation?

By Devesh Shah

Introduction: “Can you improve the returns of this endowment portfolio?”

In late 2022, I became a trustee of a private school endowment and was asked to join the investment committee. The committee consisted of a dedicated group of trustees with prudent investment sense. Although there were no permanent employees to manage the investment, a number of decisions had made the job manageable. The endowment worked with a sharp financial fiduciary who advised and then carried out the committee’s decisions.

Broadly speaking, the endowment had followed David Swensen’s Yale public model. Market timing and stock picking were completely avoided. Asset Allocation, or the practice of selecting deep, broad, major asset classes was the modus operandi. The portfolio was made up of Vanguard funds invested in the Total US Equity Market, International Equities, Emerging Market Equities, Public REITS, and the Bond Market Index Portfolio. Choosing passive Vanguard funds in major asset classes kept the expenses low, made monitoring easy, and allowed the portfolio to benefit from the gradual grind-up in most assets over time. Sure, there were drawdowns when markets had a tantrum, but staying on course by not market timing avoided any panic decisions.

In addition, every two months, the financial intermediary would rebalance the portfolio and take advantage of sharp selloffs or rallies across asset classes by buying the dips and selling the rips. The portfolio was thus brought to the target allocation.

The chair of the endowment pulled me aside and said, “You write for the Mutual Fund Observer!  Is there anything you would recommend we do differently to generate higher returns?”

Allocation across asset classes: I Spy a high allocation to international equities!

Roughly, the portfolio was split up into these weights:

US Stock & some REITS US Bond International Stocks EM Stock Private REITS &  Private Credit Cash
46.0% 25.0% 18.2% 4.5% 3.2% 3.1%

Instinctively, 18.2% for International Developed Market Stocks, tracking the MSCI EAFE Index benchmark, felt too high. (MSCI EAFE translates to Morgan Stanley Capital International Europe, Australasia, and Far East Index.)  I had started with a 15% weight to this category in my own portfolio but in the last few years brought it down to 4%.

Anyone who has read David Swensen’s phenomenal book on investing, Unconventional Success (2005) has read the table he suggested as an example of asset allocation. This table had International Equities at 15% and since then, people think that the 15% number is written in stone. It’s not. Swensen’s advice was to figure out what portfolio best suits the institution’s strengths, other assets, and future liabilities. In any case, I had started, like others with the 15% allocation to international developed market equities around 2016.

Since then, I had been surprised by the lower returns generated by International stocks. I had convinced myself that it just meant there would be higher returns in the following years. But those higher returns never came (at least the passive international benchmark did not bring high returns). I had wondered why there was a return deficit.

I only had to ask because I soon found a plethora of reasons to avoid international stocks. Goldman Sachs’s Private Wealth Management has been running a long-standing theme on US Preeminence since 2009 which laid out neatly how US stocks were going to beat the pants off their international counterparts.

International stock indices had lower weighting in tech stocks (compared to the US). A higher weighting in banks and commodities. And therefore, while international indices looked very cheap on the surface, when adjusted for sector weights and compared to the US market, most of its cheapness went away.

In other words, if the Total US Stock market had the same weight across sectors as the international index, the US stock market would also look like it has a lower PE multiple.

There were other reasons to avoid international stocks. In the 1980s and ’90s, there were many currencies, and each Central Bank decided interest rate and FX policy to suit their local economies. But by the 2010s and 2020s, with the advent of the Euro, and an almost coordinated global central bank interest rate policy, the economic cycles had merged. If the US went down, so did Europe and Japan. There was little divergence in the direction of how economies fared, only scales of magnitude differed. In such a world, there is less diversification.

US companies also have a much bigger pool of managerial talent to pick from. US corporate management is more shareholder-focused. And, in the present age, a large number (perhaps, a quarter) of US companies’ revenues come from foreign countries.

These qualitative reasons were sufficient for me to admit that my 15% was too high and perhaps 5% was a better allocation to international stocks. I thought the same would apply to the endowment portfolio. Besides making these subjective points, I showed two charts to the investment committee.

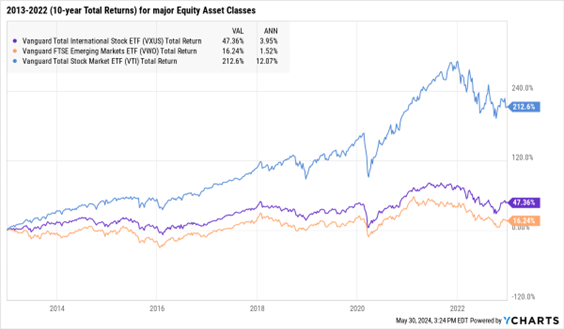
10-year Total Returns from 2013-2022

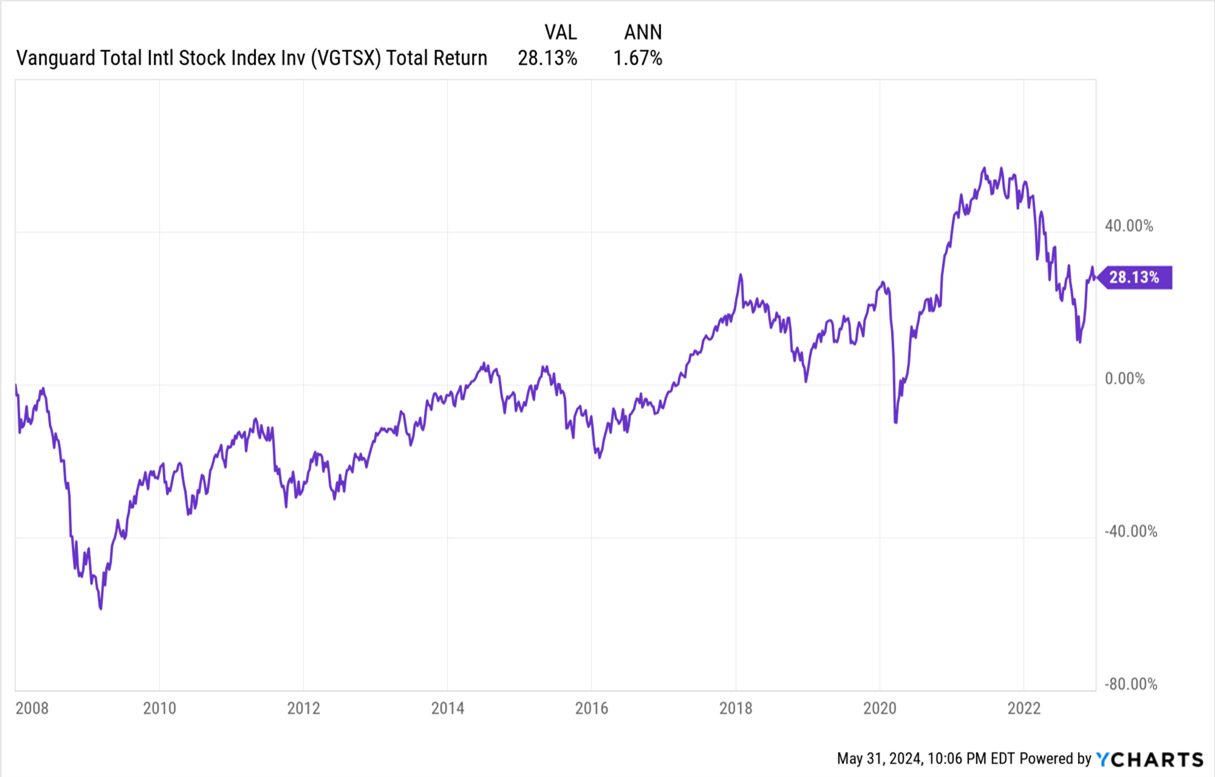
While US equities returned 12% annualized in the 10 years from 2013 to 2022, international stocks returned 4%, and emerging markets 1.5% per annum.

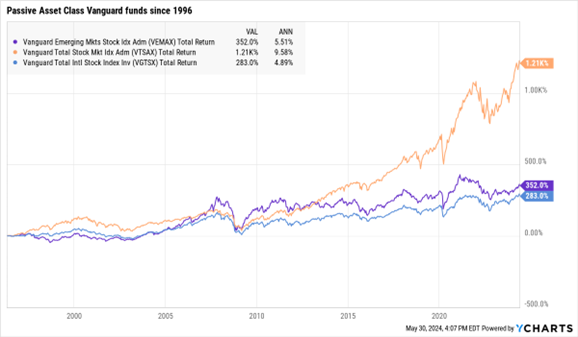
Taking the chart back to 1996, showed 9.6% for the US, 4.9% for international, and 5.5% for emerging stocks.

Looking at the data, I argued that the natural rate of return for International Developed stocks seems to be around 5% (for passively managed funds).

To which, an insightful committee member asked me, “Well, what should the international allocation be?”

“Lower than 18%,” I said, thinking I was smart. “How about half the current allocation, or about 9%”

The problem with that answer is that it’s subjective. Why 9, why not 8 or 7 or 10 or 12?

“Our investment policy requires we not be involved in market timing.”

Checkmate.

Even though we all agreed reducing international equities made sense, I needed to analyze the problem and present a better solution.

As I ate some humble pie after the committee meeting, I kept wondering how to “prove” a lower allocation made sense. It took me a few days to realize that the proof required one of Charlie Munger’s mental models: Invert, always invert.

How did the endowment decide to invest 18.2% in international stocks in the first place?

“Investment Consultants” with 10-year Forward Expected Returns

The endowment’s financial intermediary was tasked by the committee to decide an asset allocation. The intermediary worked with a third-party investment consultant (who shall remain unnamed). So called consultants, annually publish their 10-year Forward Expected Returns for every asset class.

Equipped with Expected Returns and past volatility for each asset, and correlation across assets, financial intermediaries run Monte Carlo simulations (a fancy way of saying they run thousands of sample portfolios on the computer) to determine an “Efficient Frontier” for allocating capital across portfolios.

The Expected Forward 10-year Returns, that is, from 2023 to 2032 as suggested by that investment consultant were:

  US Stocks International Stock Emerging Stocks
10-year Forward Expected Returns 6.70% 8.88% 10.80%

That seemed crazy to me! In the 28 years (since 1996) that these asset classes have been tracked by Vanguard Funds, the actual returns earned by international and emerging were HALF. How did the consultants come up with these projections?

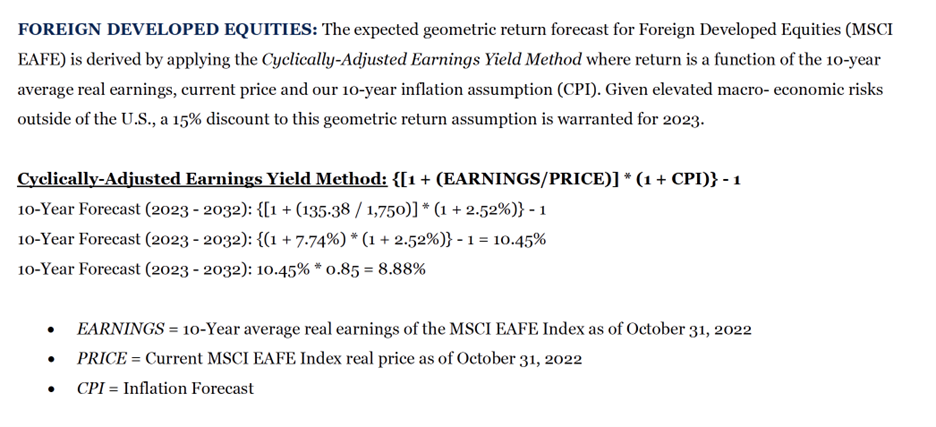
Enter the world of Cyclically Adjusted Earnings Yield. Here’s our consultant’s explanation of the game:

(I am going to leave the source out on purpose)

The formula is basically combining:

  1. MSCI EAFE earnings (last 10 years of earnings adjusted for past inflation) = 135.38
  2. prices (current as of end-2022): 1750
  3. inflation (expected forward inflation): 2.5%
  4. Foreign discount of 15%

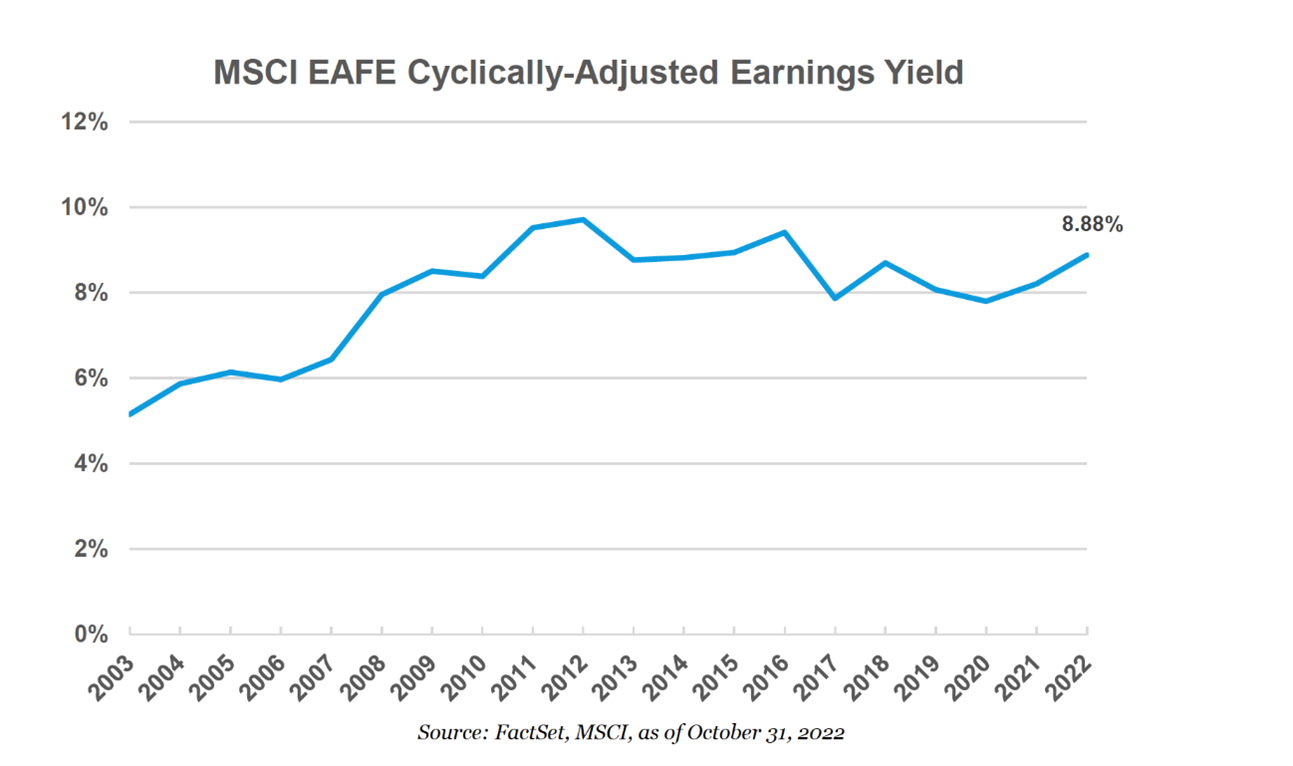
Put it all together and magic. The consultant predicts 8.88% annualized return for MSCI EAFE for the next 10 years. Put that return number along with the Expected Return numbers for the other chosen assets in a sophisticated financial model and you get a portfolio allocation!

I have a healthy respect for simple models. Much better to use a simple model I can follow than a complicated one I cannot follow. But simple better be right. In this case, it’s not.

The investment consultant has been calling for returns for MSCI EAFE between 8 and 10% since 2008.

The actual return has been 1.7%!!! There is no connection between the predictions of the investment consultant and reality. Inverting the problem reveals the (passive) Emperor has no clothes. Some actively managed funds focused on international stocks are doing much, much better. But when investment committees decide to pursue passive investing across the board, it’s because they don’t want to choose managers or stocks. This is a problem.

According to MFO Premium $1.1 Trillion dollars are invested in passively managed index funds dedicated to international equities. These are some of the biggest:

I wonder how many institutions around the country are using Forward Expected Returns of Investment Consultant to invest in these funds. 

We got this far, and we know the 18.2% is wrong, but we still don’t know what’s RIGHT.

Alternate Expectations

The big question is what “Expected Return” should be fed into a Monte Carlo model to generate our recommended asset allocation. We would use Portfolio Visualizer to crank out an Optimized Portfolio.

Let us assume the portfolio is to be made up of these three equity asset classes and the Total Bond Portfolio, just four possible asset choices, and their future volatility and cross-asset correlations will be the same as the past. We chose certain ranges for each asset class’s weights in the portfolio. Most will agree the ranges look fair for a US-based investor.

Total US Equity Portfolio 40-65%
International Developed Equities 5-20%
Emerging Market Equities 1-10%
Total Bond Portfolio 22-40%

The financial fiduciary and I came up with three scenarios:

  1. “Model 2000-2023”: Use each Equity Asset’s actual historical Returns from 2000-2022 as projection for Future Returns
  2. “Model 2013-2023”: Use each Equity asset’s historical returns from last 10 years, that is from 2013-2022.
  3. “Model Forward Looking 10-Yr”: Use the Investment Consultant’s projected model (the one we know is wrong)

THE RESULTS:

The International Equities weight using Model 1 and 2 (Historical windows) dropped to about 5%, the lower end of our chosen range. Emerging Market Equities dropped to 1%

Round Two with the Investment Committee

We presented our findings to members of the Endowment’s Committee. When we showed the formulas, and how these formulas feed into our portfolio weights, there was a collective sigh. It took only a few minutes for all of the members present to realize that Model 3 (the one we were using made no sense). The Cyclically Adjusted Earnings model was simple, but it was simply wrong.

I don’t think we argued WHY it was wrong. That’s ok. We don’t have to answer all the questions to make the right decision. We just have to have enough information in our corner to change stance. Which we did.

In the Spring of 2023, the school’s endowment committee reduced its weights of passively managed international equities to 5%. The school’s endowment committee also agreed to quickly swapping out the passive funds with active funds (hello, MFO). There are many active funds which do produce returns of 8-9% in international stocks. We would then consider re-upping the portfolio weights to an appropriate weight. It’s commendable that presented with the data, the committee changed its mind and adopted a better investment position. Intellectual flexibility is the key for investment success.

A couple of committee members asked the relevant question: Why not zero weight for international stocks? They are absolutely right in asking the question.

I had two reasons to avoid zero. First, 5% was much lower than the 18% we held earlier. We were moving in the right direction by a substantial margin. My second reason was superstition. Let’s pay the Diversification Gods 5% so our US Equity portfolio continues to chug along beautifully. I got a chuckle from the crowd.

“Devesh, you imposter.”

“Arrest me. I’ve committed a diworsification crime.”

Takeaways for the investment community

I don’t know more than anyone else what the future returns for International equity indices should be. But we know what history says. And history was clear in the returns generated by passive indices internationally. It’s low. And therefore, if you are the passive type of investor, this asset looks like one to keep at a low weight (5% or lower).

Changing Expected Returns can have a massive effect on the asset allocation. It’s worthwhile finding good active managers. As top-class Artisan International Value fund’s David Samra recently said at the fund manager’s investment conference, “Thank you for comparing my fund to a two-foot hurdle!”

ARTKX (unfortunately, a closed fund) has generated 11.7% annualized since inception. It’s probably the only international fund that’s beat the S&P 500 since its inception. Since it’s closed, we need to find other funds that are capable of generating those returns. It’s not an easy act to follow. If I could invest in international funds generating 8-12% returns, I would happily move to 20% weight for the portfolio.

Be careful accepting Efficient Frontier portfolios. Invert. Check assumptions. If you don’t know or can’t see the assumptions, maybe find something simpler to do that works.

An MFO Sidebar Story: The Twenty-Year Record: Artisan International Value and the guys eating its dust

Following Devesh’s lead, we used the MFO Premium screener to identify all of the large-cap international stocks at the top of the 20-year leaderboard. Artisan sits with a 150 bps/year advantage over the second-best performer, and it’s the only value-sensitive fund in the top tier.

  Lipper Category APR Sharpe Ratio Max drawdown Standard deviat’n Age Expense ratio
Vanguard 500 Index S&P 500 Index 9.9% 0.56 -51% 14.9 48 0.14
Artisan International Value Intl Large Value 9.3 0.49 -47 15.7 22 1.26
Vanguard International Growth Intl Large Growth 7.8 0.33 -57 19.3 43 0.42
Saturna Sextant International Intl Large Growth 7.6 0.43 -36 14.3 29 1.00
MFS International Equity Intl Large Core 7.5 0.37 -50 16.3 29 0.68
MFS International Growth A Intl Large-Cap Growth 7.2 0.35 -52 16.2 29 1.08

The only international funds to actually outperform the S&P 500 over the past 20 years? Driehaus International Small Cap Growth, Invesco International Small-Mid Company, Invesco EQV European Small Company, Fidelity Emerging Asia and … Fidelity Nordic?

FPA Queens Road Small Cap Value (QRSVX)

By David Snowball

Objective and strategy

The fund seeks capital appreciation by investing in the stocks or preferred shares of U.S. small-cap companies. The manager pursues a sort of “quality value” strategy: he seeks high-quality firms (strong balance sheets and strong management teams) whose stocks are undervalued (based, initially, on price/earnings and price-to-cash flow metrics). Because it is willing to hold companies as their market cap rises, the portfolio has about 9% invested in mid-cap stocks that it bought when they were small caps.

In general the portfolio holds 45-60 names (currently 50) and stays fully invested. That said, the manager notes that while “we like to keep the money invested, we don’t want to make bad investment decisions. If there aren’t names that meet our criteria, we will let cash build.” The fund’s current (3/31/2024) cash allocation is 10%.

Adviser

Not to Bragg … but these are the Bragg Financial folks

FPA (aka First Pacific Advisors) is the fund’s advisor, providing administration, marketing, and distribution services for the fund. As of March 31, 2024, FPA manages approximately $26 billion across multiple strategies. Independently owned FPA has 78 employees, with 21 investment professionals. They are an exceptional firm with unwavering commitments to quality, value, and their investors. In 2020, they entered into a strategic partnership with Bragg Financial Advisors.  Bragg Financial Advisors is the subadvisor, responsible for the day-to-day management of the portfolio. The firm is headquartered in Charlotte, NC. Bragg has been around since the early 1970s, provides investment services to institutions, charities, and individuals, and has about $3.4 billion in assets under management. They advise the two Queens Road funds and 1500 or so separately managed accounts. The firm is now run by the second generation of the Bragg family.

Manager

Steven Scruggs, CFA. Mr. Scruggs has worked for BFA since 2000 and manages this fund and Queens Road Value (QRSVX). That’s about it. No separate accounts, hedge funds, or other distractions. He is supported by Matt Devries, who has been with Bragg Financial since about 2016, and Benjamin Mellman, who joined the firm in 2023 after a stint with International Value Advisors.

Strategy capacity and closure

Mr. Scruggs’ rule of thumb is that the strategy could accommodate 2.5 times the market cap of the largest stock in the Russell 2000. He translates that to a soft close at about $2 billion.

Active share

95.24%.  “Active share” measures the degree to which a fund’s portfolio differs from the holdings of its benchmark portfolio. High active share indicates management which is providing a portfolio that is substantially different from, and independent of, the index. An active share of zero indicates perfect overlap with the index, 100 indicates perfect independence. The “active share” research done by Martijn Cremers and Antti Petajisto finds that only 30% of U.S. fund assets are in funds that are reasonably independent of their benchmarks (80 or above) and only a tenth of assets go to highly active managers (90 or above).

QRSVX has an active share of 96.8, which reflects a very high degree of independence from the benchmark assigned by Morningstar, the Russell 2000 Value ETF.

Management’s stake in the fund

As of the most recent Statement of Additional Information, Mr. Scruggs has invested over $1 million in each of the FPA Queens Road funds.

Opening date

June 13, 2002.

Minimum investment

$1,500 for investor class accounts, and $100,000 for the institutional share class. At Schwab, which holds about 50% of investor-class assets, the minimum investment is $100.

Expense ratio

0.96% for investor shares and 0.79% for institutional shares, on assets of $712 million.

Comments

In “The Quality Anomaly” (May 2024), we explored what’s been called “the weirdest market inefficiency in the world.” The evidence is compelling that high-quality stocks purchased at reasonable prices (Mr. Buffett’s “wonderful companies at fair prices” ideal) are about the closest thing to a free lunch in the investing world. In general, in general, the price of abnormally high returns is abnormally high volatility … except in the case of quality stocks purchased at a reasonable price (call it QARP). QARP stocks offer both higher long-term returns and lower volatility than run-of-the-mill equities. The general pattern for such portfolios is consistent: solid in normal markets, great in declining ones but laggards in rapidly rising frothy markets.

Queens Road Small Cap Value is the very model of such a portfolio, one of the most consistently successful small-cap funds of the 21st century. As a simple summary of that claim, here are the fund’s Morningstar ratings (as of 3/24/2024):

Current: Five-star rating, Gold analyst rating

Three years: Three stars, average return, low risk

Five years: Five stars, above average return, low risk

Ten years: Five stars, above average return, low risk

Overall: Five stars, above average return, low risk

The Queens Road – FPA Partnership

Despite its success, the fund remained quite small. In November 2020, Bragg Financial entered into a strategic partnership with FPA in order to provide high-quality administrative support and more sophisticated marketing. That arrangement allowed the manager to focus more exclusively on portfolio management.

This has turned out to be a happy marriage. The fund has grown dramatically in size over the past four years from about $140 million to about $710 million. Investor expenses have fallen. Turnover remains exceptionally low. Performance has remained exceptionally strong. The portfolio’s active share, a measure of independence from the index, has remained very high, which suggests that the new fund inflows have not impaired the manager’s ability to execute.

The Four Pillars

Queens Road Small Cap Value shares an investment discipline with its larger-cap sibling, Queens Road Value. The strategies for both funds are easily explained, sensible, and repeatable: buy a reasonable number of well-run companies (signaled by their strong balance sheets and management teams) when their stocks are substantially discounted (signaled by their price-to-earnings and price-to-free-cash-flow ratios). Then hold them until something substantially changes, which leads to a relatively long, relatively tax-efficient holding period. They summarize it this way:

  1. Look for companies with strong balance sheets, manageable debt, and strong free cash flow.
  2. Attempt to normalize economic earnings over full market cycles.
  3. Evaluate management’s track record of defining effective strategies and executing their stated objectives.
  4. Strive to own companies in growing industries with favorable economics.     

Because Mr. Scruggs’ view of “value” is less mechanical than many of his peers’, he tends to own some stocks that are somewhat “growthier” than average. As a result, the two major ratings services – Morningstar and Lipper – classify the fund somewhat differently. Morningstar places it in the “small value” peer group, while Lipper assigns it to “small core.”

The Performance Test

Since Mr. Scruggs targets outperformance over the full market cycle rather than trying to “win” every quarter or every year, we used the screener at MFO Premium to measure the fund’s long-term performance against both small-value and small-core peers. The fund is just over 20 years old, so we examined its 20-year record.

By every measure, across time and against both peer groups, Queens Road Small Cap Value produced competitive returns with virtually unparalleled downside protection.

QRSVX performance over 20 years, 05/2005 – 04/2024

  Small-cap value peers Small-cap core peers
Annual returns 8.0%, identical 8.0%, trails by 0.1%
# peer funds / ETFs 37 162
Sharpe ratio #4 #10
Maximum drawdown #4 #8
Ulcer Index #3 #1
Standard deviation #3 #2
Downside dev #2 #2
Down market dev #3 #2
Bear market dev #3 #2
S&P 500 downside capture 90%, #3 90%, #2

Data from Lipper Global Data Feed, calculations from MFO Premium, as of 4/30/2024

How do you read that table?

Annual returns simply measure the fund’s gains which is a bit above the average small-value fund’s and a bit below the average small-core fund’s.

Sharpe ratio weighs the gains against the risks investors were exposed to. They rank in the small-value elite and in the top tier (top 18%) of the growthier small-core group.

All of the other metrics are different ways of measuring the risks that investors were exposed to: largest decline, day-to-day volatility, downside or “bad” volatility, volatility in months when the market fell even a little, volatility in months when the market fell more than 3% and amount of the S&P 500’s losses that the fund “captured.” In each case, against both groups, QRSVX is among the elite performers.

What explains the steady outperformance?

First, Mr. Scruggs keeps his eye on the long-term drivers of returns and actively screens out the short-term noise. While he recognizes and worries about, the “severe and uncertain crisis” created by the Covid-19 pandemic and the “unprecedented” involvement in markets by central banks, he also acknowledges that we don’t know the near- or long-term economic effects of either, so neither can drive the portfolio. He remains focused on finding individual stocks that “provide a reasonable expected return and an adequate margin of safety.”

Second, he has a less mechanical view of “value” than most. He argues that the appropriate measures of a firm or industry’s valuations evolve with time. That evolution requires some rethinking of the importance of both physical capital (reflected in price-to-book ratios) and intellectual capital in assessing a firm’s value. That’s led him, he reports, to buy some value stocks that purely mechanical metrics might describe as growth stocks.

Third, he maintains a portfolio of higher-quality companies. In general, the small-cap universe is littered with junky companies: companies with limited market reach, untested business models and management, and a history of … hmm, “negative earnings.” Mr. Scruggs assiduously avoids companies that haven’t met both his quality and valuation criteria.

… we have a preference for long-term compounders that we hope to own forever. These are high-quality franchises with strong balance sheets, proven management teams, and attractive industry dynamics. Compounders don’t usually come cheap, and while we are always valuation-conscious, we are generally willing to pay a little more for higher-quality companies.

So, what do we mean by quality? At the most basic level, quality means we can have confidence that a company’s earnings and cash flows will be greater in three to five years than they are today … at the end of the day, we take a holistic look at our companies, identify their risks, try to remain conservative and judicious, and compare their current prices to our confidence in their futures.

Quality companies are good long-term investments, but they tend to lag during frothy markets – periods when investors are often checking their portfolios daily and gleefully – while excelling in down markets. The “make money by not losing money” mantra is a bit tame for some but works beautifully for long-term investors. Mr. Scruggs notes,

Historically, quality has been a large contributor to our outperformance during market downturns. Low leverage allows companies to survive and reinvest when the business cycle turns. Strong management teams can be trusted to shepherd their companies through headwinds and seek out new growth opportunities. Entrenched competitive positions and industries with favorable outlooks mean that the passage of time is our friend. In practice, it is never this easy.

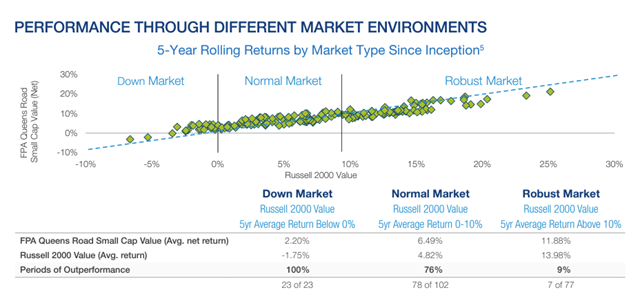
The folks at Queens Road have carefully tracked the long-term (that is, five-year rolling) performance of their fund in three different types of markets: down, normal, and robust. Below they provide both a visual representation (being above the blue line indicates above-average performance) and their batting average.

source: FPA Queens Road Small Cap Value Fund fund brochure, March 31, 2024


Bottom Line

Equity investors, wary about high valuations, untested business models, and volatile markets have cause to be more vigilant than ever about their portfolios. Queens Road Small Cap Value has a record that makes it a compelling addition to their due diligence list.

Morningstar recognizes Queens Road as a five-star fund, an assessment of their past performance, and a Gold-rated fund, a recognition offered to “strategies that they have the most conviction will outperform a relevant index, or most peers, over a market cycle.” We concur.

Fund website

FPA Queens Road Small Cap Value Fund.

Fund Family Performance for Equity ETFs

By Charles Lynn Bolin

I went on a Bucket List Adventure to Yellowstone National Park last month and stayed at the historic Old Faithful Inn built in 1904. We saw the geysers, the Grand Canyon of Yellowstone with its beautiful falls, majestic bison with their calves, powerful grizzly bears with their cubs, and a coyote crossing through a congested intersection without concern for the traffic.

The other adventure that I went on last month was to take a deeper dive into “Fund Family” performance for exchange-traded funds that invest in domestic equities, global and international equities, and emerging market equities. The concept is to invest with an asset manager that you trust in the areas where they excel with a proven track record. In this article, I focus on large- and multi-cap U.S. Equity and International equity funds that one might include as core funds in a portfolio.

This article is divided into the following sections:

Introduction to Exchange Traded Funds

According to Susan Dziubinski in “What Is an ETF? Morningstar’s ETF Guide“ at Morningstar, “The first exchange-traded fund, SPDR S&P 500 SPY, made its debut in 1993. By the end of 2021, more than $7 trillion in assets rested in ETFs… ETFs, or exchange-traded funds, are funds that trade on exchanges. Like traditional mutual funds, ETFs invest in a basket of stocks, bonds, or some combination of the two. But unlike traditional mutual funds, shares of ETFs trade on a stock exchange, such as the New York Stock Exchange.”

Ms. Dziubinski describes the advantages of ETFs over mutual funds:

  1. ETFs are easy to buy and sell—and given the fee wars in the industry, ETFs have become virtually free to buy and sell.
  2. ETFs have a reputation for being tax-efficient (somewhat true).
  3. ETFs are also known for being low cost (not always true).
  4. Because many of the most popular ETFs track widely followed and transparent indexes, there’s no mystery behind their performance: It’s usually the performance of the index minus fees.
  5. Passive ETFs have no key-person risk: If the manager leaves, another can step in without much ado.

She adds that “ETFs distribute fewer and smaller capital gains distributions because so many pursue lower-turnover, passive strategies”, and that “the ETF structure is more tax-efficient.”

The vast majority of my assets are invested in mutual funds, but I keep an eye out for opportunities among exchange-traded funds. Combining lower expense ratios and tax benefits is an incentive for Fund Families to stay competitive for investors by switching from mutual funds to ETFs. In this article, I look at fund performance which is after Fund Family expenses.

I gleaned from the Mutual Fund Observer MultiSearch Tool that there are approximately 2,687 exchange-traded funds with at least one year since the inception date. These are managed by approximately 227 Fund Families. Seventy-five percent of the ETFs are managed by just twenty-nine Fund Families, the largest of which are BlackRock, Invesco, First Trust, State Street, Innovator, Global X, Vanguard, WisdomTree, and Fidelity in descending order. The largest Fund Managers including mutual funds have eighty percent of the Assets Under Management (AUM): Vanguard, Fidelity, BlackRock, American Funds, State Street, JPMorgan, Schwab, Invesco, T Rowe Price.

As an example, by my estimates, Vanguard offers 124 mutual funds and 84 exchange-traded funds. Total Vanguard assets under management (AUM) are approximately $8.9 trillion dollars. There are twenty-one Vanguard funds which have both a mutual fund and exchange-traded fund (share classes) with a total AUM of $4.6 trillion dollars. The average expense ratio for the ETF share class of these pairs is 0.055% while the average expense ratio of the mutual fund share class is 0.18%.

Best Families for U.S. Equity ETFs

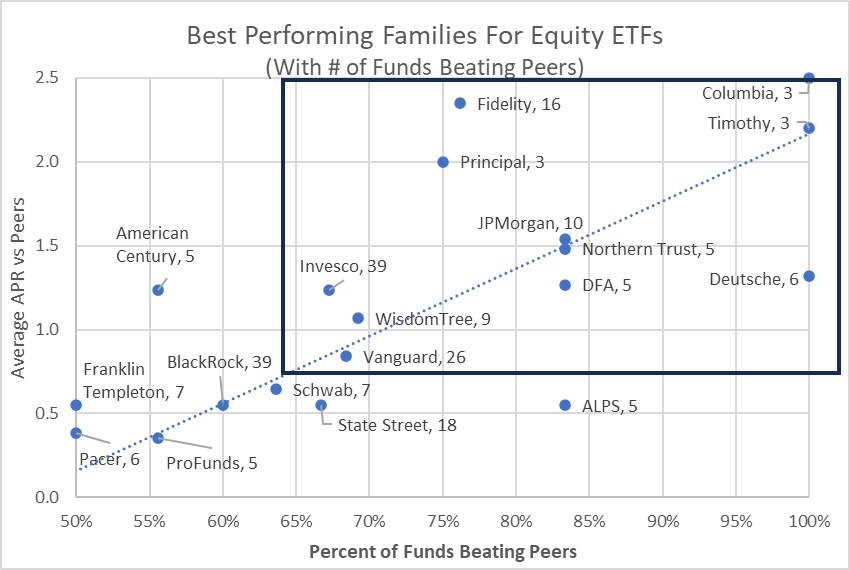
I extracted all (514) U.S. Equity ETFs excluding those using option strategies. I calculated the percentage of funds beating their peers and the average APR for each of the Fund Families over the past three-year period.  Figure #1 contains all of the Families with at least half of the funds beating their peers and with at least three ETFs beating their peers, along with an average APR vs Peers greater than zero. I consider the 19 Fund Families (20%) to be the more established, best-performing Fund Families for U.S. Equity ETFs. Those in the dark rectangle are the Fund Families that I will dig a little deeper on their performance. I consider the number of funds beating peers to be a loose measure of level of confidence. The stand out manager for U.S. Equity ETF performance is Fidelity.

Figure #1:  Best Performing Fund Families for U.S. Equity ETFs

Source: Author Using MFO Premium MultiSearch Tool

Table #1 contains US Equity ETFs in Lipper Categories with a large number of funds for comparison purposes with metrics covering the past three years. While all of the Fund Families have performed above average for the Lipper Categories, those at the top have higher average “Percent Beating Peers”, average annualized returns, and risk-adjusted returns (Martin Ratio). When narrowed to large- and Multi-Cap U.S. Equity ETFs, Fidelity and Vanguard are the dominant Fund Families while Columbia, Principal, Wisdom Tree, JP Morgan, and Northern Trust also stand out.

Table #1:  Best Performing Fund Families for U.S. Equity Large- and Multi-Cap ETFs

Source: Author Using MFO Premium database and screener

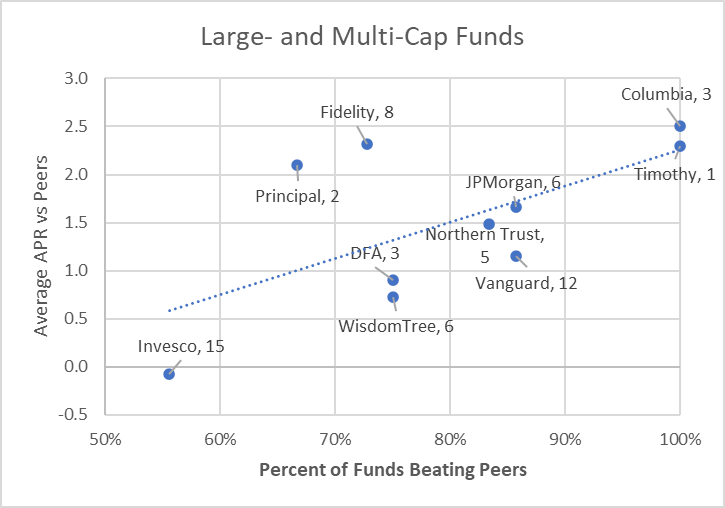
Figure #2 represents those ETFs in Large- and Multi-Cap Lipper Categories from the table above in graphical form.

Figure #2:  Best Performing Fund Families for U.S. Equity Large- & Multi-Cap ETFs

Source: Author Using MFO Premium MultiSearch Tool

Table #2 lists some of the outperforming funds while Figure #3 is a graphical representation.

Table #2:  Selected Top Performing Large- and Multi-Cap U.S. Equity ETFs

Source: Author Using MFO Premium database and screener

Figure #3:  Selected Top Performing Large- and Multi-Cap U.S. Equity ETFs

Source: Author Using MFO Premium database and screener

Best Families for International Equity ETFs

I extracted 144 Global and International Equity Funds and narrowed the list down to eleven Fund Families with International Large- and Multi-Cap that outperform their peers as shown in Table #3 and Figure #4. Of the International Equity Large- and Multi-Cap ETFs, Deutsche, New York Life, DFA, Fidelity, and Schwab have the highest performance.

Table #3:  Best Performing Fund Families for International Large- and Multi-Cap ETFs

Source: Author Using MFO Premium database and screener

Figure #4:  Best Performing Fund Families for International Large- and Multi-Cap ETFs

Source: Author Using MFO Premium database and screener

Table #4 contains example ETFs that outperform from these Fund Families with high performance in the Large- and Multi-Cap International ETF arena. Figure #5 represents the same funds in graphically.

Table #4:  Selected Top Performing Large- and Multi-Cap International Equity ETFs

Source: Author Using MFO Premium database and screener

Figure #5:  Selected Top Performing Large- and Multi-Cap International Equity ETFs

Source: Author Using MFO Premium database and screener

Best Families for Emerging Market Equity ETFs

Emerging Markets have the potential to provide higher growth, but with additional volatility. I like to invest a small percentage in diversified emerging markets excluding country-specific funds and those with below average allocations to China. I extracted a total of 40 ETFs that are invested in diversified Emerging Markets. The thirty-four best performers are spread among sixteen Fund Families. Examples of ETFs from the Fund Families are shown in Table #5 and Figure #6.

Table #5:  Selected Top Performing Emerging Market Equity ETFs

Source: Author Using MFO Premium database and screener

Figure #6:  Selected Top Performing Emerging Market Equity ETFs

Source: Author Using MFO Premium database and screener

Building a Diversified Equity Portion of a Portfolio

Table #6 shows some of the best-performing ETFs from the Fund Families and Lipper Categories discussed in this article. In general, U.S. Equity funds have performed better than International Equities, so why invest internationally? Valuations for U.S. Equity funds are much higher than International and Emerging Market Equity funds. Approximately twenty-five percent of my equity allocation is outside of North America for this reason as well as diversification.

Table #6:  Author’s Picks for the Equity Portion of a Portfolio – Three-Year Metrics

Source: Author Using MFO Premium database and screener

I created a portfolio of the above ETFs representing a hypothetical equity portion of a portfolio for the past 6.4 years using the Mutual Fund Observer Portfolio Tool. The funds are rated highly for both APR and MFO for risk-adjusted return. Four of the funds are MFO Great Owls. The portfolio would have returned nearly 10% over the past six years.

Table #7:  Author’s Example Equity Portion of a Portfolio – 6.4 Year Metrics

Source: Author Using MFO Premium database and screener

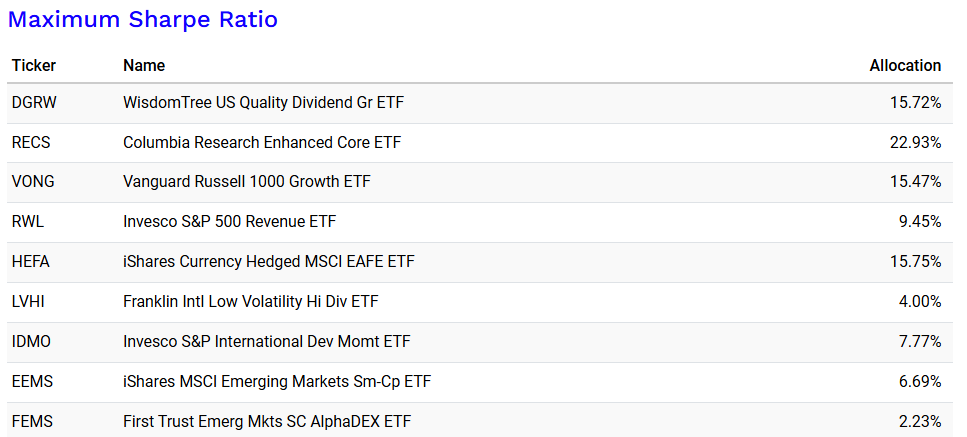
Next, I used Portfolio Visualizer Portfolio Optimization to select the funds to create an example of the equity portion of a portfolio that maximize the Sharpe Ratio (volatility-adjusted returns). The link to Portfolio Visualizer is here.

Table #8:  Example Equity Portion of a Portfolio Using Portfolio Visualizer

Source: Author Using Portfolio Visualizer Portfolio Backtest

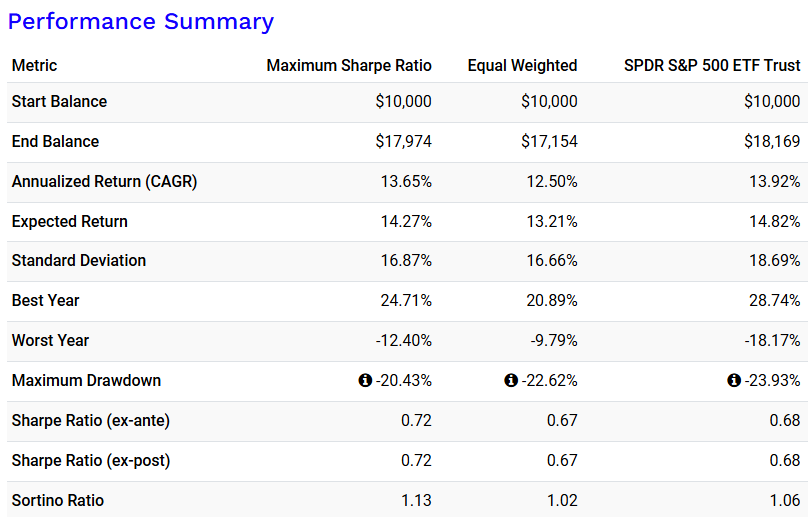
Figure #7 compares the results of the above portfolio to a portfolio with equal weights for the nine ETFs.

Figure #7:  Example Equity Portion of a Portfolio Using Portfolio Visualizer

Source: Author Using Portfolio Visualizer Portfolio Backtest

Table #9:  Example Equity Portion of a Portfolio Using Portfolio Visualizer

Source: Author Using Portfolio Visualizer Portfolio Backtest

I next compared the portfolio of funds that I selected to that I created with the assistance of Portfolio Visualizer. The link to Portfolio Visualizer’s Portfolio Backtest is here. Figure #8 is constrained by the life of Dimensional International Value ETF (DFIV). These two portfolios performed well and in a similar fashion.

Figure #8:  Author’s Equity Portfolio Compared to the Portfolio Visualizer Assisted Portfolio

Source: Author Using Portfolio Visualizer Portfolio Backtest

Review Of Author’s ETFs

The future is guaranteed to be different than the past, at least to some degree. I recommend that people consider using a Financial Advisor. I use both Fidelity and Vanguard advisory services to manage the longer-term accounts which contain more of the equity funds. Writing this article helps evaluate their strategies and to build the positions that I manage. In particular, using the Bucket Approach to include the impact of taxes lumps longer-term buy and hold equity funds together.

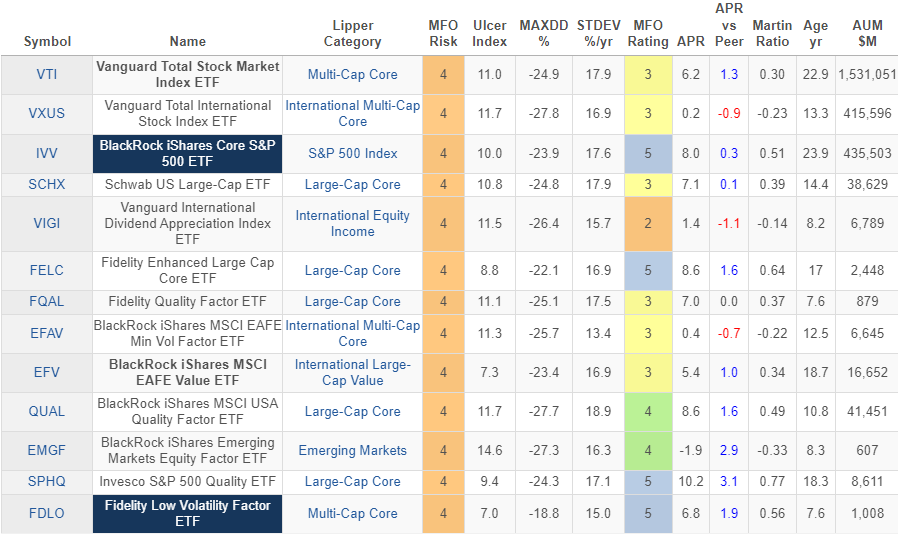
The ETFs below are the ones that either the Advisors or myself have selected for the Lipper Categories covered in this article. In addition, some serve the purpose of long-term buy and hold funds while others are intended for tax loss harvesting. I like to regularly review the funds that I own for purpose and performance. The Vanguard International Dividend Appreciation Index ETF (VIGI) is on my watch list to possibly replace if opportunities exist without creating higher taxes.

Table #10:  Metrics of ETFs Owned by the Author – Three Years

Source: Author Using MFO Premium database and screener

Closing

I own AVGE which I wrote about in “One of a Kind: American Century Avantis All Equity Markets ETF (AVGE)”, but did not discuss it in this article because of its short life and the relatively low number of ETFs in this Global Multi-Cap Core Lipper Category. Of the Global Multi-Cap Core ETFs, AVGE sits in the middle of the pack during its short 1.5-year life, outperforming its peers by 0.4 points. State Street SPDR MSCI World StrategicFactors ETF (QWLD), State Street SPDR Portfolio MSCI Global Stock Market ETF (SPGM), and Vanguard Total World Stock Index ETF (VT) have outperformed AVGE. I will continue to monitor AVGE, but have no intention of trading it based on a short evaluation period.

I retired two years ago and have been simplifying. I now spend more time volunteering for Habitat For Humanity than I spend on investments. I enjoy staying on top of industry trends and writing financial articles. I am leaving on my next adventure tomorrow to the Royal Gorge in Colorado and the historic mining district of Cripple Creek.

Briefly Noted

By TheShadow

Updates

Morningstar expresses concerns with Akre Focus (AKREX).

On March 31, 2024, this portfolio had double-digit stakes in four different stocks … Such hefty positions aren’t the only concerns here, though. The transition from firm founder Chuck Akre to younger managers and analysts has been rocky, featuring several unexpected departures. The investment team currently consists only of manager John Neff and two research analysts.

There has been a serious problem with outflows from the fund, in almost a quarter since Mr. Akre formally separated himself from day-to-day management at the end of December, 2020. Firm assets peaked in 2021 at $18 billion and now sit at $12 billion. The fund’s performance is less of a concern since manager John Neff has continued Mr. Akre’s discipline and his performance pattern: solid but not spectacular in up markets and outstanding protection in down markets. Exceptional in down markets and respectable in up markets is pretty much the story for funds that invest in higher-quality names.

DFA’s ETFs have hauled in over $33 billion over the past 12 months, while its mutual funds have had $26 billion in outflows. Umm … same portfolios, different packaging mostly.

American investors are cashing out of sustainable funds. The first quarter of 2024 saw $9 billion in outflows, according to an analysis by Axios and Morningstar. European investors, who hold $2.5 trillion of the world’s $3 trillion in sustainable fund assets, have mostly stayed the course … and, likely, why the governors in the states hardest hit by climate change (think Florida, Alabama, Texas) are the ones working hardest to deny its existence by forbidden state investments in sustainable funds.

Cinnamond Speaks. Eric Cinnamond, co-manager of the absolute value / small cap Palm Valley Capital Fund (PVCMX) posted a May 1st commentary on the markets and his portfolio. It begins by quoting Seinfeld and sparked a lively conversation on the MFO discussion board. Here is WABAC’s distillation of Cinnamond’s message:

Shorter Cinnamond: Cracker Barrel sucks. Small caps suck. Jerry and Elaine confirm it.

Another board member, yugo, helpfully added, “you forgot ‘Alcohol makes people buy stocks’.” The ensuing discussion, which is well worth following, meditated on Mr. Cinnamond’s refusal to commit to what he sees as an overvalued small-cap market and on whether people would embrace the fund if it were marketed as a small-cap balanced fund.

Hancock Speaks. A second discussion worked over recent commentary by Tom Hancock, portfolio manager of GMO US Quality Equity ETF (QLTY). The fund uses the discipline embodied in GMO’s $10 billion, five-star GMO Quality fund, though will have a slightly different mandate. Mike W notes

He is not a fan of NVDA or TSLA due to valuation concerns but does hold positions in the other Mag 7. Interesting that he has been able to keep pace with SPY since launch even without NVDA.

While the folks on the board can get a bit fiery, they’re a healthy reminder of the power of honest, evidence-driven debate. You should drop by, and drop in.

Briefly Noted . . .

BlackRock Strategic Income Opportunities Fund and BlackRock Strategic Global Bond Fund have now added shares of the iShares Bitcoin Trust to their portfolios. The funds has about $38 billion in assets between them.

Jensen Quality Growth ETF is in registration.  Total Annual Fund Operating Expenses have not been stated. The ETF will be managed by Eric Schoenstein, Robert McIver, Kirt Havnaer (portfolio manager),  Allen Bond, Kevin Walkusk and Adam Calamar.

T Rowe Price Technology ETF is in registration.  Expenses have not been stated.   Dominic Rizzo will be the portfolio manager.

Small Wins for Investors

The trade settlement period has decreased from T+2 business days, since 2017, to T+1 business days effective May 28. The “T+1” settlement cycle will apply to the same securities transactions covered by the “T+2” settlement cycle.  These include transactions for stocks, bonds, municipal securities, exchange-traded funds, certain mutual funds, and limited partnerships that trade on an exchange.

Closings (and related inconveniences)

On May 24, 2024, Westwood Capital Appreciation And Income Fund closed to new investors. While the filing didn’t suggest it, this might be a prelude to … something darker.

Old Wine, New Bottles

Effective July 29, 2024, the Buffalo Discovery becomes Buffalo Mid Cap Discovery Fund. Mid-capness follows.

Effective June 10, 2024, the fund name of the Eagle MLP Strategy Fund (the “Fund”) is changed to Eagle Energy Infrastructure Fund. 

On May 14, 2014, Amplify International Enhanced Dividend Income ETF was rechristened Amplify CWP International Enhanced Dividend Income ETF. “Capital Wealth Planning,” if you care. They also added Seymour Asset Management as a third subadviser with CWP and Penserra.

Knowledge Leaders Developed World ETF has become AXS Knowledge Leaders ETF.

On June 24, 2024, Metropolitan West Flexible Income Fund has been reorganized with and into TCW Flexible Income ETF.

TCW Artificial Intelligence Equity and TCW New America Funds have been converted into ETFs. TCW Artificial Intelligence Equity has been converted into the TCW Artificial Intelligence ETF; the TCW New America Fund has been converted into the TCW Compounders ETF; both of which are actively managed.  

Off to the Dustbin of History

On or about June 21, 2024, abrdn Emerging Markets Sustainable Leaders Fund will be merged into abrdn Emerging Markets ex-China Fund.

On August 23, 2024, Clearbridge All Cap Value and Small Cap Value Funds will be reorganized into ClearBridge Value Fund. The disappearing funds will close on June 24, 2024.

Frontier HyperiUS Global Equity Fund will be liquidated on or about June 10.

In a sort of two-for-one swap, four Guggenheim funds will become two New Age (really?) funds at some point in the third quarter of 2024. Guggenheim Large Cap Value Fund, Guggenheim RBP Large-Cap Defensive Fund, Guggenheim RBP Dividend Fund, and Guggenheim RBP Large-Cap Value Fund collectively become New Age Alpha Large Cap Value Fund if shareholders (sheep) approve. Guggenheim Directional Allocation Fund will become New Age Alpha Allocation Fund.

The KL Allocation Fund is being merged into the (utterly and completely unrelated) AXS Astoria Inflation Sensitive ETF. Founding manager Steven Vanelli gets demoted from The Guy to “participating in the Acquired Fund’s investment committee.”

Effective immediately, the Lebenthal Ultra Short Tax-Free Income Fund, the last remnant of Centaur Mutual Funds Trust, has closed and will be liquidated on July 10, 2024.

Silk Invest New Horizons Frontier Fund has closed and will be liquidated on June 27, 2024. The fund, which targets smaller companies primarily in the Middle East, North Africa, Sub Saharan Africa (SSA), Frontier Asia, and Latin America, X, has been underwater since its inception in 2016.

Templeton International Climate Change Fund will be liquidated on or about August 9, 2024. It’s a market story rather than a performance story. The fund launched in 2022 and has handily outperformed its peers but it has drawn just $3 million in assets, none of which comes from its managers. The European version of the fund, by comparison, has also handily outperformed its peers … and has drawn €1.4 billion in assets.

Terra Firma US Concentrated Realty Equity Fund will be liquidated on or about June 28.

Teucrium AiLA Long-Short Base Metals Strategy ETF is expected to cease operations, liquidate its assets, and distribute the liquidation proceeds to shareholders on or about June 6, 2024.