A post on our Discussion Board recently called attention to two Closed End Funds: Barings Corporate Investors (MCI) and Barings Participation Investors (MPV).
Investopedia describes a closed-end fund as “a type of mutual fund that issues a fixed number of shares through one initial public offering (IPO) to raise capital for its initial investments. Its shares can then be bought and sold on a stock exchange, but no new shares will be created, and no new money will flow into the fund.”
This structure means CEFs can trade at a premium or discount to their net asset value (NAV). The post noted that both MPV and MCI were long-term Great Owl funds, which means they have consistently produced top risk-adjusted returns in their peer group, specifically the Martin Ratio, which is proportional to return over drawdown or “gain over pain.” Martin Ratio is the basis for our MFO Rating.
MFO Premium uses NAV for all risk and return metrics, including the determination of Great Owls, and other designations like Three Alarm funds. Morningstar ratings too are NAV-based. With today’s December update, which reflects ratings through month-ending November, a very good month for US equity funds, users will be able to obtain price-based metrics and ratings, which I find particularly insightful. The metrics apply to CEFs, exchange traded funds (ETFs), and exchange traded notes (ETNs). Typically, open-ended funds trade only once per day at the fund’s NAV. But CEFs, ETFs, and ETNs can trade on an exchange at a premium or discount to their NAVs. Any differences are typically small and short-lived for the latter two vehicles, because of arbitrage during share creation or redemption.
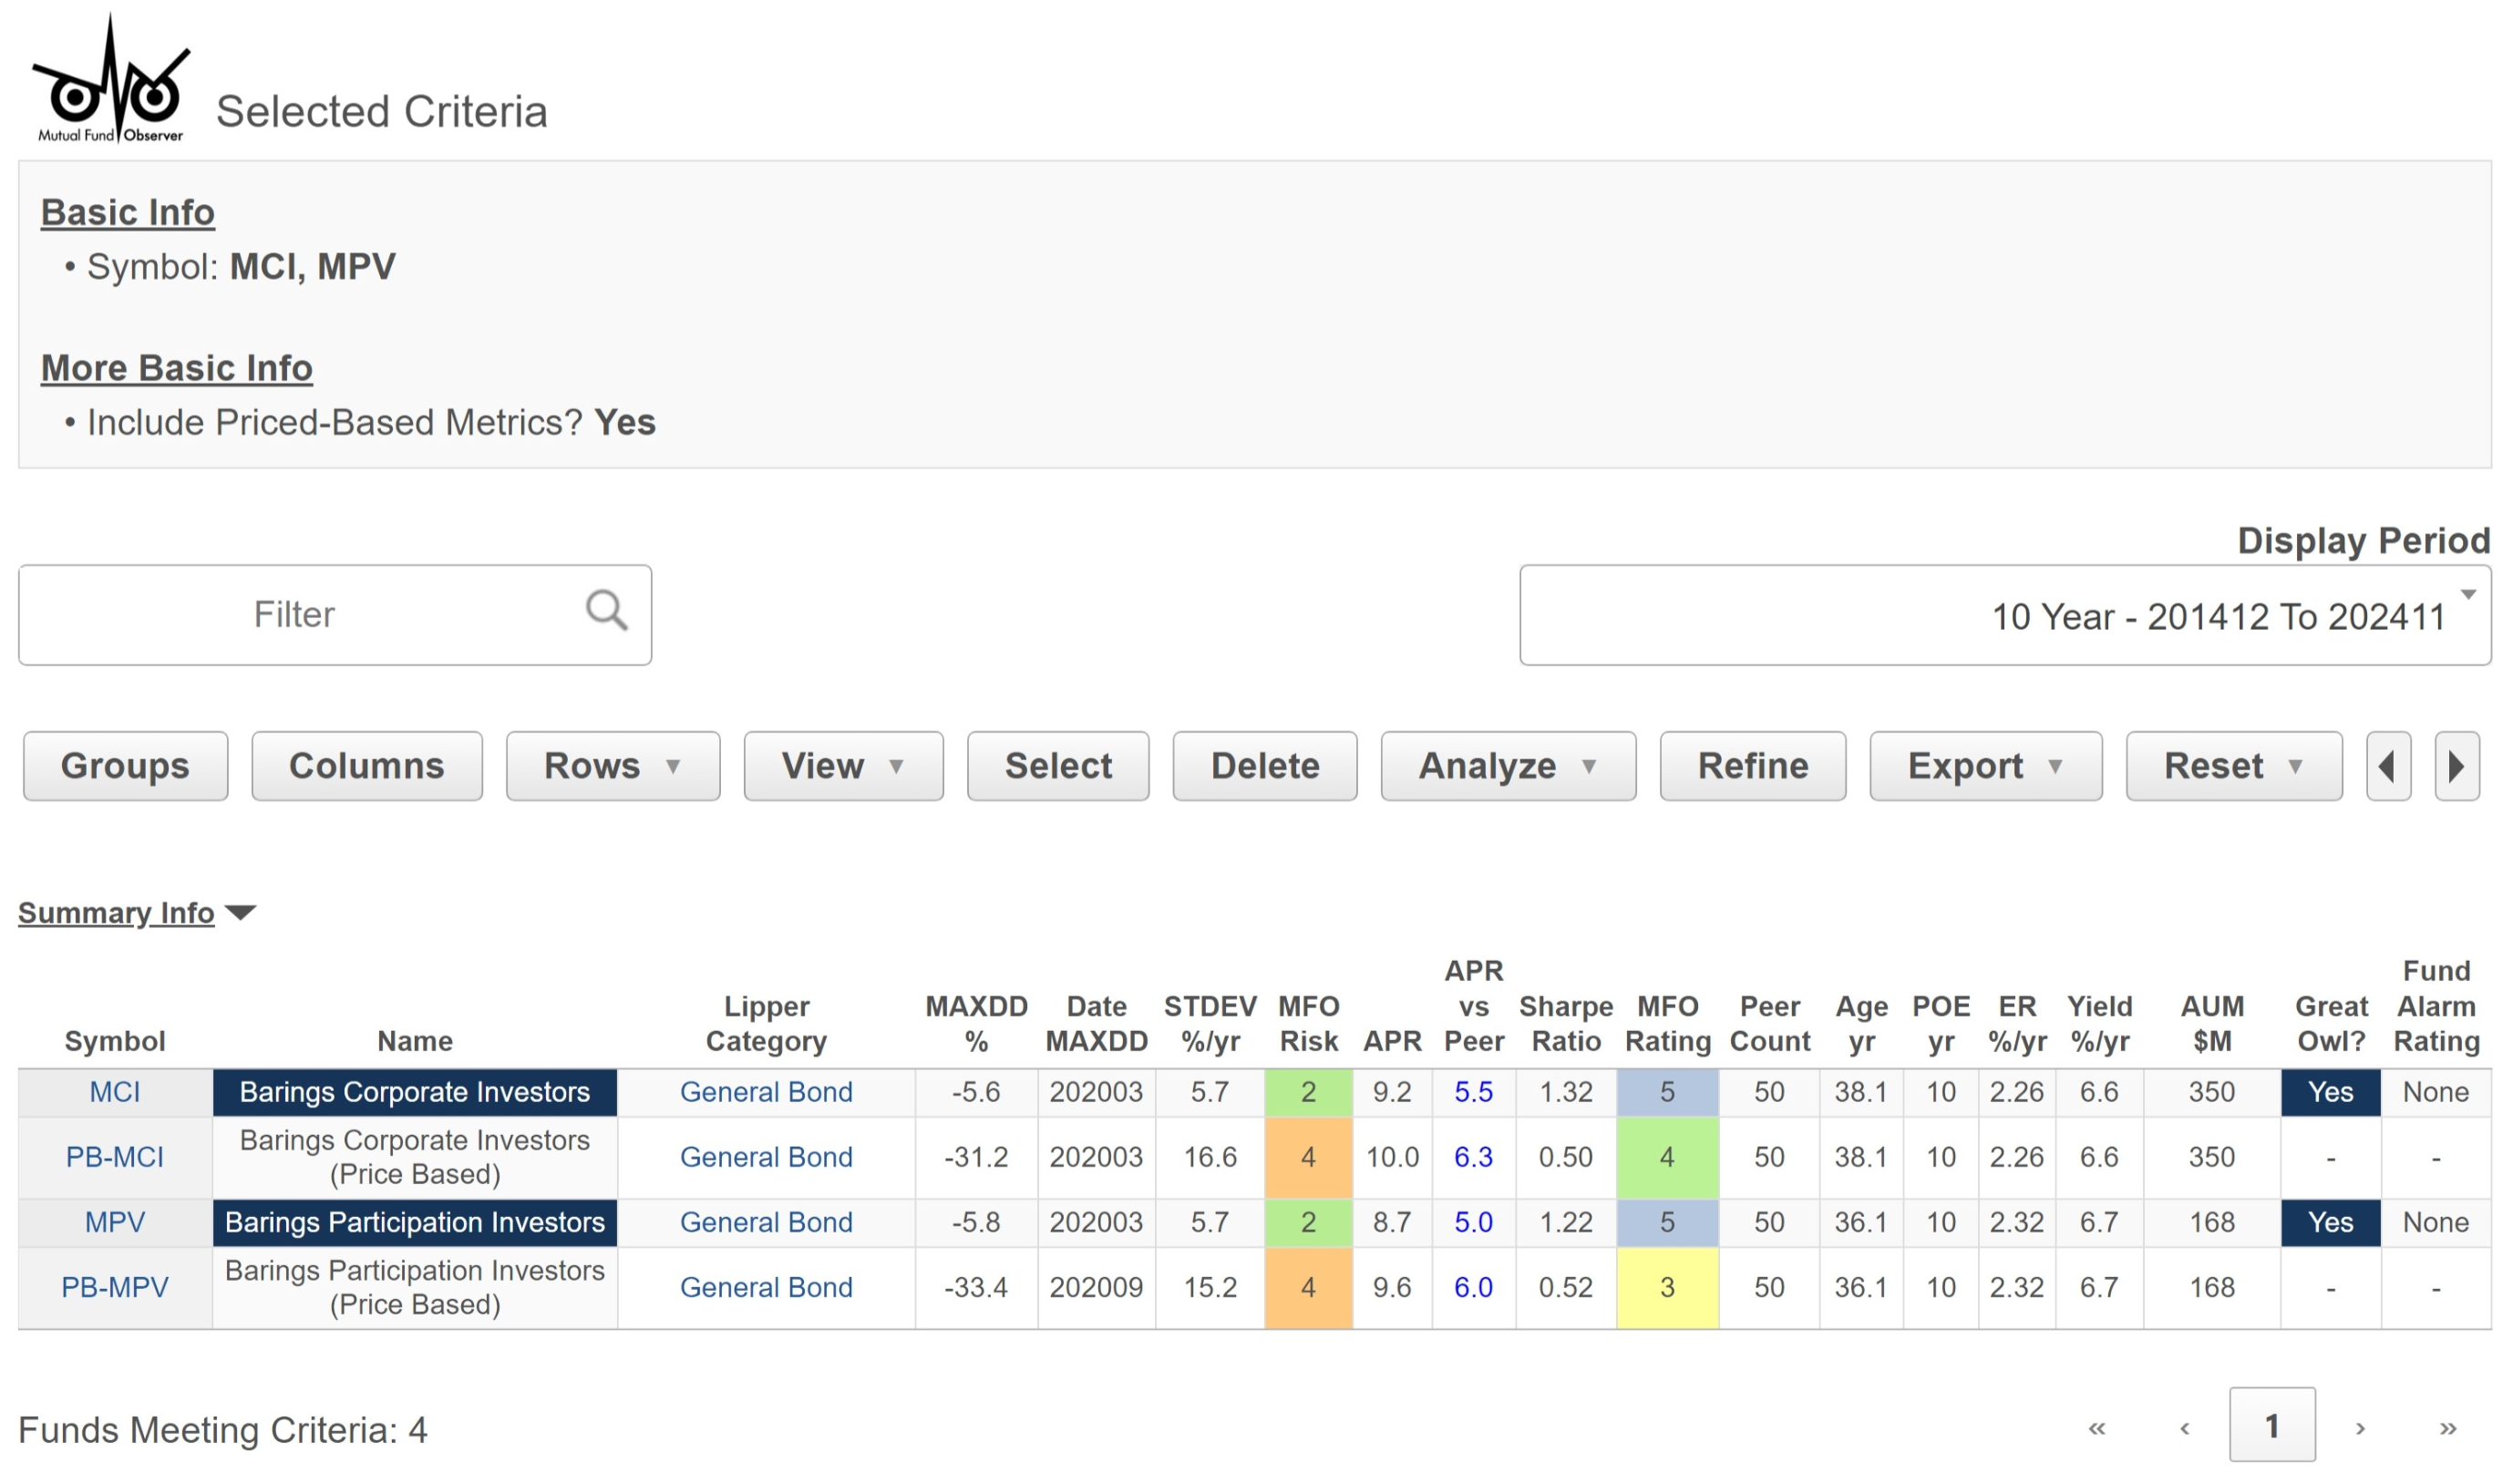
The MultiSearch table below shows the 10-year risk and return metrics for both MCI and MPV, plus their price-based companions, designated PB-MCI and PB-MPV, respectively, short for Price Based. Users can enter the companion ticker directly or simply click “Include Price-Based Metrics” during search criteria selection.
Comparison Table of NAV-Based versus Price-Based Metrics
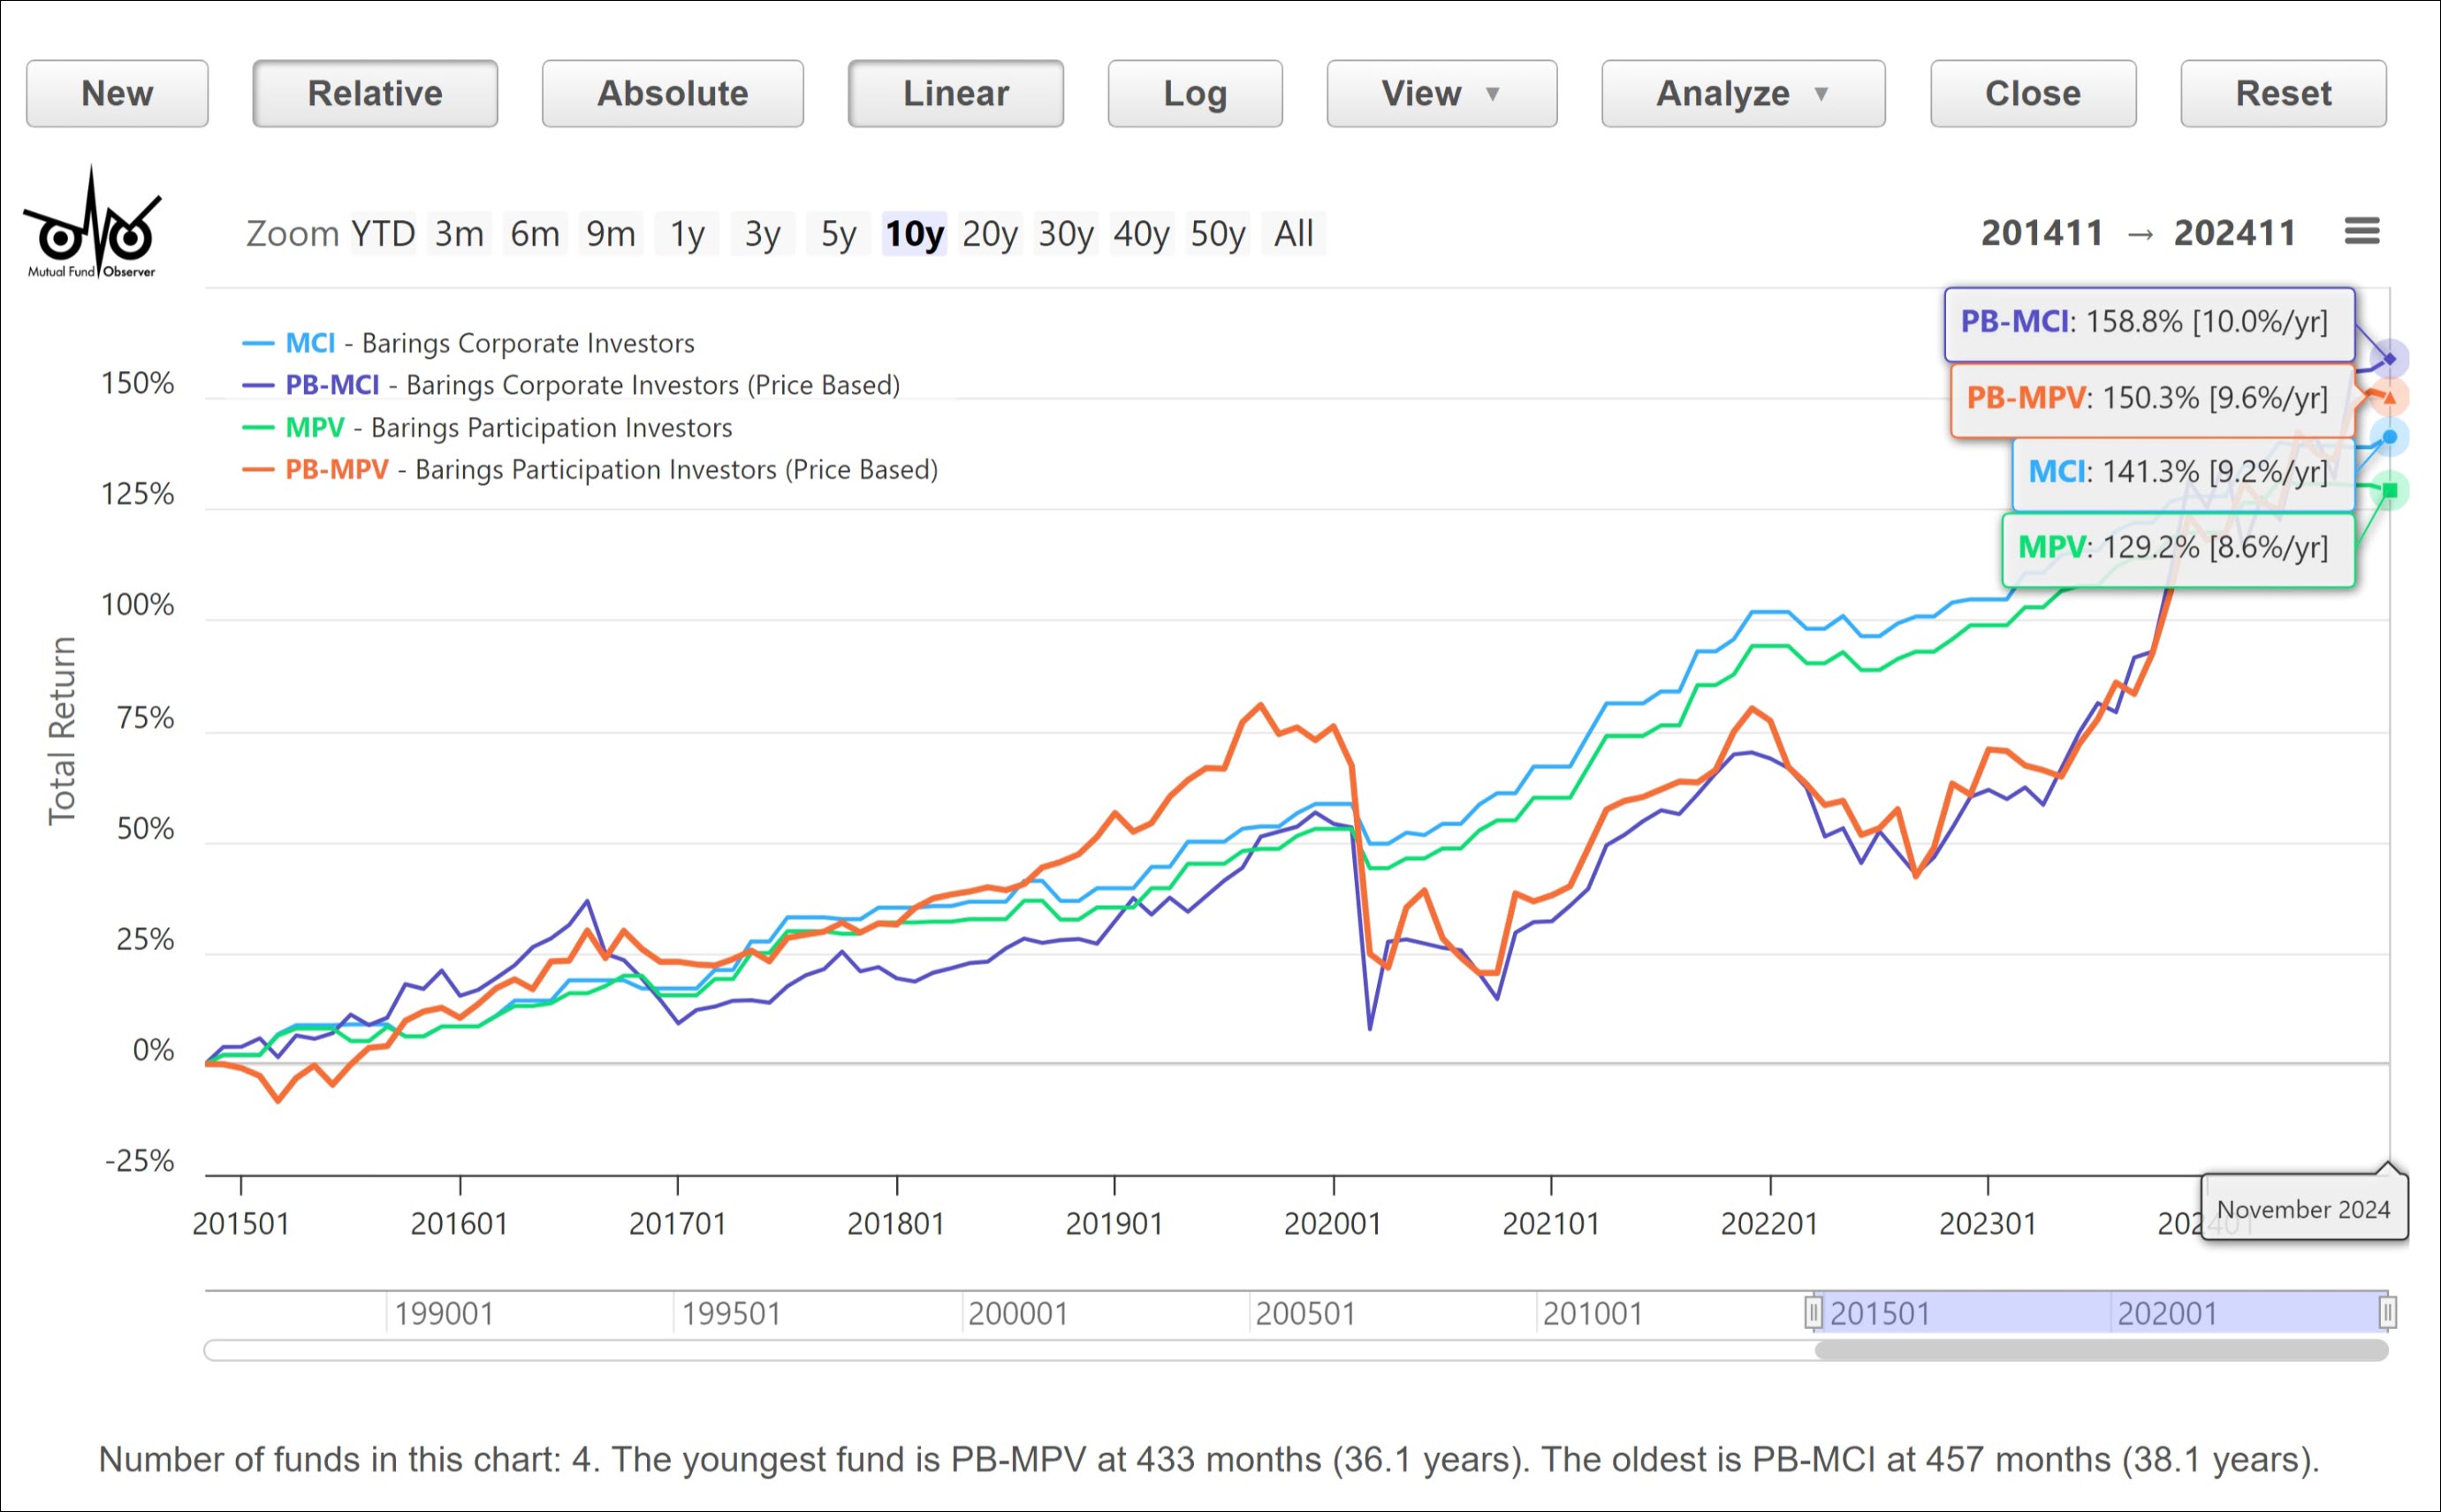
The priced-based metrics show significantly more volatile returns than the NAV-based. Part of what contributes to the difference is that Barings updates the NAV for these funds not each day or month, but more like each quarter, typically. The plot below depicts the increased volatility well. Using price alone, neither fund would be a Great Owl; that said, over the long run, the absolute returns converge, which if “one treats this as a long-term investment,” as a board member suggested, the difference may be muted.


