
The bouncing baby Warren Edward Buffett entered the world on 30 August 1930, the only son of Laila and Howard Buffett. In celebration of this 94th birthday, I looked seriously at my portfolio … and did absolutely nothing.
That was hard, but baby Warren would have wanted it that way.
Introduction
In this article, I look back at the market lows in October 2022. I recollect how I felt, how the portfolio was doing, and the tools I used to look forward to a possibly rosy future. Then, I contemplate the current state of US bonds and stock markets. I wonder if markets are now fully valued, which might explain the higher levels of daily volatility, and occasional craziness we observed recently.
The world’s always uncertain. The world was uncertain on December 6th, 1941, we just didn’t know it. The world was uncertain on October 18th, 1987, you know, we just didn’t know it. The world was uncertain on September 10th, 2001, we just didn’t know it. The world—there’s always uncertainty. Now the question is, what do you do with your money? And if you—the one thing is if you leave it in your pocket, it’ll become worth less… (CNBC interview, 2011)
“What could I have done differently?”
I remember the day well at the beginning of October 2022. I was staring at my portfolio and other broadly diversified allocation portfolios (and funds) around mid-afternoon. Value stocks were holding up better than growth portfolios. Despite my strong concentration in large-cap value, I was still down 15% on the year. However, I distinctly remember, that some balanced portfolios were down as much as 25% on the year. The equity allocation in my portfolio had gone down from 58% to 40% on the back of some trimmings, but also a decline in nominal values.
Here is a chart of Portfolio Drawdowns of a simple 60/40 US Stock-Bond Portfolio going back almost thirty years. I used Vanguard Total Stock Market (VTSMX) for US Stocks and Vanguard Total Bond Market (VBTIX) for US Bonds.
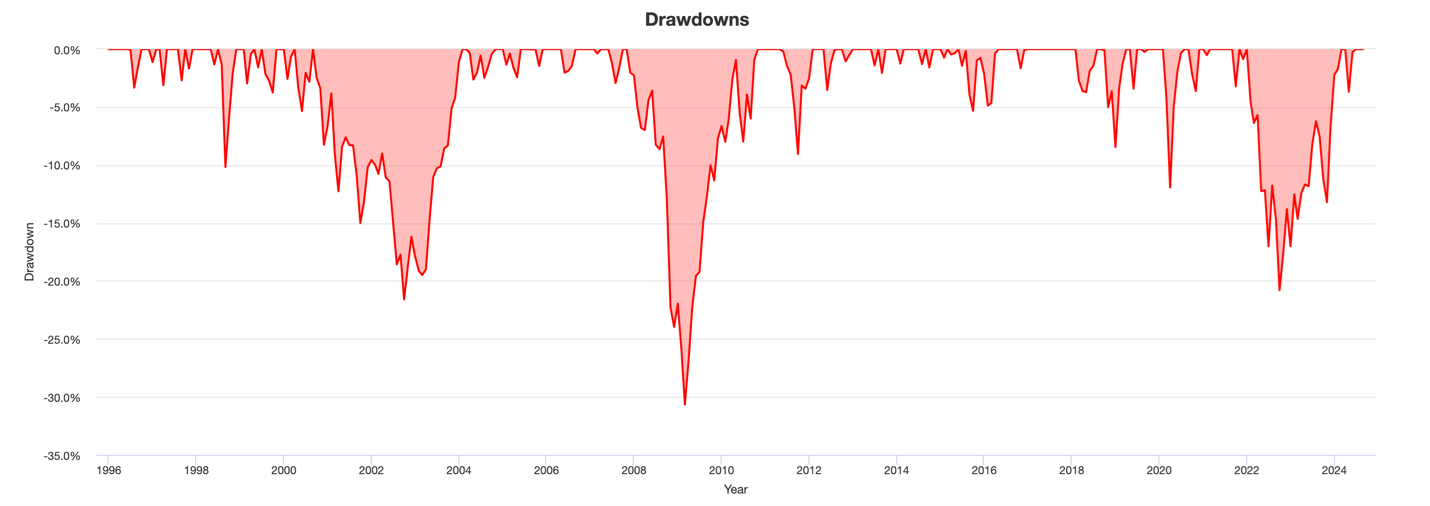
Here are the same numbers in tabular format:
| Peak Date | Trough Date | Drawdown | |
| LTCM | 1998-07 | 1998-08 | -10.17% |
| Dot com bust | 2000-08 | 2002-09 | -21.59% |
| GFC | 2007-10 | 2009-02 | -30.66% |
| USA Credit Downgrade | 2011-04 | 2011-09 | -9.05% |
| Covid | 2020-01 | 2020-03 | -11.93% |
| Inflation | 2021-12 | 2022-09 | -20.80% |
(I used Anthropic’s AI engine, Claude, to come up with this table. It was a rather frustrating experience. AI keeps getting simple drawdown numbers wrong for the same reason it cannot count the number of f’s in fluffy. The way to get AI to get the number of f’s correct is to get AI to write programming code to calculate the number of f’s. In a few years, hopefully, we won’t have to teach AI how to write code to solve simple math problems.)
No one likes their portfolio down double digits. Even though I was outperforming other balanced portfolios, I was perturbed, and kept asking myself this one question, “What could I have done differently coming into the year?”
After a lot of analysis, I concluded what many long-term investors would have always known and internalized: “There was nothing to do. Every once in a while, even a well-managed balanced portfolio is going to be down double digits.”
Accepting this outcome helped me move on. Very important to maintain investor sanity.
The next question in my mind was, “How have these portfolios performed AFTER crashing?”
What came after the crash?
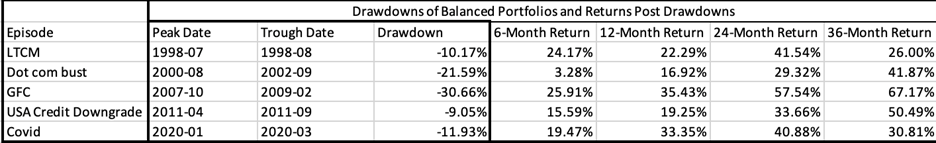
When I ran the portfolio performance six, twelve, twenty-four, and thirty-six months AFTER the crash, the returns were positive and significantly so.
(It’s possible Claude AI got some of these numbers wrong, but I tried to spot-check most of them).
During the GFC, balanced portfolios were down more than 30%. Was it possible the inflation-led 2022 selloff could get much worse? It could. And I wish I had good data from the 1970s and early 1980s when both stocks and bonds were down heavily, but Portfolio Visualizer does not have data for bonds going back then.
I convinced myself that inflation, at the end of the day, is good for nominal earnings, as long as the Federal Reserve is bent on beating inflation. The Fed was late, but not absent, in its fight.
Equipped with data from the table above, I decided it was time to go long the market. I took up my Equity allocation from the low 40s to 75%. I also bought long-dated 30-year TIPS to buy bond duration. I was right on Stocks and wrong on Bonds. The latter looked good for a few months, but inflation was still raging, and it rocked bonds badly in 2023. I learnt my lesson to invest henceforth in bonds with a duration of no more than 5 years. 30-year TIPS were too long for me.
The good news is the positive returns came. Here is the table updated to include the 2022 selloff:
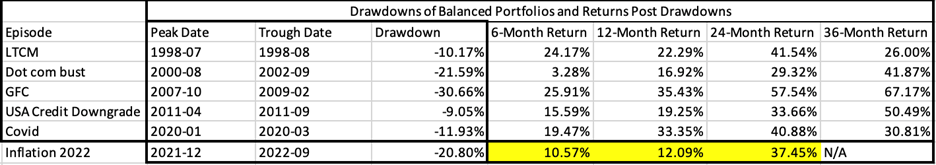
The 60-40 portfolio is up 37.5% from October 2022 to August 2024 (which I used to populate the 24-month Return in yellow above).
“Time is the friend of the wonderful company, the enemy of the mediocre” (widely attributed without a demonstrable first source, certainly consistent with WB’s investing)
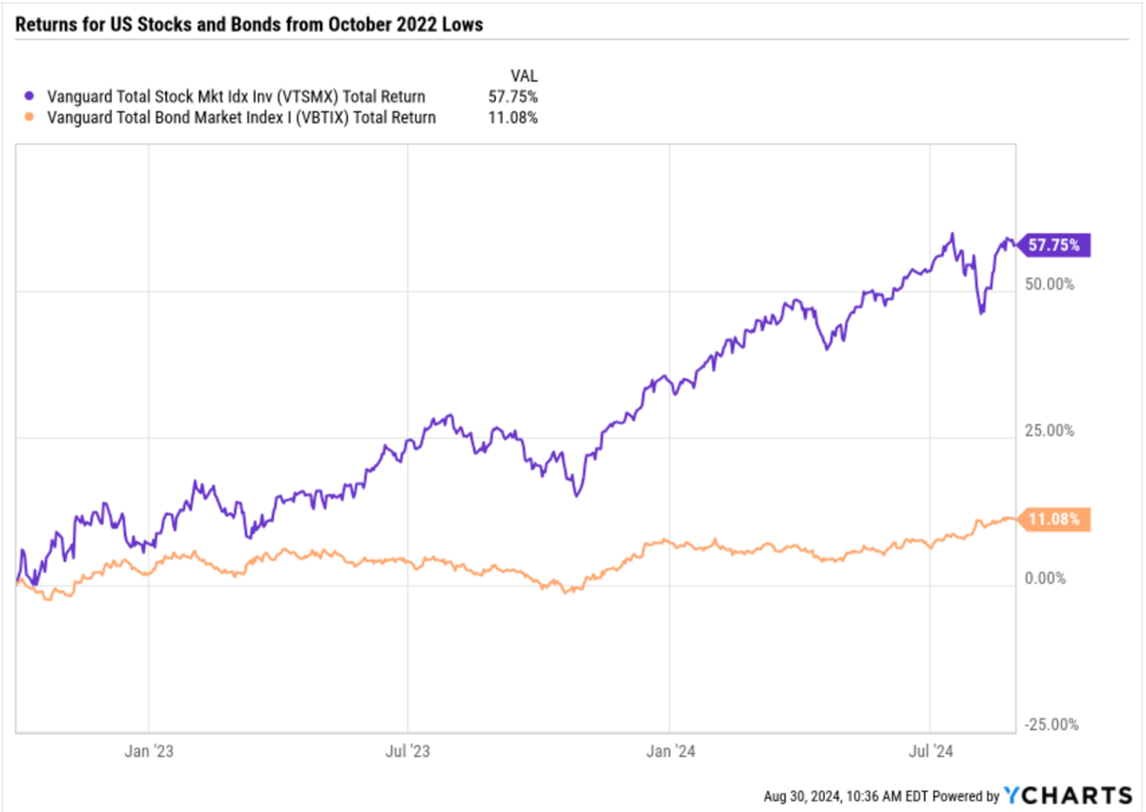
Where did the returns come from?
Almost exclusively from the stock market, with a small assist from bonds.
What does this mean for us today?
It’s all well and good to talk about what worked in the past but what investors care about is what now?
“Beware the investment activity that produces applause; the great moves are usually greeted by yawns” (Shareholder letter, 2008)
Bonds
I’ll admit I don’t like to own US Government longer duration bonds. It’s possible I was burnt by 30-year TIPS duration and now am trying to avoid getting tattooed again. After all, annualized inflation is now closer to 2% and the Federal Reserve is about to embark on an interest rate-reduction cycle.
But I take my cues from two people in the market: David Sherman, who runs the Crossing Bridge family of Bond funds, and Warren Buffett.
In his quarterly commentary, Mr. Sherman, who generally eschews making interest rate prognostication or bets, still believes that the yield curve will normalize at some point with short-dated yields being lower than longer-dated yields.
Mr. Buffett continues to hold almost $276 Billion in Treasury Bills, putting his money to work in a part of the bond curve with no duration.
It’s clear that neither of the two political parties in the US are committed to bringing the deficit down. I don’t want to finance long-dated debt for the US government or US municipalities.
Here’s a chart I revisit to not buy long-term bonds:
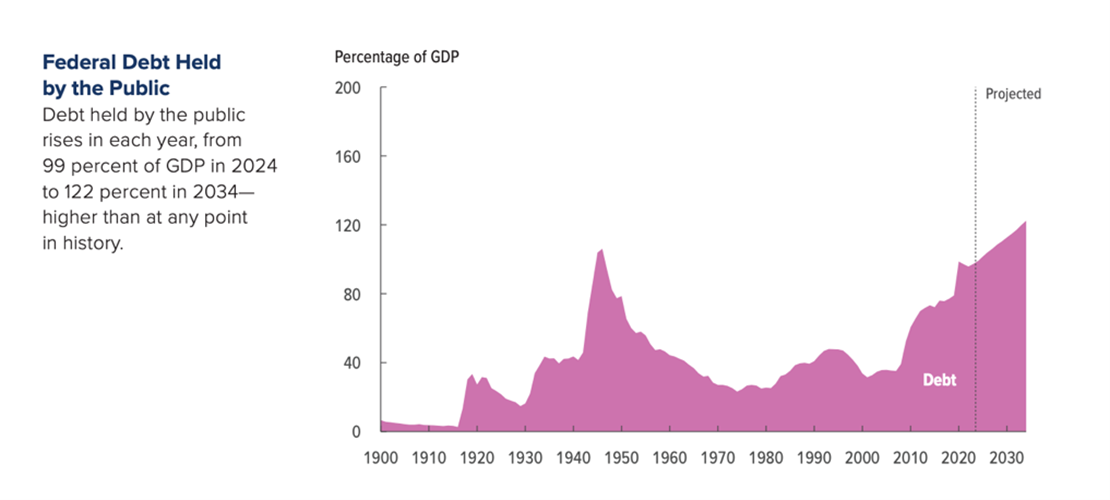
Source: US Congressional Budget Office Update to the Budget and Economic Outlook (06/2024)
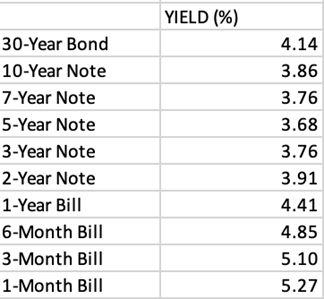
For the record, these are the US Government Bond yields as of August 30th, 2024.
Practically, disliking long-term bonds means three things to me:
One, I own T-Bills, and don’t bother with trying to “lock in” higher yields before the Federal Reserve cuts interest rates.
Two, I own some low duration, high coupon, AAA credit NY Municipal bonds for tax purposes.
Three, I like the higher yield from the short-duration high-yield bond funds. I made a list of some of the funds earlier in the year.
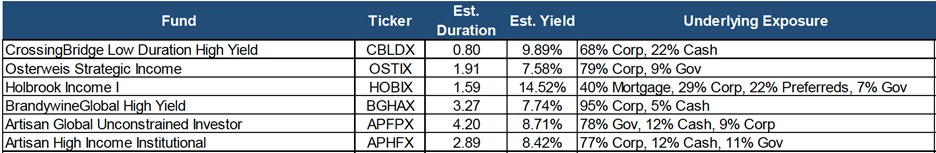
When someone smart pointed out that Holbrook’s Yield was 14.5%, I called Scott Carmack who co-manages the five-star Holbrook Income Fund (HOBIX). He was incredibly nice and both he and his co-manager, Ethan Lai, who manages Holbrook Structured Income fund (HOSIX), spent a few hours taking me through their portfolios.
HOBIX owned some B. Riley Financial Inc. paper, the company was in distress, and the bond yields had shot up 50%. Those bonds were skewing the yield for the total HOBIX portfolio.
I started investing in short-duration high-yield through David Sherman’s Crossing Bridge funds. But I wanted to diversify the holdings. So, I looked up and added other funds.
Still, I didn’t think I would be owning 50% yield to maturity bonds. That was not the high I hoped to get in high yield!
I wanted to beat Treasury Bills by investing in low-duration, “money good” paper. I wasn’t looking to crush the bond market.
I exited HOBIX and watched that the fund this year has earned similar returns to the other bond funds in my sample but with more volatility.
“What were you expecting buying High Yield?” I asked myself.
And the cheeky answer I supplied was, “I was hoping to get away with a little extra yield.”
HOBIX experience with B. Riley and the accompanied volatility was a good research exercise. The fund manager has the right to invest in messy situations.
If I don’t like the volatility of high yield, I should probably not be in High yield. Or I should be prepared to hold just one or two funds without the need to diversify across them.
Lesson learnt. I now have a sharper high-yield fund concentration.
“Predicting rain doesn’t count. Building arks does” (Shareholder letter, 2001)
Stocks
Investors have greatly benefitted from owning US stocks from October 2022. In less than two years, the S&P 500 has risen from about 3600 to 5600. Including dividends, the S&P 500 Total Return Index is up 61%, and thank you! But we care about what is next, not what we have already received.
In the depths of the brutal market meltdown of October 2022, I came across a chart from Goldman Sachs. The chart is titled: S&P 500 Total Returns After Crossing into the 9th and 10th Deciles of Valuation. It’s meant to draw the point that valuations should not be a reason to lower equity allocations.
Let me take you through this picture which says a thousand words:
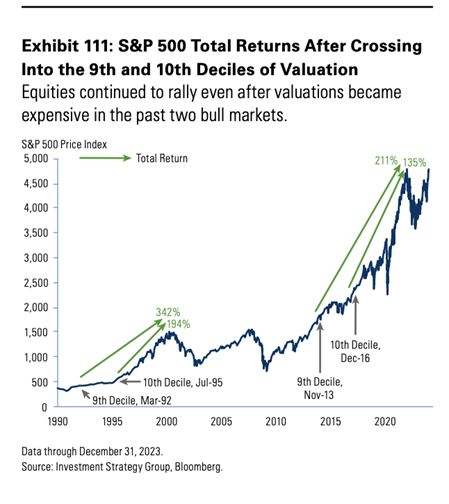
- The S&P 500 had a huge bull market in the 1990s. The market was expensive compared to earnings and other financial metrics.
- The S&P 500 entered the 9th decile of Valuation in March 1992, and the 10th, the most expensive decile, in July 1995.
- The S&P 500 kept on rallying despite the high valuations and did not peak until March 2000.
- Therefore, if we had used Valuations alone as a reason to get out of equities, we would have left a lot of money on the table. How much money?
- Starting from the months the S&P 500 entered its 9th and 10th decile to the market top in 2000, the S&P Total Return (TR), which includes dividends, rose 342% and 194% respectively.
- Bottom line: don’t worry too much about equity index valuation as long as corporate earnings are healthy, growing, and we are not in an economic recession.
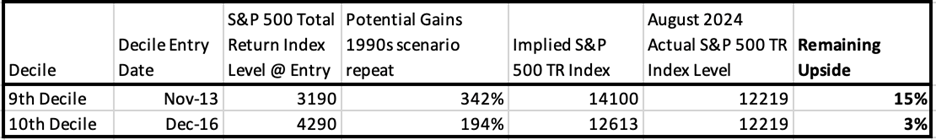
The chart picks up again when the S&P 500 bull market began in 2009. Based on Valuation metrics alone, the S&P 500 entered its 9th decile valuation in November 2013 and the 10th decile valuation in December 2016. We have already been living for the last eight years with expensive equity valuations and the market keeps rolling on. The question is how much more can we roll on if we were to replicate the 1990s market patterns?
I have updated this chart in a table for the current level of the S&P 500. I have to use the Total Return index as the Dividends become meaningful over the years.
Step by step:
- Chart says we entered 9th and 10th decile valuations in Nov 2013 and Dec 2016.
- I used the average level of the S&P 500 Total Return Index for those two months.
- I used the 342% and 194% from the 1990s 9th and 10th decile Entry to market top return numbers.
- I derived the Implied level for the S&P 500 TR Index and…
- …compared it to the Actual level of the Index as of August 2024
- The last column in bold, shows that we are at the bottom of the 9th innings in baseball analogy.
- We can expect another 3-15% increase in the stock market if the bull market history were to exactly repeat itself.
- In terms of the S&P 500, that brings us to between 5750 and 6425. Mid-way is 6087 on the S&P 500 Price Index.
If the S&P 500 reached ~6100 in a few months, the great 15-year bull market would have caught up with the other great bull market run of the 1980s and 1990s.
Since the previous bull market ended in a dot com bust, are we going to crash again this time?
At the minimum, it’s fair to say, the easy money has been made. When market valuations reach full price, volatility picks up. The mini-episode of market crash in early August when the S&P 500 dropped almost 10% and the VIX suffered an abnormal spike, might not be a one-off. We should prepare for volatility to be higher.
One may question, “Is this why Buffett is selling a lot of stocks?”
He does still own a lot of stocks, but a healthy cash buffer held in T-Bills has its place in every portfolio.
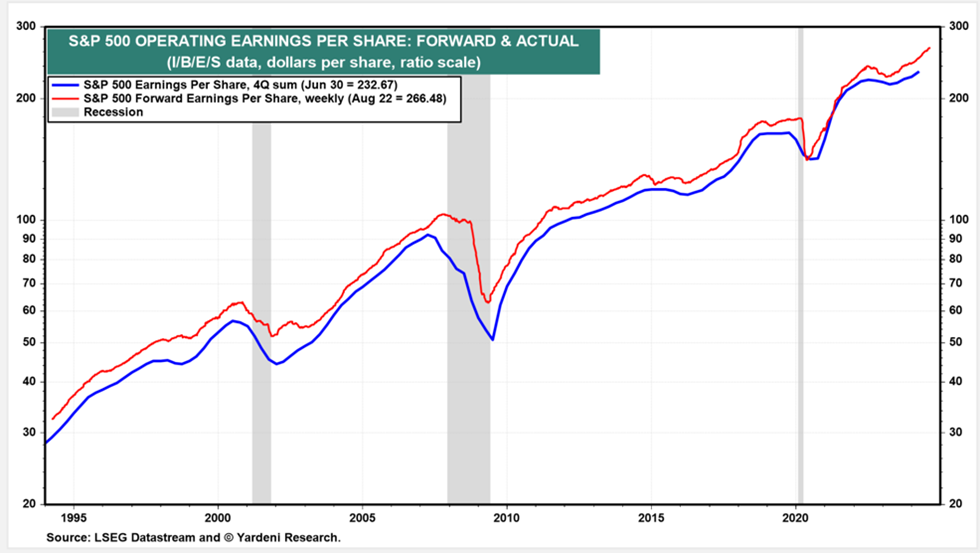
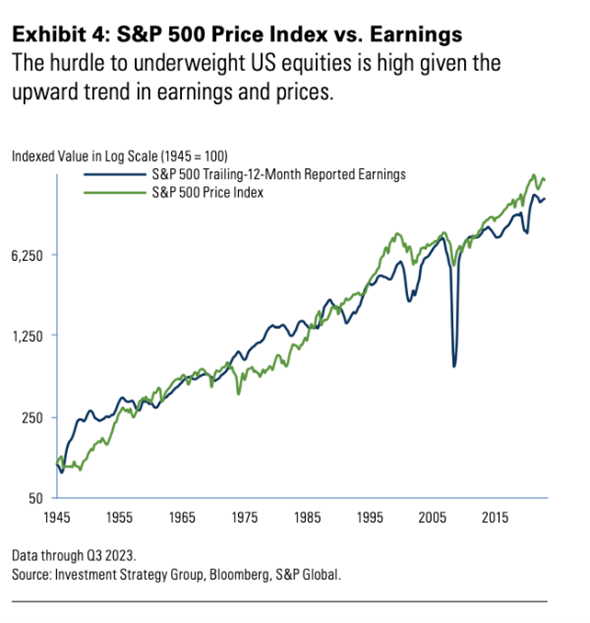
I present two other charts, with US corporate earnings.
Using Ed Yardeni research’s chart treasure trove, we see that S&P 500 Earnings per share continue their steady ascent.
Yet another chart from Goldman, from the mid-1940s to today, tells us that the S&P 500 marches with Corporate earnings.
I am not trying to hedge myself by making arguments for both sides. I am frankly nervous about the stock market here (just as I am about the bond market).
There are some who argue midcap, small-cap, international, emerging, and value stocks are cheap. I disagree. I think all stocks are more or less at the same expensive valuation. The only question now is how long the bull market will be supportive. The stock market, my friends, might not be done, but the easy money is over.
Easy money over does not equal to crash. The US economy could continue humming along. The stock market can earn its way to greater heights, but the hard work starts now.
“Margin of safety is always building a 15,000-pound bridge if you’re going to be driving a 10,000-pound truck across it.”
Conclusion
Boy, am I a party pooper!
In October 2022, when there was only the abyss, I prepped myself by looking up at forward positive returns. Those of us who sold stocks in the great bull run have come to regret it. It’s paid to be bullish equities.
In August 2024, after a wonderful two-year run, where bonds have held in and stocks have crushed it, I am forcing myself to temper my bullishness and to look at the other side – the dark and pessimistic side.
It is true that none of the other assets are good substitutes for a US stock–bond balanced portfolio. Over the summer of 2024, three months not normally known for robust investment returns, an investor in a plain vanilla, ultra-cheap 60/40 index fund would have reaped a 6.9% return.
But it is also true that the US stock-bond portfolio has given us too much of a good thing in too short of a time.