Investors and commentators have long bemoaned the catastrophic effects of a zero-interest-rate environment: a disincentive to save, distorted capital allocations, excessive risk-taking, and inflated equity prices. In winning the fight against inflation, the Federal Reserve has given investors the victory they sought: interest rates high enough to encourage saving and penalize speculation. Our question, suggested by King Pyrruhs’ catastrophic victories in 279 BCE, is: can investors survive their victory?
Theory vs. Practice: Following the path to today’s portfolio.
While a student at Yale in 1882, Benjamin Brewster unwittingly entered a debate with an early advocate of efficient markets. His interlocutor claimed, “theory and practice cannot be at variance,” and that Brewster’s disagreement counted as “a vulgar error.” Brewster then propounds a famous aphorism:
. . . a kind of haunting doubt came over me. What does his lucid explanation amount to but this, that in theory there is no difference between practice and theory, while in practice there is? (“Portfolio,” Yale Literary Magazine, October 1881 – June 1882, 202)
The thoughtful Benjamin went on to a distinguished career as a cleric and bishop of the Episcopalian Church.
This quirky phrase applies to investing very well. By now, most informed investors know what academic theory says, and in practice, we have become very good at ignoring much of it. It doesn’t matter what’s right; it only matters what we experience to be right.
In theory, non-professional, long-only investors, are supposed to diversify across all asset classes and within each asset class. In practice, most investors have decided that US Stocks are good enough for their equity investments. Global diversification, etc., is not working. However, within the US, investors have become pretty good at diversification by investing in fund portfolios (passive or active) over picking individual stocks.
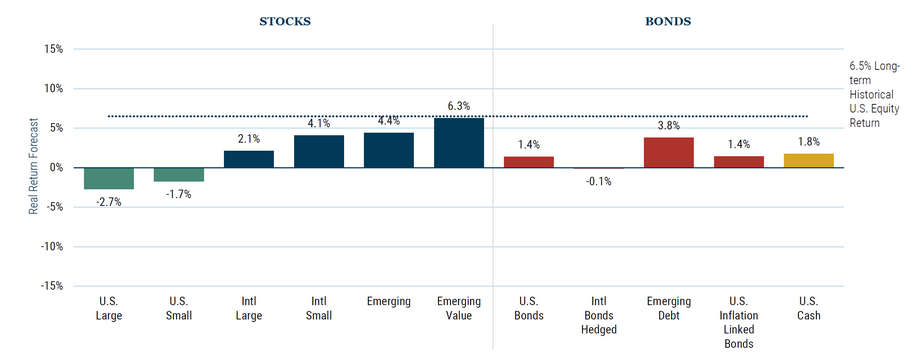
In theory, we know that money is made by buying low and selling high. Therefore, when assets that form the bedrock of our portfolios go down (think EM, bonds, International, REITS), we know we are supposed to buy into that weakness and rebalance our portfolio. Firms like GMO and Vanguard publish 7-year forecasts projecting and comparing assets that are likely to return the most and the least.
In practice, we spend exactly 7-seconds looking at these charts and analysis to confirm our biases and ignore what we don’t like. We have decided that, in practice, these long-term analysts know nothing more than we do.
We might acknowledge in the passing that some emerging markets might do well, some international stocks are very cheap, that value should beat growth over time, and that small cap should beat large cap over time, but a large number of investors have said bye-bye to all that. Enough money has been lost in actual dollars and in opportunity cost pursuing all these theoretical learnings and analysis. Most investors have voted with their wallet and don’t wish to add to the wallet of the service providers selling those products. This is not a judgment call on either the investors or the service providers, just that people have, in practice, moved on.
In theory, all investors crave the safety of principal. We would love for our principal to grow rapidly, but most of us don’t do well with volatility. Given a choice between an 8% return with lower volatility and a 12% return with 1.5x that volatility, investors may say they want the latter, but they really want the former. We divine from a combination of past volatility and current portfolio construction to make conclusions about the future and hope we are approximately right about our assessment. There are no good models that predict with any accuracy the future volatility of the market. Investors have learnt that asset allocation of the right percentage holding between stocks and safe Treasury bills might help mute that volatility and have moved in that direction.
Short-term risk-free assets is the one place where theory and practice have come together today after almost 15-16 years. We always knew it would be nice to be rewarded as savers with income, but it took the market a while to get there.
U.S. Treasury bill (aka “cash”) yields, 9/29/2023
| Annualized yield | |
| One-month T bill | 5.395% |
| Two-month T bill | 5.459 |
| Three-month T bill | 5.471 |
| Four-month T bill | 5.527 |
| Six-month T bill | 5.552 |
5.5% short-term US Government Treasury bills with no volatility is right in academia and right in practice for those who know how to save. Overnight interest rates in the United States of America, mind you, this isn’t in pesos or liras; we are talking US Dollars here, baby, are providing that return, and it’s both a heaven and hell.
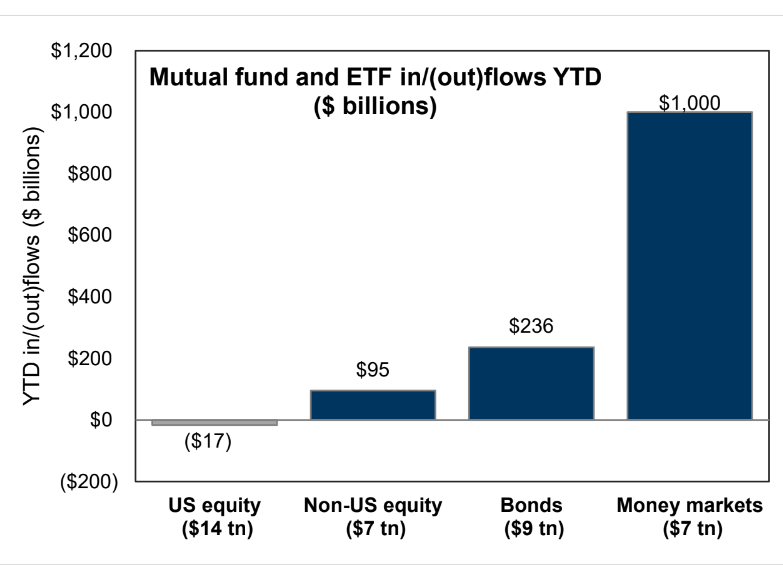
After going through “How do I ditch my bank who’s screwing me with low interest rates on my deposit,” “How do I buy the non-callable CDs,” “What’s the right way to buy T-Bills,” and “How do I know which Money Market fund to buy,” investors have figured out how to get to the 5.5% heaven. Here’s a chart from Goldman Sachs that shows the fund flows this year and makes the point. Year-to-date Money Market ETFs and mutual funds have received over $ 1 trillion in inflows.
These short-term interest rates, while a haven for savers have become (or are becoming) a very big problem for all other assets. It’s an unsurmountable battle to prove that one needs to take risks in anything else.
The State of the Long Bond Market
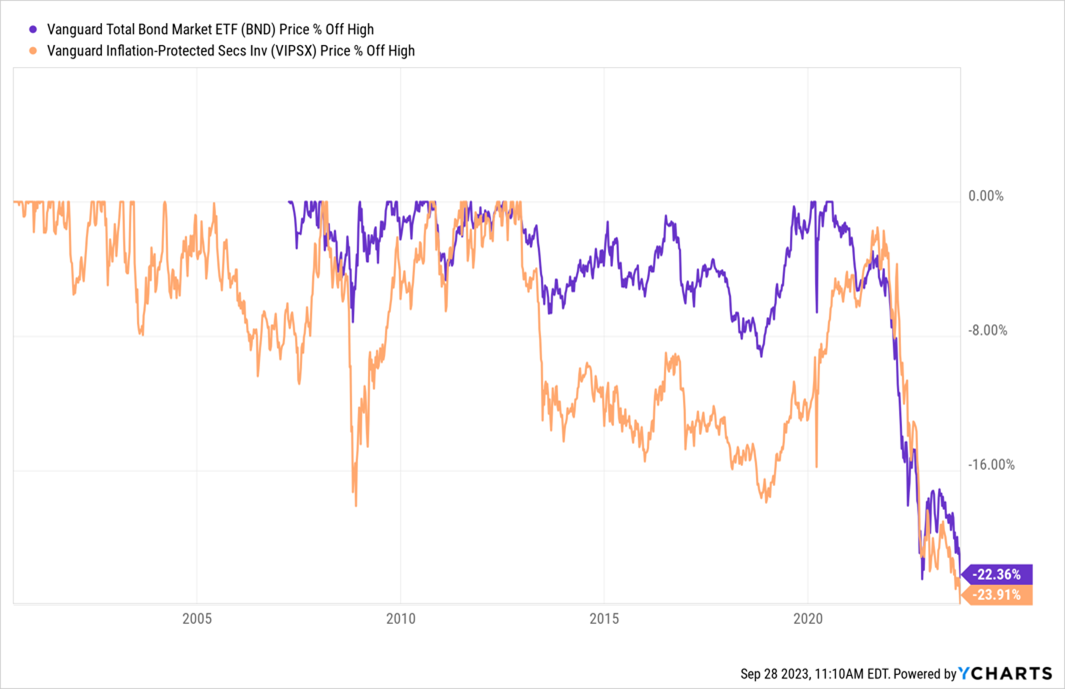
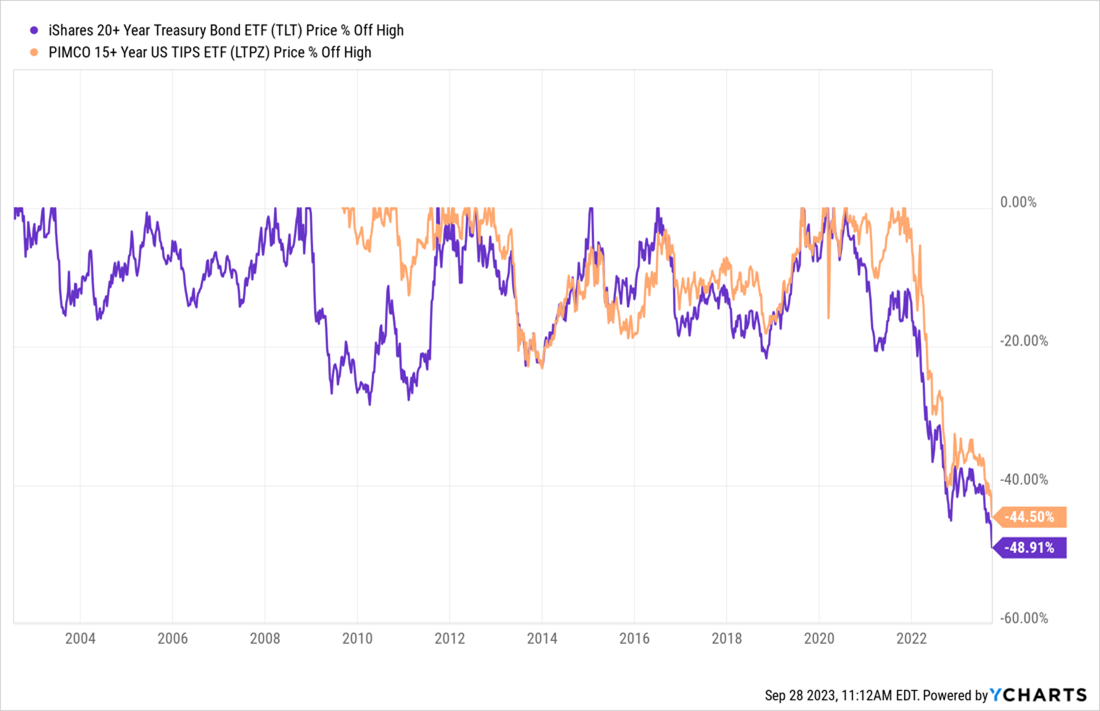
With “cash” offering high rates and zero volatility, investors are fleeing longer-dated bonds. Longer-dated Treasury Notes and Bonds are in free fall. Look at the two charts below. The first chart is the price drawdown from the peak of the Total Bond Market ETF (BND) and Vanguard Inflation-Protected Securities (VIPSX). These track broad bond indexes. Then, the second chart is the price drawdown specifically of the longer-dated bond fund, iShares 20+ Year Treasury Bond ETF (TLT), and the long-dated inflation fund, PIMCO 15+ Year US TIPS ETF (LTPZ).
The broad-based Total Bond Market ETF is down 22% in price terms since 2021. It’s one of the worst drawdowns since the 1970s (although this chart or the fund doesn’t go out that far).
The real horror story is below: in the longest-dated bonds with the highest duration. These are down between 45% and 49% in price since 2020. This year alone, the TLT is down more than 10%, and so instead of providing “fixed income,” these long-term bonds have become “fixed problems” in portfolios for all kinds of investment players.
Why has the bond market, and long bonds in particular, done so poorly?
The astronomer Carl Sagan, staring at the night sky, famously observed that there were “billions and billions” of stars. If he’d looked at the US bond market, he might well have discerned “billions and billions” of moving parts. The bond market is gigantic, with a total value of $53 trillion, larger by $7 trillion than the huge US stock market. When the asset class is so big and so deep, no one knows all of the moving parts. There is the story of the six blindfolded men who were asked to touch an elephant and guess what they were touching. A tree, a pillar, a French horn, and a broom, came the answers.
Similarly, the answers flow in for the bond market meltdown:
- the economy is no longer going to see a recession this year,
- the Japanese Central Bank has walked away from the Yield Curve Control,
- Fitch USA credit rating downgrade,
- Government shutdown,
- dysfunctional politics in the US,
- high debt to GDP ratios,
- weaponization of the US Dollar serving as a wake-up call to China’s Treasury holdings,
- reshoring and union strikes, making US inflation stickier,
and on and on. There are endless answers to the Whys of the bond market meltdown. The answers are not important because they do not help us answer the question, what would we do even if we knew exactly what was driving things? Nothing. Bonds have been used as a diversification tool, an income tool, a hedge in a recession or market crash, and they have been none of those things in the last 2-3 years.
What are the implications of a bond market meltdown?
What happens when investors with combined trillions of dollars in bonds find their value is suddenly 10 or 20% lower than before? Maybe people planned for it, maybe they didn’t.
US Government bonds act as collateral for the vast business of over-the-counter derivatives and futures and options exchange margins. What happens when the pipes get clogged because the value of collateral declines this much? Maybe the systems are much better than in the past, and no one will be surprised. Maybe they will. Do people lose faith in the collateral and ask for more?
What happens when the market wants to revisit the banking crisis from earlier in the year when the bond losses on banks’ balance sheets in the Hold to Maturity accounts become too large for the eye to ignore? A recent Barrons article, Bank of America’s Huge Bond Losses Likely Widened in Third Quarter (9/28/2023) estimates the losses on the balance sheet might be in the range of $115-$120 billion. Does it matter in the context of a Federal Reserve program where banks can borrow money against their bonds with the Federal Reserve and never have to sell the bonds until they mature? It doesn’t until it does.
One outcome is that the Private Credit market is expanding greatly in size because banks can no longer make loans as the bonds with losses continue to sit on Balance sheets.
What happens when the higher volatility in bonds flows through to Wall Street’s Value at Risk models? Usually, the lower the price of an asset and the higher the volatility, the less risk managers want that asset on the Balance Sheet. But hey, this is THE Risk-Free Bond we are talking about. Not some Argentine or Lebanese bond.
None of these individually seem to be a small problem. When combined, these are a very big headache. Or maybe they won’t be. The implications are various, but it’s up to the market when and how big of a problem to make it. It’s up to us to decide what we want out of our portfolio experience. Investors know when they are wrong-footed and need to assess all possibilities.
What would make the bond market less of a problem?
It would help very much if the bond market went up in price or at least if it stopped selling off. My biggest concern is if people don’t want to buy long-dated US bonds, why will they want to go further along the risk curve and buy anything else? When the price of a security, whatever that security might be, keeps going lower day after day, new buyers tend to hold off. Why incur price risk? This can become a buyer’s strike and enforce a vicious cycle until the value players come in.
But didn’t we have 5% long-bond interest rates or higher in the 90s and the aughts? And didn’t the stock market do just fine?
Yes, we did. But in those decades, we were coming in from higher inflation and higher bond yields. A 5% long bond coming from a 7% long bond is a much different story than when we get there from 3.5% in the long bonds. In the former periods, inflation was subsiding, and until recently, inflation in the US was rising. At best, the level of inflation is questionable.
The Chicago Federal Reserve President and Fed Vice Chair, Austin Goolsbee, said on September 28th: Once inflation is back to the 2% target, or on a clear path to it, then it would be “perfectly appropriate” to discuss the target itself.
I wrote in the June MFO issue about how Warren Buffett is looking at debt and inflation here. I still believe in that structural view. Ultimately, it feels like the only way is to let inflation run hotter than 2%, and bond investors are voting with their feet. Ultimately, this is positive for the nominal earnings of certain companies with long-life assets. But tactically, this bond mayhem is an issue that investors can do without.
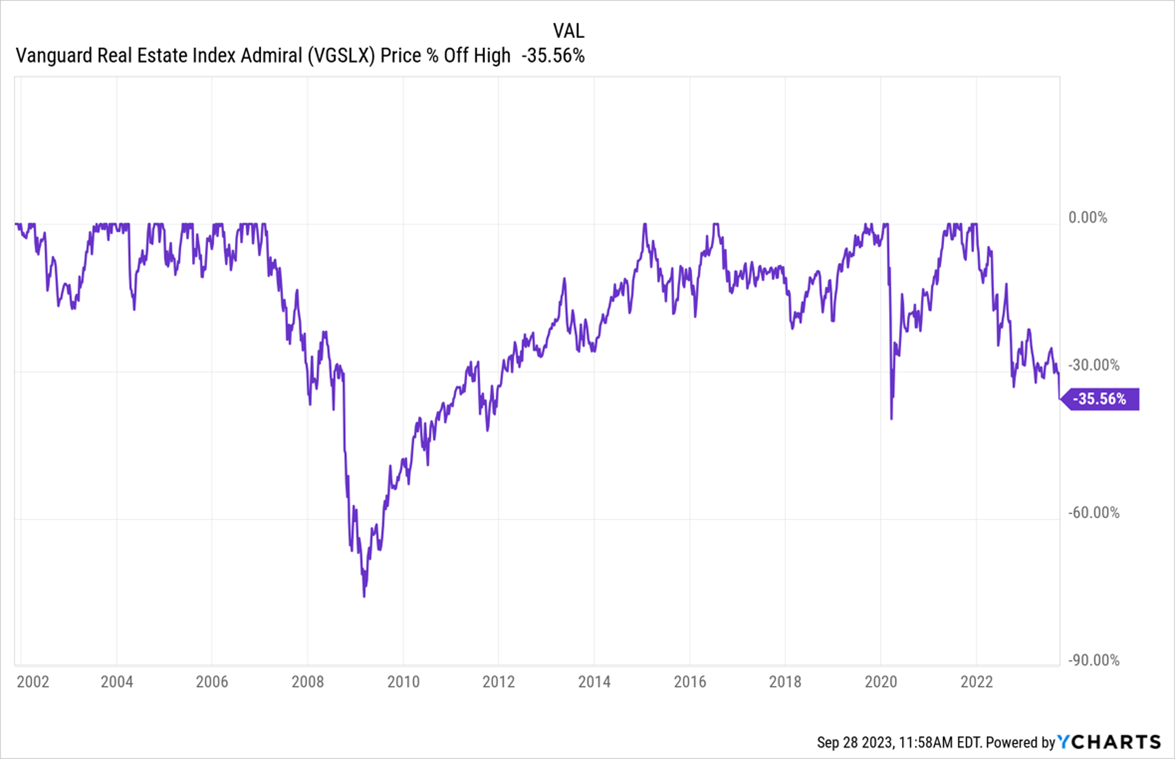
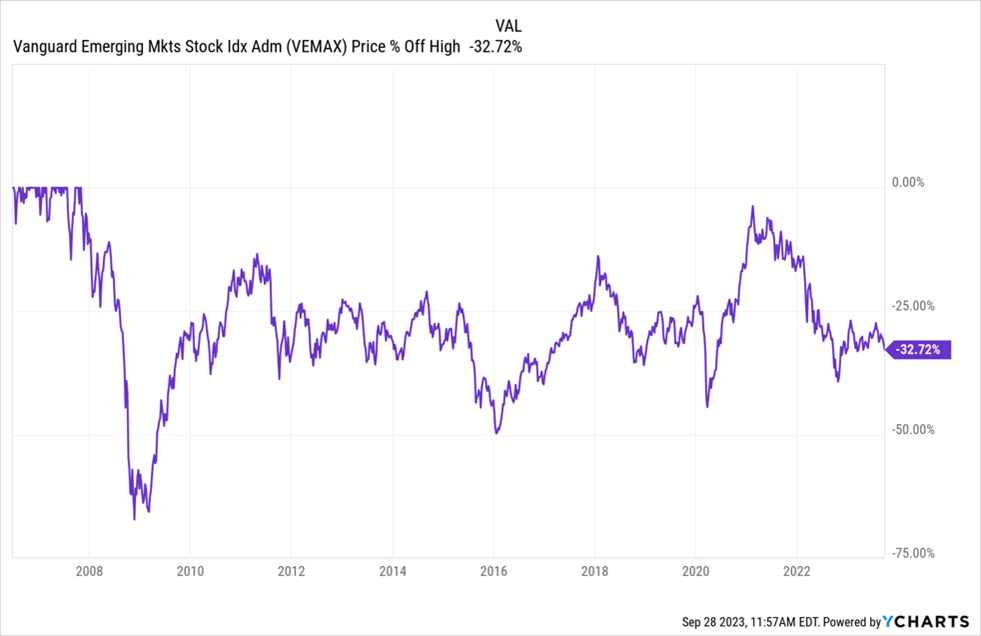
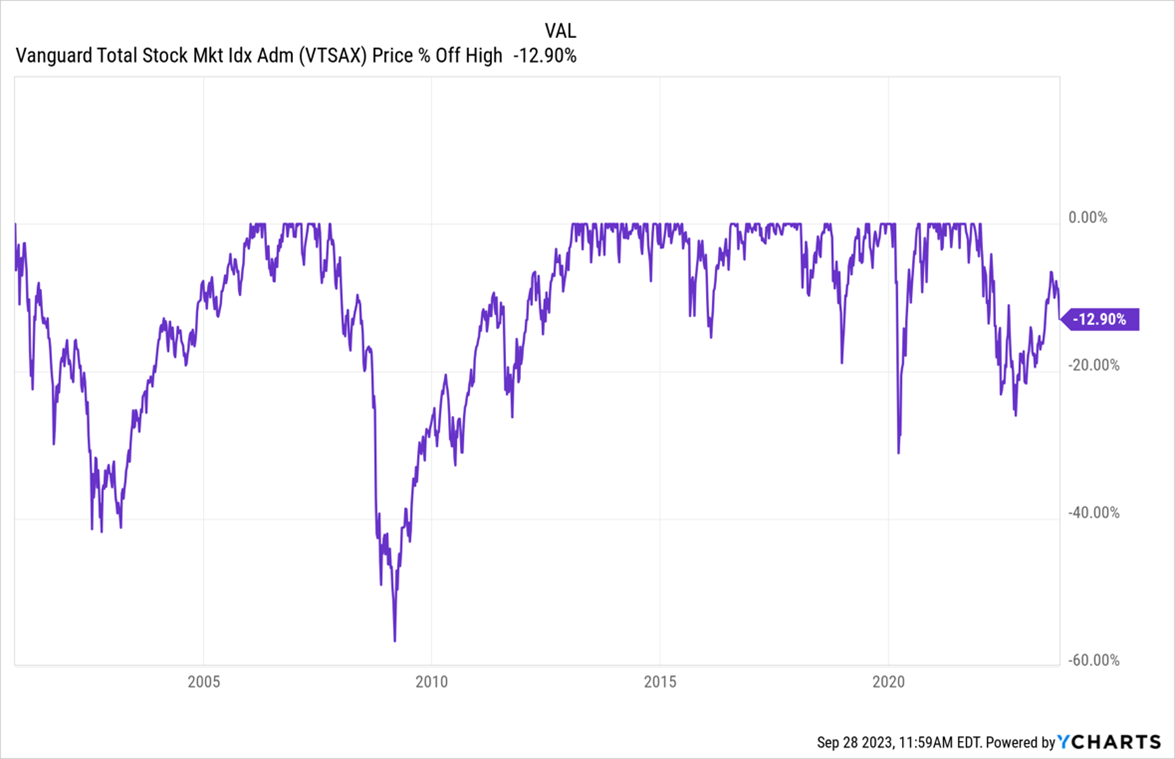
When the price of long-dated risk goes up, it affects everything. Take a look at some of the major asset classes and see for yourself how much of a drawdown from the peak the passive ETFs of these core assets have suffered:
International Equities (VTIAX): 21% down from the highs
Emerging Markets (VEMAX): 33% down from their (2008!) highs
Equity REITS (VGSLX): 35% down from the highs
The only asset class that is impervious thus far is the US stock market, down only a gentle 13% from the highs in comparison.
Isn’t this a nice outcome?
In theory, it would be nice if we could continue this American dream forever. Money markets provide investors with a 5.5%-dollar income, and US stocks behave beautifully and don’t correct like the other asset classes. This music can go on forever. The US equity market is now a standout and in a class of its own. It’s nice, for sure. Will it last?
What could go wrong? Meet Murray Stahl
Enter Murray Stahl, who is the co-founder and co-portfolio manager of various funds and accounts managed by Horizon Kinetics Asset Management. Now, I must admit that we wrote critically about Horizon Kinetics funds and their ginormous 60% positions in one stock – Texas Pacific Land. We were right, too (perhaps more lucky than right). The stock and the fund corrected sharply thereafter. But sometimes, the greatest education comes from finding out why rational people like Stahl would do seemingly irrational things. Was he irrational, or was my understanding too parochial? I couldn’t wait to learn more.
 That’s taken me down a Murray Stahl rabbit hole. Recently, I paid $200 for a used copy of his book and read the whole thing in a few days. In 26 chapters, Stahl boils down how great investors survived bad times and compounded wealth in good times.
I went through all his written material and videos on the fund website, which helped me understand why the fund was this big in TPL. Stahl has concluded that passive indexing is a good idea gone too far, inflation is here to stay, that real assets will benefit, and that royalty and streaming companies will outperform most other assets in the world as commodity prices increase, but the cost for these companies does not. He notes that true wealth comes from truly long-term compounding (we are talking decades) and the benefits of what happens when a stock that has compounded beautifully for decades becomes a very large % of the portfolio (like TPL), then grows the next 10% and the 10% after. The impact of that growth is enormous for wealth creation at the portfolio level.
We see that same analogy in Buffett’s holding of GEICO (now increasingly Apple) or Ron Baron’s holding of Tesla. Just to point out, when a stock becomes this big in the portfolio, it is pretty much destiny for that investor. It’s okay for Stahl, Buffett, or Baron to do this. Shah should be more careful in their portfolio as that last name does not match with any of those three above!!
Murray’s Q2 2023 Commentary and the Technology Bubble.
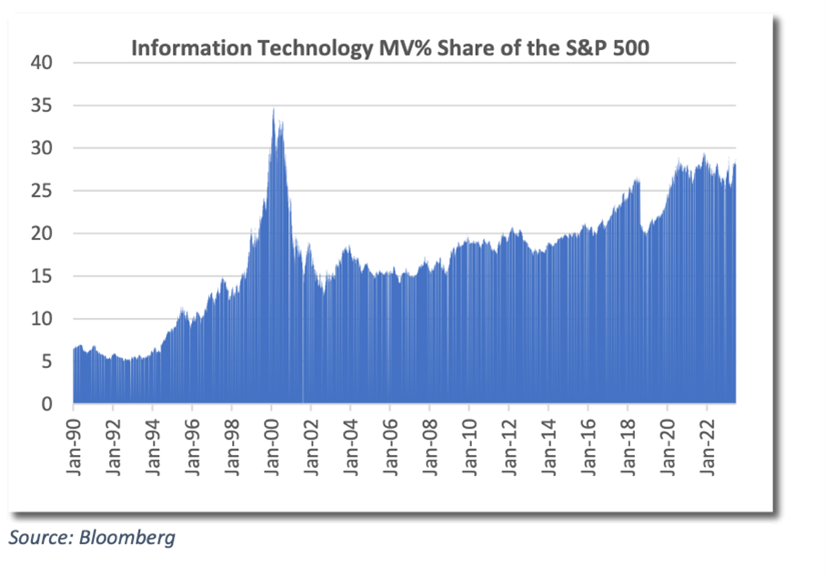
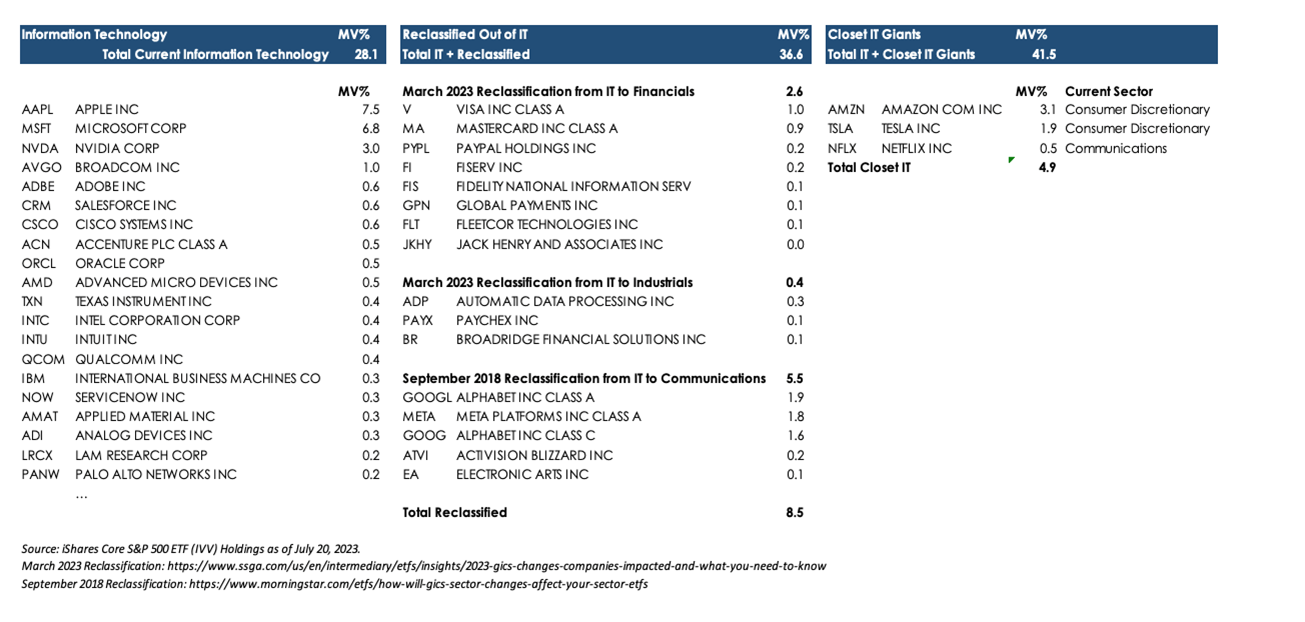
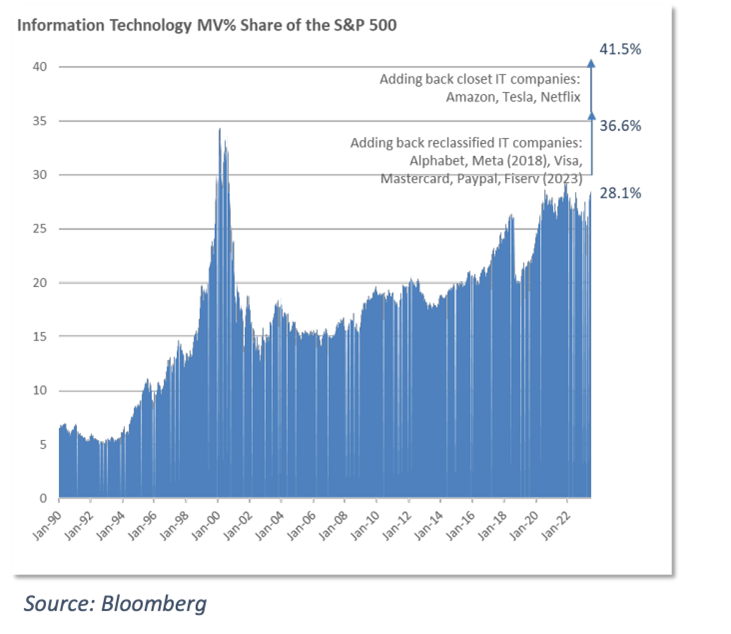
Readers would enrich themselves tremendously by spending time and attention on the Horizon Kinetics Q2 2023 commentary, where Stahl lays out the case for how to identify bubbles and where he claims the US stock market is in the midst of one of those right now. There are three charts from that commentary that I’d like to highlight.
The first chart shows that the % of IT stock Market Value is around 28% in the S&P 500 as of Q2’23.
“But wait, is this calculated correctly?”, Stahl asks. For example, Google, Meta, Amazon, Tesla, and Netflix are NOT in the above chart. The ETF provider iShares reclassified those companies and other companies as Communications or Consumer from the IT sector.
He included those reclassified companies back into the IT sector, and the IT sector would really be 41% of the S&P 500, which is even higher than the dot com era bubble market share of the IT sector in the S&P 500.
His commentary and other commentaries are worth a serious read for the questioning investor. His alternative is not to spray and pray on all assets worldwide. Rather, he has a nuanced view of a basket of streaming and royalty stocks (and digital currencies, I know!!) that will benefit going forth.
The caveat: Stahl has been railing against passive indices and benchmarks since at least 2015. The indices have done just fine in the last eight years, maybe too fine, according to Stahl’s beliefs. Yet, we must read his work. Growth for investors comes not from confirmation bias, but by reading opposing views and testing your own hypothesis. Stahl gives plenty of that.
If he is correct, and if the US stock market is in a bubble led by IT stocks, and the bubble breaks, (perhaps because of the bond market’s relentless selloff), then the practical portfolio most investors have accumulated today will be in trouble.
In Conclusion
Should we use the bond market alarm bells and Murray Stahl’s works to justify selling everything and going home? I wouldn’t do that, but I would be watching like a hawk, and I’d be paying very careful attention to the portfolio I hold. Ultimately, I like going back to the Buffett perspective on markets right now, which I wrote about in June.
The Investor’s dilemma now and always is what and whom to listen to. Here’s what I do know: if the bond market keeps on cracking, that’s the ONE asset we need to listen to. When the cost of borrowing structurally increases for the US Government for the next 30 years, so does the cost for EVERYONE ELSE.
It does not matter if you are Apple or NVIDIA or the Indian stock market. Everyone everywhere will feel it. Watch the bond market carefully and pray to your personal God that the bond market settles down and soon.


