Monthly Archives: August 2022

August 1, 2022

By David Snowball

Dear friends,

Chip and I escaped for a bit this month. We headed northeast to Door County, the peninsula that extends above Green Bay, Wisconsin. Like the Dingle Peninsula in Ireland, Door County represents “my happy place.” For folks unfamiliar with it, imagine a less commercialized version of Cape Cod: water on both sides, farms in between, cherries everywhere, no chain restaurants at all, and a series of small lakeside or bayside towns whose permanent populations number in the hundreds.

Here was the plan: disconnect from the outside world, and connect with each other.

It worked. We didn’t have a computer. Total TV time was zero. Our phones were dormant, except for checking restaurant hours. We started each day with ridiculously strong coffee and a snack, targeted one really good meal each day (lunch, which was cheaper and quieter than dinner), sensibly substituted dessert for our evening meal, and spent as much time in the woods and on the water as in shops or galleries. And then, sat happily in the really, really dark at Newport State Park, on the Lake Michigan side, which is one of only 48 internationally recognized Dark Sky Parks in the world.

Shot with a Pixel 3 Android phone propped up on twigs in the sand.

The MFO homepage has a picture of me sitting on a dock in Ephraim, Wisconsin, at the site of the old Anderson’s General Store, which is now a gallery. Chip and I returned there this summer and, I must say, I like the look.

The Gallery on Anderson’s Dock, Ephraim Wisconsin, 2010 and 2022.

Regrets for the thousand bits of administrative stuff that I didn’t promptly pursue, from slow responses to your questions to late check deposits.

In the meantime, the guys have been working hard!

This month, Devesh gets serious about the abject and ongoing failure of TIPS. Really, they have only one job (“inflation protection” is right in the name), and they’re falling down at it. He works through why that’s the case and when it might be worth looking at them again.

Lynn Bolin celebrates his second month of retirement (a lot) and uses it as an opportunity to walk through the decisions and challenges that investors face in making that transition.

Mark Freeland begins a two-part series, walking through the weird and wild world of ESG investing. This month, he provides an ESG primer (pronounced “primmer” rather than “pry-mer”) that examines key concepts and constraints. In October, he’ll get more into the use of ESG by index makers and fund companies.

Charles Boccadoro, who is summering in Canada, shares the fate of The 100 Club with you. Near the end of the bull market, I wrote a bit about the hundreds of funds that were up over 100% in a year. Charles tracks down the fate of those former titans. (It’s not pretty.)

And a debut! Don Glickstein joins the conversation this month. As you know, we published a death notice for Morningstar’s fund screener, the new version of which has been dumbed down to the point that it occasionally forgets to breathe. Rather than merely mourning the mess, Don reached out to folks at the highest levels of Morningstar to criticize the bog. Perhaps surprisingly, they actually reached back out with explanations and promises.

Finally, The Shadow provides a recap of the industry news – though I have to admit that I’m the one guilty of the snark concerning inverse leveraged single-stock ETFs.

Thanks to them all for their stalwart public service. They make a difference, and I hope you enjoy their work.

A warning about letting your guard down: Don’t.

The most famous intervention by the Federal Reserve in the past half-century occurred in 1980, the last time the Fed was confronted with high, persistent, and pernicious inflation. The Fed chair, Paul Volcker (1927-2019), raised the Fed funds rate to 20% in May 1980, saw inflation rise the moment he tried to ease off, slammed the rate back to 20% in December, and kept it above 16% through May 1981.

By contrast, after 75 bps hikes at its last two meetings, the current Fed funds rate target is between 2.25-2.50%. Current options data shows that traders believe that the Fed won’t take rates above 3.3% – just one-seventh of the rate that they’ve imposed before.

The most common description of Volcker’s action is violent, graphic, and accurate: he broke the back of inflation.

To be clear, breaking one’s back is excruciating and crippling. The way he broke inflation’s back was to nearly break the back of every person exposed to the US financial system. The necessity was simple and brutal: he needed to impoverish hundreds of millions of people in order to get them to stop spending money and driving prices up. A recession ensued. Unemployment popped to its highest level since the Great Depression. The number of Americans living in poverty rose by two million. Angry voters raged against the president and the party then in power in the November 1980 elections.

But inflationary expectations and, with them, inflation, were crushed.

That’s all background to an important podcast from Marketplace (29 July 2022), entitled “Enjoy the summer because the Fed drops the hammer this fall.” July saw prodigious gains by risk assets – stocks up 9%, corporate bonds rose nearly 4%, and high-yield corporates up 6% (all measured by the performance of their respective Vanguard ETFs) – which telegraphed one unambiguous message from investors:

Dear Fed. That pain you think you’re inflicting? Ain’t feeling it!

Pretty much the only possible response from the Fed is to move to inflict greater pain, quickly, and with less warning, as a way of shaking investor complacency. The Fed signaled that they want evidence that economic conditions are “appropriately tight,” and a 4% stock market rally in the two days after their latest hike conveys the opposite.

Kai Ryssdal, riffing on a Bloomberg story (“Shock July Stock Rally Was a Monster the Fed May Regret Seeing,” 29 July 2022), warns:

The Federal Reserve, in the person of chair Jay Powell, has been really clear they’re going to raise interest rate as much as they can [to force] people to spend less money, companies to less spend money and thus slow down the economy. [But falling bond yields in July means that money is getting cheaper, not more expensive.] But the markets are saying “hey Jay, pound sand, man. I don’t care what you think.” … This means that the Fed is going to have to, in their September meeting, drop the hammer. “No, no, no. We’re done screwing around.” They’re going to absolutely clobber us. They need to trim these expectations right the bleep now.

Sidebar: What is Marketplace?

A nonprofit news organization, Marketplace is part of American Public Media, one of the largest producers of public radio programming in the world. They have about 14 million daily listeners. And while American Public Media and NPR are both public media brands, we’re two different organizations. They produce some of the best, most accessible economic programming in English. Their mission is to help economics make sense “for the rest of us.” Their tone is light, intelligent, and balanced. Also informal, which might unsettle some. I’d strongly endorse Make Me Smart and Marketplace as daily listens.

What does this mean for investors?

First, it means you have a choice to make. You need to decide to what degree you believe the optimists – traders think the Fed is about done, FundStrat says “the bottom is in,” and we’ve got a 16% upside by year’s end, Morningstar declares that stocks are trading at historically cheap prices – and to what extent you’re willing to bet your financial future that they’re right. If you’re very confident, it’s risk-on time. If you’re not, it’s time for caution.

Second, you might start adding defensive stars to your due diligence list. Over the years, we’ve highlighted funds run by risk managers, that is, folks who understand that the surest path to long-term success is avoiding overconfidence and overexposure to risk. They tend to favor high-quality businesses purchased at a discount and generally have the ability to scale back equity exposure when things get frothy. Articles like the “dry powder gang” series give you a list of such folks. For the nonce, you really need to learn more about such managers.

  Style notes Performance Morningstar’s take MFO’s take
Leuthold Core LCORX Multi-asset portfolio driven by rigorous quantitative screens. Top 25% YTD, Five-star, Gold-rated Has outperformed its peers, with lower volatility, in every longer-term trailing period
FPA Crescent FPACX Unconstrained multi-asset portfolio whose manager has been getting it right for 30 years Top 20% YTD, 8.0% over the decade Three-star, Gold-rated Since inception, it has returned 2% more annually than its peers with no higher volatility
Ariel Global AGLOX Global large value, manager deeply skeptical of “a market on opioids” Top 14% YTD, 8.5% over the decade Four-star, Bronze-rated MFO Great Owl
Palm Valley Capital PVCMX Small value, two absolute value investors with 50 years of experience between them, still caustic about current valuations Top 3% YTD, which translates to “is making money this year” Five-star, Neutral-rated MFO Great Owl, though on a three-year record
Osterweis Strategic Income OSTIX Multi-asset income fund from a famously independently shop, essentially unconstrained in the search for the most-attractive risk-adjusted opportunities Top 14% YTD, 6% annually since inception Five-star, Neutral-rated MFO Great Owl, MFO Honor Roll, higher returns and lower vol than its multi-asset peers
SmartETFs Dividend Builder DIVS Formerly an active mutual fund, Guinness Atkinson Dividend Builder screens for companies with low debt and consistently growing dividends Top 13% YTD, top 10% returns for the past 1, 3, 5 and 10 year periods. Five-star, Silver-rated MFO Great Owl

This list is neither exhaustive nor a recommendation to buy. It represents some of the most solid investment vehicles we’ve seen, based on their ability to manage across a variety of markets.

Our recommendations: (1) don’t take silly risks. (2) do take time to learn more about options that have been out of the market’s liquidity-driven sweet spot: speculative, growth, large, and tech.

Let’s All Be Like Bill!

Bill Gates is a remarkable person. In many ways, amazing. In some ways, quite admirable. He’s a guy who changed the world with a project that he began as a 15-year-old. 1590 on the SAT. Started at Harvard, dropped out, wrote code, cut throats, and became the world’s richest person … once on a trajectory to become its first trillionaire.

And then … he changed? I won’t speculate as to why, but his more recent persona might lead us to look at ways To Be Like Bill.

  1. Read books! Gates is famously passionate about reading, as is his friend Warren Buffett. The argument they make can be pretty hard-nosed: “if you know only the same things as other people and think only the way they do, you will never achieve anything greater than what they achieve.” Your ignorance becomes self-limiting.

    What to read is simple: anything that makes you vaguely uncomfortable, which is only a symptom of a mind being stretched. (Other than on vacation, about the worst use of your time, is reading people whose conclusions are perfectly comfortable and reassuring to you. They’re pandering.)

    One of his 2022 recommendations is the science fiction novel The Power (2016), about a world in which women become the dominant sex and form a matriarchy. It helped Gates gain “a stronger and more visceral sense of the abuse and injustice many women experience today.” I’d push for Ursula LeGuin’s Left Hand of Darkness (1969), set on a world in which the inhabitants were alternately male and female during their mating cycles, had no gender otherwise, and described humans as horrifying perverts, as the most thought-provoking book I’ve read in decades.

    It’s less well-known that Gates has also written a half dozen books, from Business @ The Speed of Thought (2000) to How to Avoid a Climate Disaster (2021). (Also, too, a guide on programming.)

  2. Strive to make a difference in the world! Gates has announced his intention to give away “virtually all” of his $113 billion fortune. In July 2022, he donated $6 billion in stock to the Gates Foundation as part of his plan to get off the list of the world’s richest people. His argument has been pretty straightforward: “I have an obligation to return my resources to society in ways that have the greatest impact for reducing suffering and improving lives and I hope others in positions of great wealth and privilege will step up in this moment too.” His contributions have included $1.5 billion to the United Negro College Fund, $3 billion for global immunization efforts, and a couple billion to fight AIDS, tuberculosis, and malaria. He’s supporting work on a variety of off-the-radar challenges, including the “Reinvent the Toilet” challenge and related sanitation challenges worldwide.

    But it doesn’t take billions to make a difference. As one wise person noted, “it might be a drop in the bucket, but the bucket is nothing but a bunch of drops come together.” Demands on your local food banks have spiked, while contributions from grocery stores are dwindling. You can make a difference there through groups like Feeding America. Forests are going up in flames from Arkansas (23,000 acres so far) to California (51,000 acres currently alight). You can plant trees $1 and one tree at a time. Putin continues his brutal war on Ukraine, seeking to wipe the country off the face of the map. While you can’t fight their battles for them, you can surely and easily feed their children and house their homeless elderly.

  3. Invest in farmland. Gates owns 269,000 acres of farmland across 18 states, making him the largest private farmland holder in the US. He most recently added 2100 acres in North Dakota. (Local Republicans panicked because of what they perceived as Gates’ anti-meat bias.)

    There’s a powerful case for buying farmland and, perhaps especially, timberland. It is uncorrelated with public markets, it seems to be an effective inflation hedge, has low price volatility, and has returned about 11% per year. Many of those virtues stem from the fact that it’s an illiquid asset that requires a steady, long-term commitment (said the guy from Iowa).

    Timberland, likewise. It ignores market crises, grows in value from year to year, has historic returns greater than the stock markets, and can be a powerful environmental tool.

    For readers who are really, really rich, there’s a fascinating closed-end interval fund to consider: Versus Capital Real Assets (VCRRX), which sports a $500,000 minimum, is up 3.2% YTD, is less volatile than a 60/40 fund, and provides access to timber, farmland and infrastructure investments. (They also refuse to respond to email inquiries, in part because I was trying to find a backdoor for mere mortals.) Because of the complexity of illiquid asset investments, there are no other fund options that I’ve found. But I’m still looking for you.

  4. Hang out with sociopaths and cheat on your … Ummm, let’s skip that one.

Thanks!

As ever, to the tens of thousands of folks who share a part of each month with us. If you read something striking, please do take a moment to respond to the author … perhaps tweet the article (we embed links), post a comment to our discussion board, or drop them an admiring (or aggrieved) email. All of us are just [email protected].

Thanks most especially to the folks whose financial support helps keep the lights on and spirits up: The Suranjan Fund, Andrew from Ohio, Paul, Sherwin, and our faithful regulars Greg, William, Brian, William, David, Doug, Wilson, and the folks at S & F Investment Advisors. Cheers to you all!

I’ve spent much of July disconnecting from the need to dash around, recharging a bit, and marveling at our ability to make a difference. As a simple example, when I first bought my little 1970s split foyer house in 2014, I would have been lucky to see 20 bees a day in the yard. This month, after slow and serious attempts to reintroduce native plants in place of swathes of lawn, I wouldn’t be surprised to see 20 species of bees in a day, from carpenters and bumblebees (some big enough to cause flower stalks to bend under their weight) to hoverflies and mason bees. Goldfinches have been at their annual seed raids, and so many birds were plucking viburnum berries that whole bushes quaked. For the first time in rather a while, I’m sort of looking forward to the adventures ahead.

Those adventures will soon include a profile of DGI Balanced Fund (one of the best performing and most distinctive in its class), Harbor International Small Cap (run splendidly by the Cedar Street Asset Management folks), and Port Street Quality Growth (which has been “the next fund we really need to look into” for about two years).

Be good to yourselves!

david's signature

An ESG Primer

By Mark Freeland

There are days when the world seems unnecessarily out of whack. Runways in London are melting, doctors and pharmacies are denying basic legal reproductive care to women because of fear of prosecution, and corporations are hiding more and more dark money contributions.   It doesn’t matter where you stand politically; both parties are rollicking in the dark. Many people are working to make the world a better place, and many more seem stunned and appalled. One of the strategies that was very much in vogue last year was putting your money where your beliefs are; that is, investing in funds and ETFs that espoused some form of sustainable / responsible / green discipline. Bloomberg’s Saijel Kishan reports (2/3/2022) that

While definitions of environmental, social and governance investing vary — it can mean putting your money in anything from a wind-energy company to a Silicon Valley tech giant — assets are set to balloon to $50 trillion by 2025 from about $35 trillion, according to estimates from Bloomberg Intelligence. The growth has been spurred by record-breaking fund inflows amid concerns about climate change and other societal issues. 

Sensing money to be made, firms quickly promoted (or cobbled together) about 80 new ESG funds in 2021. But then 2022 happened: many tech-heavy green funds cratered along with the market, fossil fuel producers soared, and ESG funds saw their first outflows in years.

This seems like an appropriate time to look at ESG investing in general and ESG funds in particular.

There are two parts to this piece. Our August essay presents an overview of ESG investing, where it comes from, and the different approaches employed. It touches on whether ESG can make sense from an investment (money-making) perspective. In October, we will take a look at how some rating services and fund families employ these approaches. Why, for example, did S&P drop Tesla from its ESG list?

Hopefully, both parts will give readers something to think about. Why does one want to invest in sustainable companies? It could be for ethical or religious reasons, because one wants to make a difference, or one may simply look at ESG investing as a path to better profits.

What are E, S, and G?


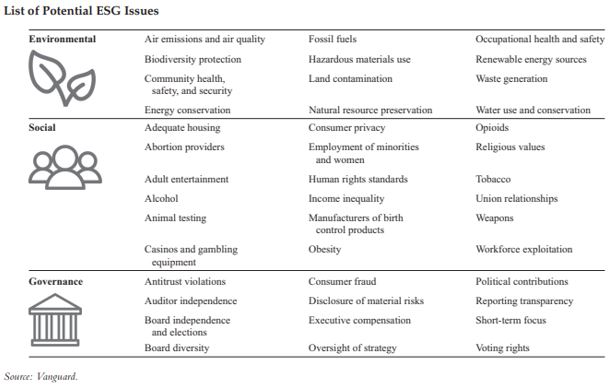
Environmental, Social, and Governance focused investing can mean different things to different people. Here is a graphic from Vanguard showing some areas that Vanguard feels come under these headings.

The SEC has its own set of examples. For social issues, it includes “diversity and inclusion, human rights, specific faith-based issues, the health and safety of employees, customers, and consumers locally and/or globally, or whether the company invests in its community, as well as how such issues are addressed by other companies in a supply chain.”

People tend to have a pretty good sense of what environmental issues are, or at least the ones that are important to them.  Basically, clean air, clean water, clean land, and whatever it takes to make that happen.  

At first glance, governance seems to be a bit different from environmental and social issues.  Governance is concerned directly with how well a company is run and how it treats those in its ecosystem (employees, clients, vendors) as opposed to a company’s effects on the environment and on people generally.

In the end, the particular classification isn’t that important. Vanguard considers workplace safety an environmental issue (see graphic above). I would have classified it as a social concern along with other workplace issues like equal opportunity, parental leave, and adequate healthcare. One could even make an argument for it being a governance issue, as it relates to employment and how a company manages its workers.

Perhaps because it isn’t as intuitive as environmental and social issues, governance merits a bit more exposition. Well-run companies can do a lot of damage – think about an efficient, legally run coal plant. Scrubbers and all, this is not a clean process. But when companies are poorly run, when they hide what they are doing, when they disregard input from stakeholders – shareholders but also workers and customers and neighbors – they risk harm not only to others but ultimately to their own business.

Enron is a textbook example of a company with poor governance.  Little transparency, ethically dubious practices, shareholder/employee abuse (the company froze Enron stock in the 401(k) plan, but not for the executives), and more. Of course, not every company is a potential Enron, though many are ethically challenged or may simply feel that minor transgressions, like white lies, are relatively harmless.

Personal experience in very small startups has left me sensitive to these concerns. The board of one startup did not hold an annual shareholder meeting for three years. It was so scared of facing its investors that when it did hold the shareholder meeting, it hired an armed guard to stand next to the board. The shareholders immediately insisted that the guard be removed; violence did not ensue.

The Evolution and Practices of ESG Investing

Governance was somewhat of a latecomer to the game. ESG investing started out as socially responsible investing (SRI), emphasizing social concerns nearly a century ago. Much longer, actually, but the focus here is on mutual funds, so we can’t really go back much beyond the 1920s.

The Pioneer Fund (the second oldest U.S. mutual fund) was founded as the Fidelity Mutual Trust in 1928 by an ecclesiastic group. Its objective was to screen out alcohol, tobacco, and gambling companies, aka “sin stocks.” It fairly well typifies the early funds – religious underpinnings, a focus on social issues, and the use of fairly stringent “negative screens.”

In negative screening, a fund or investor absolutely excludes from consideration any company that does something “bad”. That could be manufacturing cigarettes or, as became more of a concern in the sixties, manufacturing weapons. While the screens tend to be absolute, what is being screened out doesn’t have to be. For example, a screen might exclude absolutely all companies taking in more than 5% of their revenue from tobacco. So even absolutes can be sort of relative.

In the sixties and seventies, a number of trends served to broaden the scope of SRI funds.  Notably, of course, was the environmental movement, with such landmarks as the publication of Silent Spring in 1962 and the first Earth Day in 1970. The sixties were also notable for major social movements, including civil rights and gender equality, among others. SRI funds broadened their scope and incorporated positive screenings.

In their book Ethical Investing (1984), Amy Domini and Peter Kinder describe positive screening as an “approach [that] compliments the avoidance [negative screening] approach. Those adopting it seek investments in companies that enhance the quality of life.” A few examples of positive screens are a concern for safety (both employee and product), community involvement, energy conservation, and clean energy production.  

Many positive screens, such as workplace practices, are broad and could be applied to almost any company. Others, like clean energy, are narrowly focused on particular industries. Funds that concentrate on these sectors may nevertheless also incorporate other considerations. For example, New Alternatives Fund (investing in alternative energy) joined with the vast majority of SRI funds in the eighties in avoiding companies doing business in South Africa in opposition to apartheid.

Rather than merely avoid “bad” companies and profit from “good” ones, another approach is to actively work to change company practices for the better. This seems like a recent phenomenon. In a way, it is. It is becoming more widespread and better known. Though as a tactic, shareholder activism dates all the way back to the first company to issue stock, the Dutch East India Company.

In addition to shareholder initiatives and proxy votes, institutional investors, including mutual fund families, often engage directly with companies to influence their practices. It can be difficult to know what a fund family is doing behind the scenes or how effective its efforts are.  This is made more difficult by the fact that most fund companies manage many funds with varying objectives. Only a few in their stables may have an ESG focus. In this respect, it is easier to infer the actions of pure ESG fund families.  

Third-party sources can be helpful here. Jon Hale, Morningstar’s director of ESG research for the Americas, observes that “Several … asset managers, especially Boston Trust Walden, Calvert, Nuveen, and Pax engage directly and often with companies about ESG issues and support most ESG-related shareholder resolutions” (6/24/2022).

Impact Investing

Impact investing is often described as making investments “with the intention to generate positive, measurable social and environmental impact alongside a financial return.” While an admirable objective, the term is often applied broadly to encompass all approaches regardless of how effective they are.

It is difficult to move the needle with screenings, whether positive or negative. Selling stock of a given company may depress the price of the stock, but only if enough people divest. Rarely does divesting have a significant impact on the cost of capital of a company, though that is the economic objective of divesting.  

There are better ways to make an impact than by merely investing (or divesting) in the secondary market. One way is to go further, to push companies to change through activist investing described above. There are many funds and other vehicles available for this type of investing.  

Another way to make an impact is to directly fund companies doing good work. That is not easy to do in the equity market. One alternative is to invest in entirely new or “good” industries such as renewable energy in an attempt to expand that industry. Bonds, because they are issued frequently and because they are accessible to individual investors as well as to institutions, are another vehicle available for impact investing.

Green bonds, aka climate bonds, are used to directly fund projects that address environmental concerns. A plain English presentation (2018), including pros and cons, was produced by the folks at Brown Advisory, a distinguished ESG investor. In the past few years, several bond mutual funds have been launched with names including ESG, sustainable, or green. Typically these funds go beyond bonds that have been certified “green.” So before investing, take a look at what is in their portfolios.

Performance

In the end, for many investors, it is ultimately all about performance. The classic knock against SRI/ESG investing is that by fishing in smaller pools, returns cannot mathematically be superior.  A counterargument is it’s a lot better to fish in smaller, cleaner pools than in huge, contaminated ones. By focusing on well-run companies, companies that engage their workforce and have more productive employees, and companies that plan for environmental changes, ESG investing concentrates on companies that perform better.  

ESG can be viewed as a form of factor investing, a particularly appealing form. Unlike some factors, which seem to be little more than the results of data mining (like the Superbowl indicator for the stock market), it has an underlying theory as well as correlation. In addition, so long as ESG investing doesn’t reduce returns, it offers a way to invest in “good” companies.

Studies on ESG performance tend to be mixed. Looking at the results of 2,000 studies done from 1970-2014, a meta-analysis concluded: “The business case for ESG investing is empirically well founded. … The large majority of studies report positive findings.” In other words, ESG investing does not come out worse and may do marginally better than non-ESG investing.

The bottom line

Investors consider ESG investing for a variety of reasons. For some, climate change is an existential threat that trumps everything else. For others, it may be important not only how clean a company is but how good a citizen it is and how it treats its stakeholders. Think about what matters to you, and then go beyond the ESG label to find funds that best address your concerns.

Retirement Planning in the Shadow a Recession

By Charles Lynn Bolin

I am now in my fourth week of retirement. This article is the third of a three-part series describing my experiences as I retire. It builds upon “Certainty of Death and Taxes,” where I describe how taxes, social security, and Medicare may impact retirement financial plans. The topics covered in this article are:

  1. Investment Environment: A recession is becoming more likely in 2023
  2. Sequence of Return Risk: How a recession early in retirement can damage retirement plans
  3. Tax Efficiency: Optimizing lifetime after-tax retirement income
  4. Withdrawal Strategy: Using a basket of accounts to reduce taxes
  5. Investment Strategy: The extended Bucket Strategy

I used the tax and Medicare thresholds and rates from “Certainty of Death and Taxes” to build Figure #1, which is the percent of Modified Adjusted Gross Income (MAGI) that a married couple filing jointly will pay for Federal Taxes and income-adjusted Medicare premiums assuming that they receive $50,000 in Social Security benefits annually and all income is taxed at the ordinary income rate. Optimizing after-tax retirement benefits means shifting income along the curve by deferring or accelerating income or using sources of income that are not included in MAGI, such as withdrawals from Roth IRAs. Income from tax-efficient after-tax accounts has lower tax rates than capital gains and may shift the curve downward.

Figure #1: Federal Tax and Medicare Part B Income Adjusted Premiums

Source: Created by the Author

Figure #1 represents a worst-case scenario for a retiree who is faced with a range of options, all involving ordinary income, including social security, pensions, some annuities, RMDs, and Roth Conversions. The ideal range to be in is the income range covered by the solid red ellipsoid, which is highly efficient with an effective tax (Federal taxes combined with Medicare Premiums) rate of 5 to 15% for up to $165,393 in MAGI. Although less tax-efficient, the red ellipsoid with a dashed line where the MAGI in the income range from about $215,000 up to $320,000 has an effective tax/premium rate of 21% to 24%. Both ranges defined by the two ellipses may be valid for an investor looking at short- and long-term goals which may be impacted by Roth Conversions and deferring Social Security. Roth Conversions may temporarily shift a retiree into the higher MAGI range but reduce RMDs in the longer term to shifting the retiree into the lower MAGI range. 

The following quote from Fidelity highlights the importance of this article. 

Some investors spend untold hours researching stocks, bonds, and mutual funds with good return prospects. They read articles, watch investment shows, and ask friends for help and advice. But many of these investors could be overlooking another way to potentially add to their returns: tax efficiency. (“How To Invest Tax-Efficiently”, Fidelity Viewpoints, 01/13/2022)

Christine Benz from Morningstar lays out a good foundation for this article in “An Investing Road Map for Retirees.” Another good starting point is “14 Reasons You Might Go Broke in Retirement” by Bob Niedt at Kiplinger. The articles are worth reading for anyone at any age who wants to be prepared for retirement. 

First Month of Retirement

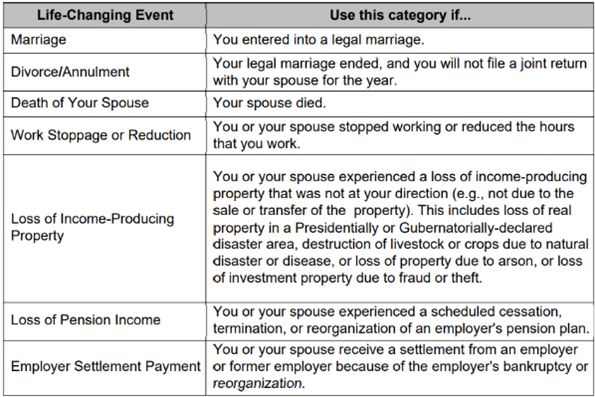
As described in my article, “Certainty of Death and Taxes”, in the July MFO newsletter, Medicare costs go up for high-income earners, which is based on their income from two years prior. This impacts most people who have just retired, and their income is much lower now than two years ago. A trip to the Social Security Office was beneficial, and I was told to fill out form SSA – 44, which adjusts premiums for life-changing events like retirement. The form is available online at www.ssa.gov and explains life-changing events as:

Table #1: Life-Changing Events that may lower Medicare Part B Premiums When Retiring

Source: Social Security Form SSA-44

To fill out the form, I compiled or estimated my Modified Adjusted Gross Income (MAGI) for 2020 through 2023 to show my income levels when working, during the year of retirement with some work income and pensions, and at full retirement with pensions and no employment income. I also used this information to look at how these changes impact taxes and Medicare Premiums along the curve in Figure #1. It is useful in developing a strategy to determine how much of a Traditional IRA can be converted to a Roth IRA.

Investment Environment – Short and Long Term

The US real GDP just came in with a 0.9% decline for the second quarter, which is close to the 1.2% decline estimated by the Atlanta Fed’s GDPNow. Kudos to the Atlanta Fed. However, Real GDP grew by +1.6% year over year, which is slow but not alarming. Growth is peaking. Simon Kennedy wrote “Threat of US Recession Mounts,” in which he says Bloomberg Economics estimates that there is a 38% chance of a recession during the next year based partly on corporate profit outlook, consumer sentiment, financial conditions, and rising rates. In Vanguard’s “Economic and Market Outlook”, they place the probability of recession in the United States at 25% in the next twelve months and 65% over the next two years. 

Fidelity Institutional, in their “Third Quarter Market Update,” places the US economy in the late stage of the business cycle with a “rising but moderate near-term recession risk.” Another point of view that resonates with me is the Fidelity Institutional Insights which describes the long-term capital markets over the next twenty years, in which I added the explanations in brackets.

Given slower economic growth [due to demographic trends], high asset valuations [particularly in the U.S.], and low starting bond yields [which are rising], we expect asset returns over the next 20 years to be significantly lower than long-term averages. (“Capital Market Assumptions: A Comprehensive Global Approach for the Next 20 Years”, Fidelity, 09/07/2021)

Inflation, as measured by one of the Fed’s favorite metrics, personal consumption expenditures, just rose to 6.8%. Employment costs are rising but not keeping up with inflation. Supply chain disruptions, the Russian Invasion of Ukraine, and years of underinvestment in commodities contributed to high commodity prices. The Federal Reserve aggressively raising interest rates and the dollar as a “safe haven” contributed to a stronger dollar lowering the cost of imports. Heather Burke describes it well in her article on Bloomberg, “Five Things You Need to Know to Start Your Day”:

The dollar capped off its vertiginous rise over this past year by rallying 1% last week. This creates problems for the rest of the world as most global trade is denominated in dollars. The flip side of a strong dollar is weaker currencies in other countries. That, combined with the strength of the US consumer after the pandemic and global supply shortages, means the US is exporting inflation to the rest of the world…

…a stronger dollar tends to cause the rest of the world pain by tightening global financial conditions and hitting global trade (imports into the US get cheaper, yes, but the drag from a stronger dollar on global financial conditions tends to outweigh any benefit other countries get from exports). (Heather Burke, “Five Things You Need to Know to Start Your Day”, Bloomberg, 07/18/2022)

Each Saturday morning, I read Doug Noland’s Weekly Commentary on Seeking Alpha which this week is titled “Nowhere To Hide.” Mr. Noland highlights the rising global risks, but I found this viewpoint supportive of my own: 

And while commodity prices have retreated over recent weeks, we believe the new cycle will be an era of hard asset outperformance versus financial assets. …

And let me summarize some key aspects of the new cycle that will profoundly impact the markets. Consumer prices will have a stronger and sustained inflationary bias. Central banks will be forced back to a traditional inflation focus rather than the experimental market-centric approach of the past cycle. Policy rates will be higher, and QE will be relegated to a crisis-fighting tool. Financial conditions will be significantly tighter on a more sustained basis. (Doug Noland, “Weekly Commentary: Nowhere To Hide”, Seeking Alpha, 07/23/2022)

Sequence of Return Risk

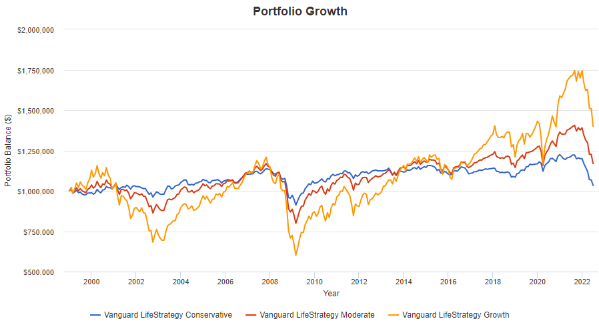
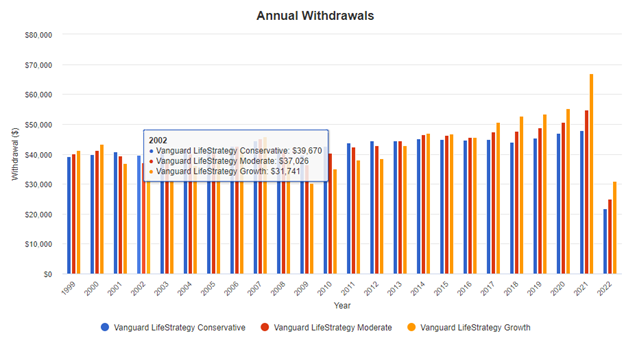
Major bear markets have a larger impact on someone entering retirement than if the recession occurs later during retirement in what is known as the “Sequence of Return Risk.” To illustrate this, I use Portfolio Visualizer Backtest Portfolio Asset Allocation assuming a four percent withdrawal rate for three Vanguard funds for two nineteen-year periods, with one starting prior to the bursting of the Tech Bubble in 1999 and the other starting after the bursting in 2003. The Vanguard LifeStrategy Conservative fund was impacted less for both ending balance and lifetime income. There was a much more dramatic impact on the Vanguard LifeStrategy Growth fund, where lifetime income fell from $805,727 to $480,996 for the person who retired before the recession compared to afterwards. I am attempting to balance higher income in more conservative portfolios and higher balance in more aggressive portfolios.

Table #2: Sequence of Risk Return Example

Nineteen Year Period 1999 – 2017 2003 – 2021
Fund Balance Income Balance Income
Vanguard LifeStrategy Conservative $1,140,110 $762,891 $1,214,396 $720,348
Vanguard LifeStrategy Moderate $1,226,979 $686,397 $1,548,884 $775,513
Vanguard LifeStrategy Growth $1,351,234 $480,996 $2,403,061 $805,727

Source: Created by the Author Using Portfolio Visualizer Asset Allocation

Figure #2 shows the impact of drawdowns on remaining balances, and Figure #3 shows the impact on income at the bottom of the bear market. Note that income for the Growth fund in the worst year is 20% lower than the Conservative fund.

Figure #2A: Sequence of Return Risk Impact of Drawdowns on Remaining Balances

Source: Created by the Author Using Portfolio Visualizer Asset Allocation

Figure #2B: Sequence of Return Risk Impact of Drawdowns on Income

Source: Created by the Author Using Portfolio Visualizer Asset Allocation

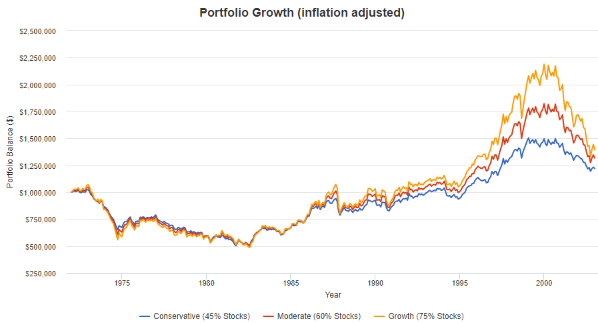
To illustrate the differences in inflationary time periods, I again use Portfolio Visualizer but with Backtest Portfolio Asset Class Allocation in order to show the impact of starting retirement prior to a bear market during the stagflationary 1970s with slower growth and higher inflation. The inflation-adjusted balances fell in half over the next two decades regardless of the investment style. “Stagflation” is a period of high inflation and relatively high unemployment. Currently, we are not in a traditional stagflationary period, because of the tight labor market. 

Figure #2C: Sequence of Return Risk Impact During the 1970s’ Stagflation Period

Source: Created by the Author Using Backtest Portfolio Asset Class Allocation

Christine Benz from Morningstar wrote “Does the 4% Guideline Rest on a Flawed Assumption?” which describes that many retirees tend to spend more during their early years of retirement and less in the latter years. Ms. Benz points out, as well as Fidelity did earlier in this article, that returns over the few decades are probably going to be lower than historical averages: 

The reasoning is straightforward. The Morningstar Investment Management team expects stock and especially bond returns to be fairly modest over the next 30 years–a typical planning horizon for retirement–and they think the next 10 could be particularly weak. Given those low return inputs, our research concluded that new retirees would do well to start conservatively on the spending front. (Christine Benz, “Does the 4% Guideline Rest on a Flawed Assumption?”, Morningstar, 12/10/2021)

Ms. Benz adds that spending needs are variable based upon life events, capital expenditures, and health care costs, among others. The founder of the 4% Guideline, Bill Bengen, said that the “sequence of inflation” risk is similar to the “sequence of return risk”.

If inflation hits early in retirement, he [Bill Bengen] argues, that inflates all subsequent withdrawals. If a retiree is embarking on retirement in what appears to be a period of elevated inflation, that argues for taking a conservative tack on starting withdrawals.

Tax Efficiency

The base case was presented in Figure #1. There are a variety of ways to improve upon the base case, such as:

  • Deferring Social Security Benefits until age 70 reduces income in the short-term
  • Using capital gains from an after-tax account at a lower tax rate
  • Converting Traditional IRAs to a Roth to reduce RMDs in the future
  • Rolling a pension into an IRA as a lump sum to reduce income until age 72.
  • Withdrawing after-tax contributions from a Roth to avoid higher marginal tax rates.
  • Making charitable donations to avoid a higher marginal tax rate.
  • Reducing withdrawals from Traditional IRAs to the minimum RMD.
  • Using a deferred annuity to reduce income until needed.

The American Association of Individual Investors (AAII) has a comprehensive “Guide to Personal Tax Planning” if you are a member. They point out when a taxpayer may be subject to the Alternative Minimum Tax (AMT), which for married couples filing joint returns in 2021 was 26% of the first $199,900 of alternative minimum taxable income in excess of the exemption amount, plus 28% of any additional alternative minimum taxable income. Reasons that people may fall under the AMT include: 

  • You have large itemized deductions for state and local taxes, including property and state income tax, or from state sales tax;
  • You have exercised incentive stock options;
  • You have significant deductions for accelerated depreciation;
  • You have large miscellaneous itemized deductions or a large deduction for unreimbursed employee business expenses;
  • You have a large capital gain.
    (AAII Staff, The Individual Investor’s Guide to Personal Tax Planning 2021, AAII, December 2021)

Many taxable bonds are tax-inefficient because distributions are taxed as ordinary income, and money not needed in the near term is well suited for tax-deferred accounts such as Traditional IRAs. Stocks that are more volatile and have higher returns over the long term are well suited in Roth IRAs where taxes have already been paid. 

Taxable accounts have benefits for meeting multiple goals. Christine Benz from Morningstar provides six reasons for having a taxable account in addition to tax-advantaged accounts, which I summarize:

  1. Flexibility to have access to your money without having to pay taxes on the principle. This adds the flexibility of changing the mix of withdrawals in the future when tax rates change.
  2. Tax efficient index funds to benefit from capital gains and tax-free municipal bonds and funds.
  3. Tax loss harvesting to offset capital gains and possibly ordinary income.
  4. Withdrawals of principal with no and capital gains with low taxes.
  5. More control over taxes in retirement. There are no RMDs.
  6. Favorable tax treatment for heirs where capital gains taxes are based on the price when they inherited the assets from you.

(Christine Benz, “6 Reasons a Taxable Account Should Be Part of Your Retirement Portfolio”, Morningstar, 01/28/2022)

Withdrawal Strategy

Maryalene LaPonsie describes, in a U.S. News & World Report, “9 Retirement Distribution Strategies That Will Make Your Money Last”. The ones that I am employing are 1) taking a total return approach by varying the sources of distributions, 2) Creating a floor of guaranteed income to meet basic spending needs, 3) Bucket Strategy based on life timeline events, 4) Minimizing mandatory distributions from Traditional IRAs by converting a portion to Roth IRAs, and 5) Account Sequencing to optimize after-tax income over retirement. 

Kevin I. Khang, Ph.D., and Andrew S. Clarke, CFA at Vanguard, suggest a dynamic spending approach in “Safeguarding Retirement In a Bear Market” (June 2020), where spending is varied between 2% and 5% based on portfolio returns. This can reduce the downside risk of running out of money during retirement without much change in overall income. Vanguard Perspectives (May 2021) builds upon this concept of dynamic spending by comparing three different spending strategies 1) Dollar value plus inflation, 2) Dynamic Spending, and 3) Percentage of Portfolio. The pros and cons of these strategies are described below.

Figure #3: Comparing Three Spending Strategies

(Kevin I. Khang, Ph.D. and Andrew S. Clarke, CFA “Safeguarding Retirement in a Bear Market”, Vanguard, June 2020)

Having large amounts in Traditional IRAs is not conducive to the Dynamic Spending Rule. Excess (elective) RMDs above spending needs can be placed in an after-tax account which can then be used during peak spending years or passed along to heirs.

Here is a useful Retirement Nest Egg Calculator by Vanguard. If you select that you have a life expectancy of 30 years, have one million dollars in savings, invest with a 60/40 stock to bond ratio, and need $40,000 (4% withdrawal rate) above other income sources to meet spending needs, then the result is that there is a 91% probability of your savings lasting your expected lifetime using historical performance. If you want close to a hundred percent probability of not running out of money, then you may need to drop your spending below $28,000 per year, or less than a 3% withdrawal rate. This is a great tool but does not take into account whether your sources of income are taxable.

Figure #4: Vanguard’s Retirement Nest Egg Calculator

(“Retirement Nest Egg Calculator”, Vanguard)

Roger Young, CFP at T. Rowe Price, gives some excellent examples of withdrawal strategies in “How to Make Your Retirement Account Withdrawals Work Best for You.” Mr. Young concludes that retirees may benefit from one or more of the following strategies:

  • Drawing from tax-deferred accounts to take advantage of a low (or even zero) marginal tax rate, especially before RMDs
  • Selling taxable investments when income is below the taxation threshold for long-term capital gains (often supplementing with Roth distributions to meet spending needs)
  • Considering heirs’ tax rates when deciding between tax-deferred and Roth distributions (if you’re confident there will be an estate)
  • Evaluating whether to hold taxable assets until death to take advantage of the step-up in basis (again, only if the assets won’t be needed for spending in your lifetime) (Roger Young, CFP, “How to Make Your Retirement Account Withdrawals Work Best for You”, Rowe Price)

Figure #5 represents how retirees with relatively modest income might optimize their withdrawal strategy with little to no taxes. Notice the withdrawals of tax-deferred RMDs (purple) and the elective withdrawals (orange).

Figure #5: Tax Optimization Example Under Bracket Filling Method

(Roger Young, CFP, “How to Make Your Retirement Account Withdrawals Work Best for You”,T. Rowe Price)

Figure #6 is an example of how people with higher incomes who might want to leave an estate may choose to optimize their strategy. The elective withdrawals may be rolled over into a taxable account which has benefits for passing along to heirs. In my case, I expect a combination of Roth Conversion and accelerated Traditional IRA withdrawals when I finalize my strategy because I am overweighted in Traditional IRAs.

Figure #6: Tax Optimization Example Prioritizing Tax-Deferred Distributions

(Roger Young, CFP, “How to Make Your Retirement Account Withdrawals Work Best for You”, T. Rowe Price)

Investment Strategy

This article points out higher level risks to people entering retirement in the near future due to: 1) Sequence of return risk from recessions, 2) Inflation, and 3) Lower stock market returns over the next twenty years than historical averages. Conservatism and active retirement planning are prudent in the current environment.

Two of the changes as retirement became a reality were to sell our former residence and my decision to take some of my company pensions as a lump sum which will be rolled over into a Traditional IRA. These greatly increase flexibility during retirement planning. I have created buckets based on lifetime income needs. These include spending needs for several years before Social Security Benefits begin, a defensive Traditional IRA for emergency needs, a tax-managed account, balanced Traditional IRAs, and a growth-oriented Roth IRA. I manage the more conservative buckets and use Fidelity Wealth Management services for several buckets that are oriented for the longer time horizon. 

Writing “Certainty of Death and Taxes” and this article has refined my investing strategy in retirement and provided me confidence in what I am doing. I will meet with a CPA in October and finalize the strategy.

As for my own short-term investment strategy, I try to reduce risk by balancing between funds that do well in inflation and funds that do well during recessions. I have increased cash. My neutral allocation is 50% to stocks (and commodities) with a minimum of 35% and a maximum of 65%, depending upon the business cycle. I am currently at 45% stocks. A recession is not imminent, and I believe that we are experiencing a bear market rally. I have periodically bought CD ladders to benefit from rising rates. As rate hikes appear to peak, I will move back into bond funds for protection in a recession.

I wish I could give you some good TIPS on beating inflation

By Devesh Shah

I’m not sure that I can. If I were to offer any tip, it might be to avoid TIPS.

The Problem: Inflation, TIPS, and Investment Frustration

Some investors (me included) bought Treasury Inflation Protected Securities (TIPS) to protect against rising inflation. Inflation has been raging in 2021-2022. Are you frustrated that shorter dated TIPS have made no money, while anyone who bought longer TIPS lost a bundle? All bonds lost money this year but TIPS were supposed to make money. And they didn’t. This very frustrating outcome is counterintuitive. In this article I take a look at WTF happened to TIPS this year, and if there are any lessons from the unfavorable outcome this year, for future investment conclusions. Unfortunately, the topic is complicated and the author requests patience from the reader. (NB: All hyperlinks actively point to source data).

Why is it important to understand TIPS today?

The last era of sustained high inflation was from the late 1960s to the early 1980s. There were no investment products to directly protect investors from inflation in those days. TIPS were issued by the Department of Treasury starting in January 1997 as a mechanism to protect against inflation.  For the first time, both TIPS and high inflation co-exist. If there is an investment to do in TIPS, we should figure it out.

TIPS as an Asset Class

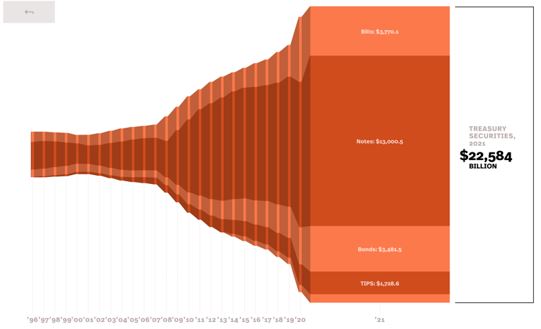
TIPS are a big asset class, they directly benefit from rising inflation, carry the safe credit risk of the US Government, and the fees on some TIPS funds are very low. As of June 2022, there is $1.8 Trillion of TIPS outstanding. About $222 billion are invested in TIPS mutual funds and ETFs. Besides Social Security adjustment and Series I bonds, there are no financial instruments that directly offer inflation protection. Some investors may be able to purchase inflation linked infrastructure assets through private vehicles.

https://www.sifma.org/resources/research/fixed-income-chart/

By Morningstar’s calculation, there are 49 inflation-protected bond funds and 18 ETFs. Of those, 59 have lost money in 2022, six returned a small fraction of one percent and two are thriving. You might be forgiven for asking: “why is my inflation-protected bond fund not protecting me from inflation?” Excellent question, but you’ll have to be a bit patient as you work through the two factors – the structure of TIPS and the notion of “real yields” – that explain why they’re floundering. We’ll start with the basic notion of the “inflation” calculation that lies behind this all.

Inflation

Inflation, or higher prices in the economy on goods and services, is a curse on those who have thoughtfully saved cash today with the plan to consume the fruits of their labor in the future. We tolerate inflation not because we are blind to it, but because we are financial adults who don’t want to put on tin foil beanies. We understand a little greasing of debt through inflation keeps the system in place. We want TIPS in our portfolio to reduce this loss of purchasing power if little inflation becomes big inflation.

Consumer Price Index (CPI-U)

Some details from the Treasury on the index used for measuring inflation that goes into TIPS.  

TIPS are securities whose principal is tied to the Consumer Price Index … based on the non-seasonally adjusted U.S. City Average All Items Consumer Price Index for All Urban Consumers (CPI-U) published by the Bureau of Labor Statistics of the U.S. Department of Labor…

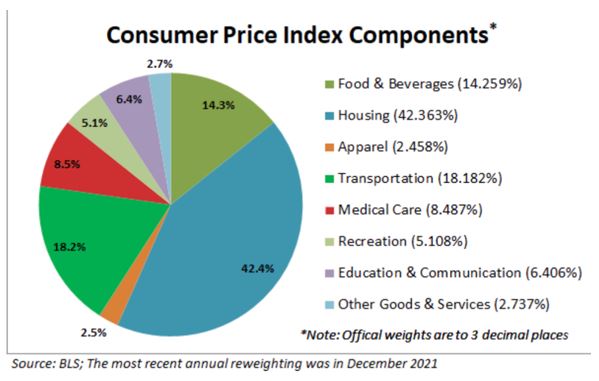
CPI Basket:

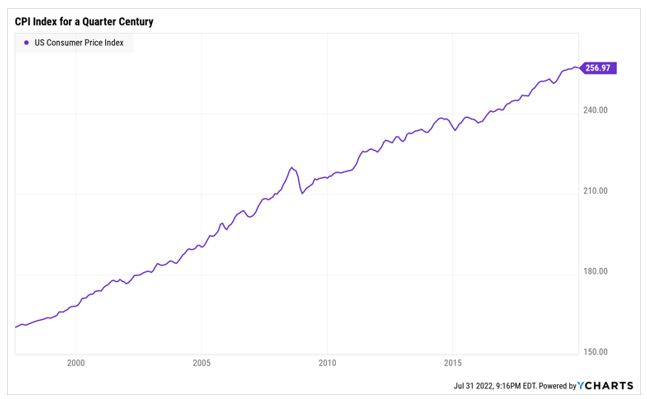
CPI-U for the last 25 years:  

The December-December price changes in the CPI-U can provide the rate of inflation in a year:

The steady inflation rate of around 2% for the last 10-20 years has shot up to 7.04% in 2021 and is expected to end in 2022 at around 8-9%. We can say that in 2 years, the value of a dollar would be 15% lower when compared to a basket of goods and services defined by the CPI above. Inflation is no joke. We all feel it. The Federal Reserve is committed to bringing inflation down to 2%.

Understanding TIPS by taking apart TIPS

For many of us, the intricacies of bond auctions are alien territory where they speak (sometimes quite quickly) a foreign language. To help ease you into understanding the limits of TIPS as an investment option, let’s look at the details of just one individual bond.

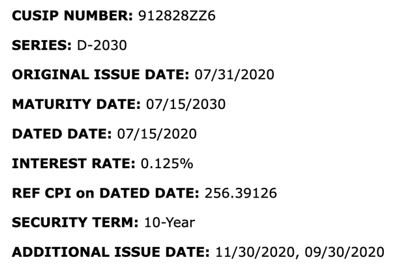
We’ll call her Lucille, as in Kenny Roger’s classic, “you’ve picked a fine time to leave me, Lucille.” Technically she’s CUSIP Number 912828ZZ6 but only the Committee on Uniform Security Identification Procedures cares. Here is Lucille’s bio:

Example: CUSIP Number 912828ZZ6

  • Lucille is a 10-year maturity TIPS with an Original Issue Date of 31st July 2020 (2 years ago) and a Maturity Date of 7/15/2030. The Treasury reissued this exact bond twice more in 2020 to increase the supply of this TIPS.
  • When TIPS are issued, like all bonds, there is a fixed coupon attached. The Interest rate (fixed coupon) on this bond was a paltry 0.125%, or almost zero.
  • Reference CPI on Dated Date: Each TIP has a Reference CPI, which will stay with this bond until maturity. The Reference CPI is a lot like the daily value of a stock index. On July 31, 2022, the Dow Jones Industrials Index closed at 32,845.13. That same day, the Reference CPI number was 292.1931. The difference between the Reference CPI when a bond was issued and the current Reference CPI controls the bond’s yield.
    • This Base is the CPI-U lagged by 3 months. So you don’t get the value current on the day the bond was issued, you get whatever the value was three months earlier. So …
    • This TIP was issued in July 2020 & the reference CPI (256.39126 ) is from April 2020.
  • The Treasury calculates a Reference CPI every day lagged by 3 months to create an Index Ratio. That’s just today’s Reference CPI divided by the Reference CPI on the date the bond was issued.

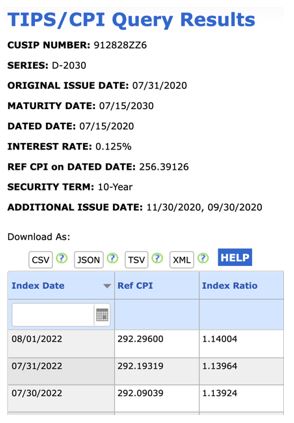
The Treasury Department maintains a webpage with the Issue details and Index Ratios for every single TIP issued. Here are the Index Ratios for Lucille for every single day since the bond was issued. I’ve zoomed into the file to look at the July 31, 2022 Reference CPI.

  • For 7/31/2022, the Ref. CPI is 292.1931
  • The Index Ratio = Today/Dated Date = 292.19319/256.39126 = 1.13964

The Index Ratio tells you how much your bond is worth today. Your principal grows directly with the Index Ratio. For example, if a $1000 TIPS matured with Index Ratio = 2, the TIPS holder would receive twice the face value of $1000, or $2000. The fixed interest (the paltry 0.125% in this case) is paid on the Accrued Principal. As the principal grows, the fixed interest payment also grows.  

Here’s the good news on the Lucille front: principal Accrual now stands at 114% since it was issued 2-years ago. Important: Investors have made 14% in this bond because of rising inflation. Since the recent CPI prints have been high, Principal Accrued will pick up the pace, though subject to the three-month lag we talked about.

The subtle thing to understand with TIPS is that the cash flow accumulates in the principal and is not paid out in interest income each year. Your 14% gain is purely hypothetical right now, you won’t see it until you redeem the bond.

Bad news on the Lucille front, then: your $1000 investment is churning out $1.75 for you.

Worse news on the same front, the IRS however wants their money now.  Unburdened by reality, the Internal Revenue Service treatment of interest income assumes that the cash was received this year (even though it was not). The IRS treats this Principal Accrued as taxable interest income, making life hard for TIPS owners.

The only actual cash interest that TIPS pay semi-annually is based on the Interest Rate, 0.125%, which is paid on the Accrued Principal. The IRS counts this as taxable interest as well.

TIPS design is complex, pushing individuals to hold TIPS through Mutual Funds and ETFs. TIPS funds collect the fixed coupon interest and monetize the Principal Accrual embedded interest by selling some TIPS from the portfolio.

From the prospectus of Vanguard Short-Term Inflation Protected Securities ETF (VTIP)

…a fund holding these securities distributes both interest income and the income attributable to principal adjustments each quarter in the form of cash or reinvested shares (which, like principal adjustments, are taxable to shareholders). It may be necessary for the fund to liquidate portfolio positions, including when it is not advantageous to do so, in order to make required distributions.

Quick recap: you face no credit risk but your bond payout is measly, lags inflation, and is getting overtaxed by the IRS. I don’t want to worry you, but it sort of gets worse from here as we start trying to understand Lucille’s “real” yield.

REAL Assets have REAL Yields: The Market Price of a bond is based on discounting the Cash flows promised in the bond to the current interest rate. This discounting rate is called YIELD. In the case of TIPS, this yield is called REAL YIELD.

Price, Coupon, and Yield form a mathematical relationship. Given any two, the third can be calculated. The reference to REAL is part of the language of finance and economics where anything adjusted for inflation is called REAL and anything left unadjusted is called NOMINAL.

Auction details of our above-mentioned TIPS 10-yr Bond.

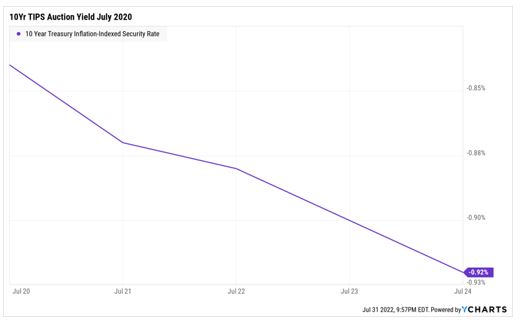
We knew the Interest Rate (coupon) was 0.125%. For the Face Value Price of $100, the Issue price was ~$111. Using price and coupon, we calculate the Real Yield. It was -0.9% at auction time. Investors were willing to receive the CPI minus 0.9%, from the US Government for the next 10 years at auction time. They did so by paying $111 for a $100 10-yr TIPS bond.

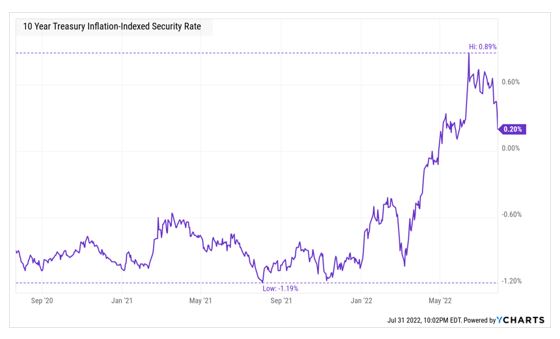
In 2020, trillions of Dollars, Euros, Pounds, and Yen of Government Bonds were issued with Negative Yields to savers clamoring for safe government bond assets in the aftermath of the Covid-19 crash and lockdowns. We can eyeball the Real Bond Yield on the 10-yr TIPS on this chart. The inflation created through the money printing which followed has since changed the interest rate landscape.

From a low of -1.2% in August 2021, TIPS yields rose to +0.89% in June 2022. Currently, the 10-year TIPS yield is +0.20%. This increase in Yields lowers the price of TIPS bonds.

Chart of 10-Year TIPS Real Yields over last 2 years:

Bonds, Yields, and Duration Risk

Duration Risk says that the longer a bond’s maturity date, the more sensitive the bond is to changes in market yields. Yields go up, Bond prices go down. Duration can roughly estimate the price change from changes in yield. When the yield is close to zero or negative, the Duration is high. A small change in yields causes a big change in price. A 10-year TIPS bond also had a duration of about 10 years. According to the WSJ TIPS Bond page, the Real Yield on the bond as of this Friday, July 31st, 2022, is +0.06%

At Issue, our TIPS Real Yield was ~ -0.9%

End of July, TIPS Real Yield ~ +0.06%

Yield Change = Increase of 0.96%

Duration ~ 10 years

Rough approximation for change in Bond Price ~ .96% * 10 ~ $10


The TIPS Bond is priced at $100.13, about $11 lower, than the Issue price.

This is in line with our $10 loss on the bond from Duration and yield change.

Important: Price drop from TIPS bond REAL Yield increase: -11%

Recall: Price Accrued from CPI increase: +13.9%

Total Return on our TIPS bond over 2 years: +2.9%

That’s a whole lot of work for not much return. Investors who purchased a 10-year TIPS bond two years ago were correct in their assessment of higher inflation but incorrect in the price they paid for this bond!! The Negative Real yield at Issuance and the change in yield since then have been problematic.

So far, we have understood how TIPS track CPI, and what happened to a 10-year TIPS bond over the last two years since issuance. At least, we understand WHY TIPS have tracked CPI but not generated total returns in line with CPI.

What about the future? Are yields high enough now? And are TIPS likely to deliver in the future?

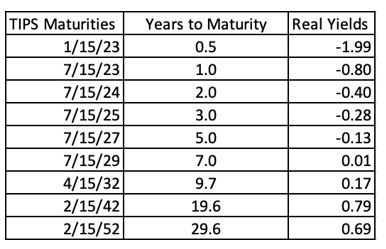
TIPS Real Yields as of 7.31.2022: From the WSJ, I have created a table of TIPS maturities from 6 months to 30 years and the corresponding real yields.

It shows that TIPS under 7 years of maturity still have Negative Real Yields. Longer-dated TIPS now have positive yields. We need to take a look at historic real yields to get some idea of how high yields can go. We don’t want to repeat the mistakes of the past. We don’t want to be right on CPI and wrong on Yields.

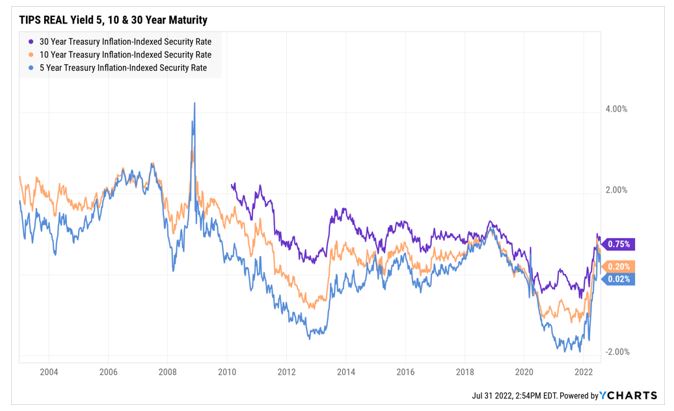
Long-Term Chart of Real Yields: Here is a chart of TIPS real yields for the last 2 decades.

TIPS are only issued in 5, 10, and 30-year maturities and I could not find a shorter dated (2-year maturity) TIPS real yield.

We can observe that yields have bounced from negative to positive. The 5 and 10-year TIPS Real Yields are slightly above zero, and the 30-year TIPS is 0.75% positive. What would make the Yield go higher?

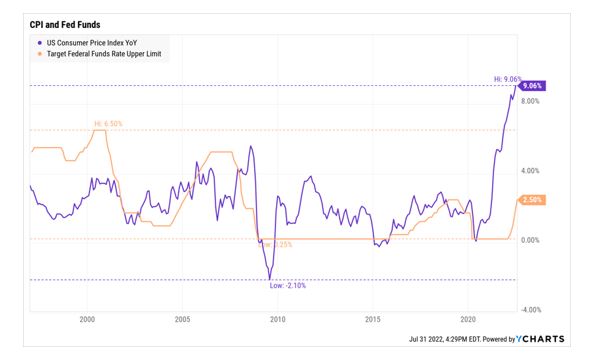
Well, of course, inflation. The higher and stickier inflation is, the more the Federal Reserve is likely to keep raising the Fed Funds Target Rate. The higher the Fed Fund rate, the higher the yields will be on both Nominal Bonds and TIPS. It would not be a crazy assumption to think that Real Yields could go up 1% across the board. The 5 and 10-year TIPS Real Yields could be 1% and the 30-year could be closer to 1.5-1.75% if the Federal Reserve kept raising interest rates. This could hurt TIPS Bond prices again.

Chart of Fed Funds Target Rate and the CPI

The Future may look like the Past: Making TIPS Not Yet Attractive

We may be caught in a doom loop where an investment in TIPS continues to be the only one that directly benefits from increasing inflation. And that same inflation will lead to Federal Reserve tightening aggressively. Real yields (and all yields) will trade higher and hurt the bond prices from duration risk.  Any joy from CPI increases might be taken away from future bond yield increases!! What a bummer. Unfortunately, we are at the point in the road where we realize investing in bonds is never that easy. 

What would still make it interesting to invest in TIPS?

The scenarios would be:

  1. If Inflation kept going up, but if the Fed did not raise rates because the economy was collapsing. Real Yields might stay where they are. Stagflation would help TIPS. {I think Fed will sacrifice the economy to rein in inflation}
  2. Real Yield went up, but the CPI rose even faster. Whatever one lost in Bond Price, one more than made in Principal Accrued. {This could only work in short-dated TIPS where bond duration is low, and I think this is the best case for TIPS investing here}
  3. A version of Scenario 2 in which CPI stays high for a decade, Fed raises Rates, and Real Yields go up to 1.5-2% but peak there. {For the patient investor the increase in CPI from Principal actual can eventually overpower the drop in bond price from Yield increases}
  4. If an investor decided to buy a 30-year TIPS because CPI + 0.75% or a 10-year TIP at CPI + 0.2% was good enough for their money, and they would hold the bond to maturity. {If CPI came in at 3 or higher, this would be a decent outcome. It’s important to hold to maturity and not look at the bond price in between.}

Conclusion

When I started writing this article, I was convinced the answer was to invest in TIPS. It might still work but there isn’t enough room for error. Real Yields are still negative (less than 5 years maturities) or barely positive (from 5-10 years maturity). The Federal Reserve is likely to raise rates further. This will not help Bond Yields, whether in Nominal Treasuries or TIPS Bonds.

Short-term TIPS buyers (2-3-year maturities) need CPI of about 3.5 – 4% to overcome the Negative Real Yields and earn 3-3.5% per year in Total Returns. Long-term TIPS buyers (10-30 years) need to buy and hold to maturity to overcome the Duration risk from rising Real Yields.

In both cases, it seems better to pass on TIPS now, wait for Real Yields to create a margin for error, and then enter the investment.

It is true that TIPS are supposed to be the best tool for dealing with inflation. Unfortunately, the investment recommendation is not as obvious.

To the reader: If you are a bond fund manager, discretionary investor, or macro analyst, I would love to see what scenario you think makes it worthwhile to be invested in TIPS. My email is [email protected] You can also contact me for any source data you need more details on or if you disagree with the analysis.


Further Deliberations for bonds: Breakeven Inflation Rates

Comparing an asset against its own history and possible outcomes is one way to investigate investment fitness. Sometimes, one compares against the Opportunity Cost. Bond market investors compare TIPS to Nominal Treasuries to decide which is better.

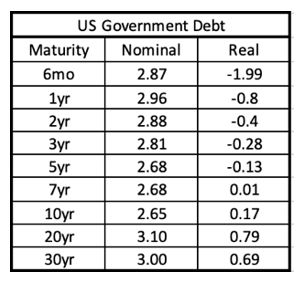
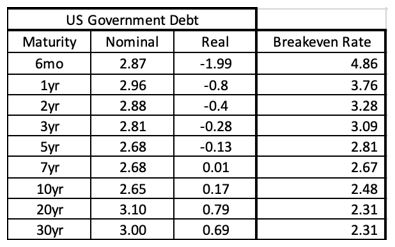
Table of similar maturities Yields of US Government Debt for both Nominal Bonds and TIPS:

Computing TIPS/Treasury Breakeven Inflation Rate: Both TIPS and Nominals trade in their independent bond market but when they are looked at side-by-side, they can be helpful in divining the expected annual CPI projected in the bond market for a given time period. This is called the Breakeven Inflation Rate. For E.g., currently:

10-Year Treasury Nominal Yield = 2.65%

10-Year TIPS Real Yield = 0.17%

10-Year TIPS/Treasury Breakeven Rate = Nominal – Real = 2.65% – 0.17% = 2.48%

Total Return from Nominal Treasuries would equal the Total Return from TIPS when the next 10-year average annual CPI = 2.48%. Investors must believe CPI over the next 10 years will be higher than 2.48% on average to own TIPS. We can expand the above table and calculate the Breakeven Inflation Rate for the next 30 years of bond maturities.

This tells us that CPI is expected to be high over the next few years but as time goes by, investors expect the US economy will experience CPI more or less consistent with the 2% history. Each investor needs to calculate what they think the CPI will be.

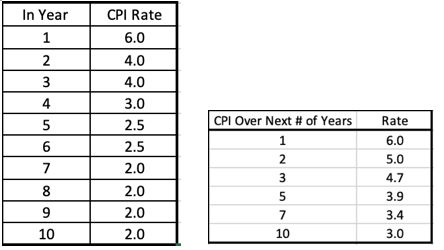
Let’s create a hypothetical path for CPI where inflation stays sticky for a few years:


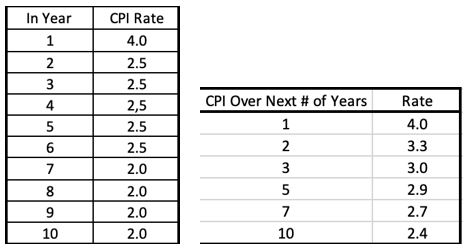
And a hypothetical path where inflation comes faster under control:

Comparing the two hypothetical paths and the average CPI over a given number of years to the Breakeven Rate tells you how important it is for CPI to be high and sticky in the first few years for the TIPS investment to pay off compared to Treasuries. In a world where CPI slides down to 4% and tapers down to 2.5% in future years before tailing off at 2% leaves you with equal Total Returns between Treasuries and TIPS. In all likelihood, the Bond Market has the prediction for the 2nd hypothetical path for the US economy. It’s not a crazy path. TIPS still offer a call Option to inflation, but that’s about it.

Next, we look at Fund flows to determine where Investors are positioned in TIPS.

TIPS Mutual Fund/ETF Flows:

TIPS funds can be thought of as broken down into 3 maturity buckets: short, medium-term, and longer-dated. Most funds have a portfolio of TIPS with varying maturities.

The iShares TIPS Bond ETF (TIP)

We can use the Effective Duration of the Bond Portfolios for the three time-bucketed categories.

Short Dated TIPS: The average fund’s Total Return YTD is slightly below zero. It’s attracted about $9.5 billion in Assets this year and the current AUM of short-dated TIPS funds is about $62 billion. In the last 1-month, people have been exiting shorter TIPS.

Medium Term TIPS: The average fund’s Total Return YTD is 5% and the price return is -7%. It’s lost about $7.5 billion in Assets this year (probably because this group of funds is losing money) but it still has a current AUM of $159 billion. In the last 1-month, people have been adding into medium TIPS, probably attracted by recently no longer negative real yields.

Long Dated TIPS: The average fund’s Total Return YTD is a devastating 21.7% and the price return is -25.3%. This is a small category with only $ 1 billion in AUM and has lost $400 million in assets this year. Not many want to touch this area.

Given that the Total TIPS issuance by the Treasury is $1.8 Trillion and the fund holds about $220 Billion, it’s a rough 12% of the market share. Insurance and pension companies must hold a lot of TIPS as buy and hold to meet long-dated obligations.

Differences between Total Returns and Price Returns in TIPS and what it means for investors

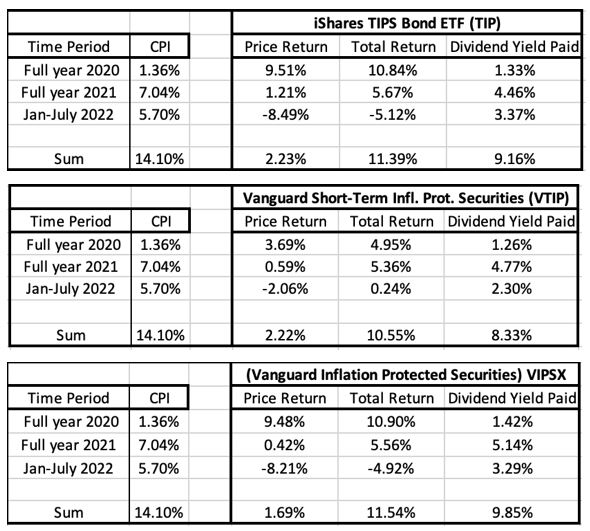
Since funds pay all dividends to investors, sooner or later, all CPI-linked Principal Accruals and Interest earned should make its way to the shareholders. A quick look at the difference between Total Returns and Price Returns from the 3 categories above makes me wonder what’s going on? YTD, the Dividend Yield paid out, or Total – Price Returns seem low compared to the CPI accumulated thus far this year (5.7% in 2022). And why the difference between funds of different maturities?

As investors, if we are going to use TIPS to be invested in the Asset class, we are hoping to get the Cash flow from the CPI-led Principal accrual. I am sure it will come, but funds could do more to deliver it.

Comparing Historical CPI with Historical Dividend Yields (Total – Price Returns)

I have chosen 3 Representative TIPS ETF and Mutual Funds. I have highlighted the CPI accumulated each year for 2020, 2021, and YTD 2022. I have also highlighted the difference in Total less Price Returns for each year for these funds. The hope is that the CPI should over time match the Dividends paid. The relationship has broken down after 2020.

Is there a reason why 2021 CPI and Dividends should have differed this much, and it doesn’t look like they’ve caught up in 2022 either? Looking at the VTIP prospectus, here is the dividend schedule:

It seems that the dividends are loaded in the last quarter of the year. Suppose that’s right for 2022. That should mean that investors holding TIPS funds should expect a decent distribution at some point later this year to make up for not just the high CPI this year but also the gap from last year. Arguably, there is a 3-month lag for Index Ratios so patience would help.

From a fund investor’s perspective, the TIPS asset class is less easy than I had expected it to be. It’s not just that the returns are problematic – that one can say is due to Real Yields going higher. The deficit in dividends compared to CPI is a problem. I’d like to understand why the gap exists.

Ultimately, higher Real Yields and a good Fund distribution mechanism should be the way to play TIPS. When the ducks line up, I’ll be there.

New Coke, the Ford Edsel, Cheetos Lip Balm and Morningstar Investor

By Editor

By Don Glickstein, the author of this article, which we’ve posted for him.

(Editor’s note: Glickstein worked for a decade as a reporter and editor on daily newspapers, and he won a National Press Club award for consumer journalism. He dipped his toes into politics as a campaign press secretary for the late Washington Gov. Booth Gardner. He later worked for nearly three decades in communications for what was then the nation’s largest consumer healthcare cooperative, now part of Kaiser Permanente. While there, he served as an intranet webmaster reaching 10,000 employees. His book, After Yorktown, was named one of the 100 best books ever written about the Revolution by the Journal of the American Revolution.)

Like many Mutual Fund Observer readers, I’ve often used Morningstar to research funds. My old T. Rowe Price brokerage even paid for a subscription (probably in penance for offering an inadequate, third-party platform to begin with).

When I left the T. Rowe brokerage debacle, I started paying for an M* subscription out of my own pocket at $249 a year. It was worth it to me because of its analysts’ reports, the great personal-finance reporter Christine Benz, and its fund-comparison tools.

Several years ago, however, M*’s website started losing functionality. Where once, I used to be able to compare the year-by-year total return of funds for the past 10 years—helpful in seeing how funds negotiated the market collapses of 2000 and 2008—that feature disappeared. Where once I used to be able to see what a bond fund’s 30-day SEC yield was—vital for understanding the current reality—that data element disappeared in favor of the retrospective trailing 12-month yield.

At times, I wasn’t able to use the site with Safari on my iMac. I’d complain to its offshore customer service and would get boilerplate answers to use Chrome or Firefox. A week later, the site would be working again on Safari.

I complained about the deterioration to executives at M*, and one told me that the company is completely changing its website, and asked if I would like to be a beta tester. Yes, I would, and I’ve had access to M*’s new platform for more than a year now. Over time, I sent a bunch of bugs and missing functionality I identified to the project team, as well as missing features. In some instances, the M* team made repairs.

For example, when it introduced its new portfolio tool, it only allowed you to use it if you linked your outside brokerage and bank accounts to M*. I was unwilling to do that in this day and age when hackers seem to break into purportedly secure websites with impunity and steal protected personal information. Eventually, the M* team added the ability to add portfolios manually—just like the existing site allows.

And yes, it returned the 30-day SEC yield to fund pages. Hallelujah.

This year, M* announced it would retire the existing portfolio manager “sometime this year,” changed the name of its website from “Morningstar” to “Morningstar Investor,” and started urging customers to use the still-beta version of the new portfolio tool, as well as the new fund screener and comparison tools.

With more people using the beta, more people discovered that it wasn’t ready for prime time. In his July MFO letter, David Snowball wrote an “in memoriam” for the fund screener, saying it was “dumbed down to near uselessness,” with reduced functionality and screening criteria. When he tried to contact M*, he got a boilerplate form letter.

In various chatrooms, M* customers complained that the company didn’t care about individual investors anymore. One poster said, “M* screwing everything up again.” Another: “M* has repeatedly indicated that it doesn’t care about individuals and what they think.” In M*’s own chatroom, a customer complained, “What has been basic to the M* website is now considered an ‘enhancement’.” Another: “There is no point in complaining about this. Morningstar clearly does not give a d@mn about their Premium Subscribers and probably wish they would go away. … Customer support has gone offshore and has become absolutely abysmal and frustrating.”

I’ve had my own experience with M*’s customer service—an impenetrable reply I got to my 30-day SEC yield complaint: “We have now received a revert from the concerned team and they have confirmed that this is as intended. After we replaced the SEC Yield with TTM (sometime in July), many clients complained and then the product team reviewed this and came up with the below logic which is already implemented: When we have SEC Yield data (value) in our database – we display SEC Yield.” Don’t we all wish we could get a “revert.”

After reading Snowball’s “in memoriam,” I realized that I wasn’t alone, that other people were as frustrated as I was.

The new M* website had all the signs of turning into the New Coke, subprime liar loans, the Edsel. It was the Charles Schwab brokerage after now ex-CEO David Pottruck started nickel-and-diming customers, but before he got canned. The new M* website was crap, amateur, and poorly designed.

And that’s what I told M* CEO Kunal Kapoor because you never know how removed a CEO is from the debacles being made in his name. Kapoor replied promptly:

“I appreciate your candor, and we will get you to a better place with the new tool.”

He referred me to the head of the newly renamed M* Individual Investor, Adley Bowden, who began at M* a little more than a year ago, according to his LinkedIn page.

Bowden conceded that M* had created “a lot of headaches across a group of long-term customers who deeply rely on the legacy portfolio tool. Good news is websites really are not that hard to build, Morningstar has all the data and research people need[ed], we have no shortage of passionate customers such as yourself providing input, so with some time, I am confident that Investor’s portfolio tool will be viewed as superior to the current legacy portfolio tool.”

We later talked for about a half hour over the phone. (Disclosure: I did tell him I might write this article.) The purpose of the redesign, he said, is to grow and attract a “wider swath” of individual customers. Although M* had devoted a lot of resources to institutional investors and financial advisers, the website redesign is aimed at individuals.

Unfortunately, he said, the company couldn’t simply port over all the elements of the legacy platform. The company had to take a step back before it went forward. It’s a “matter of time” before most of the data points in the current website are ported over to the new one.

Regarding the complaints about the offshore call center, he conceded that M* has a lot to improve.

From my perspective, M* should never have released the beta version to the public before they fixed the majority of bugs and ported over more data points.

I missed being able to add something as basic as effective duration to a portfolio of bond funds.

The new platform removed interactive charts from individual fund pages in favor of a separate link to a more robust interactive chart—but you have to re-enter the fund you’re interested in. For the fund screener, the data points for “distinct portfolio only” and brokerage availability have yet to be restored. While the ability to export a portfolio was just added in late July, there’s no way to set a default view for portfolios, something Bowden promises is coming.

On the individual fund pages, M* went with a designer fad to combine all the information on one long, never-ending screen, but the designers didn’t have the competence to add a floating “top-of-page” link.

That’s just one research-based best practice the designers apparently never heard of. The great Yale University information scientist Edward Tufte talks about the need for dense data to provide the best value to readers. The M* redesign is committed to the opposite: Fill every page with unneeded white space, enormous graphics (some of them only for show), and tables that are so bloated with unneeded space that they spill off the screen. Bowden conceded that the ability to print a portfolio table is still on their to-do list.

One unfortunate element the designers did port over from the current site is the use of “upstyle” headlines, an archaic remnant of 19th-century mechanical typesetting that interferes with readability by interrupting eye fixations by using random capitalization. It also interferes with comprehension by making it difficult to differentiate proper names of people and companies from generic nouns. (Full disclosure: MFO also uses upstyle headlines that often result in ambiguity. For example, in the July issue: “New Income: New Adventures, New Opportunities.” The reader can’t tell if the article is about new sources of income, or a fund named New Income.)

Incomprehensible X-rays

The M* designers’ incomprehensible obsessions with making information harder to read reaches its epitome on the portfolio “X-ray” pages, which aggregate the underlying portfolio holdings. The existing X-ray has a small pie chart showing the percent of the portfolio allocated to stocks, bonds, cash, etc. But then, it breaks down each holding by allocation. The redesign not only eliminates the details by holding, but instead of using a simple pie chart to illustrate the aggregate, it uses an enormous donut chart, with the hole in the middle creating a distracting graphic element. The donut chart is a bad design, but the designers wanted to mark the tree with their own pee.

A cynical, anti-consumer element of the new design is the link to the so-called “Help Center.” Click on the link, and you’re kicked out of the main M* site you’re already signed into, and you’re in a different platform altogether that asks you to sign in.

The Help Center is an unmoderated chat room.

But the “Help Center” has nothing to do with help. It’s an unmoderated customer chat room with no links to M* customer service. What’s worse is that this faux “Help Center” is called a “community”—tech-industry code for “We don’t want you to contact customer support, so we’re disguising postings by other frustrated customers as a warm-and-fuzzy ‘community,’” which, of course, it’s not. 

It’s management-fad jargon. Calling the chat room a “help center” is like Trump saying he won the election, or that his former foundation was charitable. He didn’t, it wasn’t, and the new M* “help center” isn’t.

This isn’t a case of needing time to port over data elements or fixing bugs. Substituting customer chats for customer service is a faulty concept to begin with that management should have nixed from day one.

I could go on and on. The third-party “feedback” tool is geared toward teenagers, requiring you to use emoticons to express your feelings. When you save holdings in your portfolio, you have to click two separate save buttons. The “crowd sense” element—which predated Bowden—seems to be all about momentum investing, more suitable for Robinhood and its infamous confetti. I’d like to see if a down-to-earth reporter like Christine Benz would recommend it for anything other than timing markets. On fund pages, links to other share classes were eliminated. And there’s no link to the fund-family website.

I urged Bowden to continue the legacy site past M*’s announced end-of-the-year deadline because I’m skeptical that the company can fix it by then. I suggested that he might have to end up like Elon Musk, sleeping on the factory floor to make things right.

I’m still willing to give M* the benefit of the doubt, despite its insulting idea of what a “help center” should be, its condescending history of removing data points like SEC 30-day yield and effective duration, and its designers who clearly don’t understand evidence-based communication.

Bottom line: I’m impressed that Kapoor and Bowden were willing to spend time with me. I think they’re sincere in resolving the issues. I told Bowden that I’d be a much happier camper if they addressed seven issues: effective duration, better navigation, customized defaults, a more accessible interactive chart, modernizing the headline style for greater readability, fixing the design of the portfolio X-ray, and providing a true help center that shares the same platform.

I’m rooting for M* to succeed because we need independent voices.

The 100 Club?

By Charles Boccadoro

In our April 2021 commentary, David highlighted: “The Total Stock Market Index is up 62% in the past 12 months. 291 funds (and uncounted ETFs) have 12-month returns in excess of 100% …” By the end of the bull run in December, that number had grown to 730 mutual funds and 1102, including ETFs. The S&P 500 ended up 90%.

If we examine just US & Global Equity funds and ETFs but exclude trading (e.g., leveraged) and sector funds, The 100 Club tallied 705 or more than a quarter of the 3000 products available in the US.

Here are the top 15, by absolute return, from our MultiSearch screener:

The list includes two funds by legendary growth investor Ron Baron, Partners Retail [BPTRX] and Focused Growth Retail [BFGFX]; two by disruptive investor Dennis Lynch of Morgan Stanley’s Counterpoint Global team, Global Endurance [MSJIX] and Inception [MSSGX]. Dennis was awarded Morningstar Manager of the Year in 2013 and, more recently, WSJ’s Winners’ Circle; and two by Hodges, as Top Rated family on MFO’s Fund Family Scorecard.

Of this list of top 15 funds, most are mutual funds, most are small cap, and ALL are actively managed. Six funds actually made The 200 Club. One made The 300 Club.

In David’s article, he actually cautioned investors: “… this is no time to be a hero.”

Here are the year-to-date numbers for the same 15 funds, sorted worst to best:

Needless to say, there is no 100 Club year to date or the past 12 months. Going back to early 2020, just before Covid changed the world? Ron Baron’s are its only members. And for that, he can thank the courage of his conviction with TSLA.

Briefly Noted . . .

By TheShadow

ARK Transparency ETF will liquidate on or about July 26. Poster/Contributor Yogibear noted that the official reason for the closure was due to the Transparency Index provider, Transparency Global, discontinuing the index utilized for the ETF. ARKK was unable to find a replacement. The ETF was launched approximately eight months ago when it commenced operations on December 8, 2021.

Champlain Emerging Markets Fund was closed to new investors on July 1. The advisor, Champlain Investment Partners, LLC, announced its intent to exit the emerging markets asset class. The board is considering the best course of action for the future of the fund, which may include being liquidated.

Responsibility for the $3 billion Fidelity Series All-Sector Equity Fund is currently shared by ten managers. Well, nine … John Mirshekari no longer serves as a co-manager of the fund. By year’s end, eight or seven: Bob Stansky and Jody Simes are both scheduled to depart on December 31, 2022. But add one back! Christopher Lee joins the team in August 2022. And Fidelity avers that Chad Colman has managed the fund since July, but he doesn’t yet appear on the Morningstar roster.

The God Bless America ETF is in registration. Its investment strategy consists of selecting U.S. listed equity securities of companies using a proprietary research system. The sub-adviser analyzes an initial universe of large-, mid-, and small-capitalization companies with market capitalizations of at least $1 billion and then screens out companies that, in the sub-adviser’s assessment, have emphasized political activism and social agendas at the expense of maximizing shareholder. For example, the sub-adviser will generally exclude companies that make public statements about a then-current political hot button item unrelated to their business (e.g., companies that issue press releases in response to U.S. Supreme Court rulings). The sub-adviser analyzes information from company regulatory filings (e.g., annual reports), company communications (e.g., press releases), and related media reports. Michael Venuto, Charles A. Ragauss, and Adam B. Curran will be the portfolio managers. Expenses have not been stated as of yet in the registration filing.

Vanguard Group, Inc, has settled with the Massachusetts Secretary of State concerning its popular target-date retirement funds. In December 2020, Vanguard reduced the minimum investments for its institutional investors. This change triggered an outflow from its higher-cost funds, which resulted in the funds selling securities and generating capital gains for investors with taxable accounts. Vanguard did not admit any wrongdoing in the case. The settlement includes $5.5 million to Massachusetts investors holding taxable accounts and $750,000 to the State of Massachusetts.

On July 29, 2022, William Blair launched the institutional William Blair Emerging Markets Ex China Growth Fund. It will be managed by a three-person team who is also responsible for the firm’s EM and China strategies. It’s less interesting in its own right – the $500,00 – $1,000,000 minimums limit that interest here – than it is as a harbinger of the impulse to create EM funds that are not entirely driven by China.

Small Wins For Investors

Okay, this month, let’s rebrand as “Small Losses for Investors” to celebrate the launch of leveraged and reverse leveraged single stock ETFs. Leverage and shorting are dangerous and expensive games, generally practiced by the rich and stupid. GraniteShares now brings the destructive potential of guessing wrong to the masses with the launch of:

GraniteShares 1.25x Long TSLA Daily ETF TSL
GraniteShares 1x Short TSLA Daily ETF TSLI
GraniteShares 1.5x Long NVDA Daily ETF NVDL
GraniteShares 1.1x Long NIO Daily ETF NIOL
GraniteShares 1.5x Long COIN Daily ETF CONL
GraniteShares 1.75x Long BABA Daily ETF ALIB
GraniteShares 1.5x Long META Daily ETF FBL
GraniteShares 1.75x Long GOOGL Daily ETF GOOL
GraniteShares 1.5x Long AMZN Daily ETF AMZZ
GraniteShares 1.75x Long AAPL Daily ETF AAPB
GraniteShares 2x Long MSFT Daily ETF MSFL
GraniteShares 1.25x Long AMD Daily ETF AMDL
GraniteShares 1.25x Long PLTR Daily ETF PTIR
GraniteShares 1.25x Long TWTR Daily ETF TWTL
GraniteShares 1.5x Long UBER Daily ETF UBRL
GraniteShares 1.5x Long DIS Daily ETF DISL
GraniteShares 1.25x Long F Daily ETF  

Each ETF is benchmarked against a single day’s price change in the target stock, making the appropriate holding period never.

Old Wine, New Bottles

Effective on or about September 16, 2022, Angel Oak Financials Income Fund becomes the Angel Oak Financials Income Impact Fund. The redrawn strategy for the renamed fund:

The Fund will principally invest in investments that the Adviser believes have positive aggregate environmental, social and/or governance impact outcomes … the Fund may invest in debt securities, including bank-issued subordinated debt, unrated debt, senior debt, preferred securities, high yield securities and TruPS; equity securities, including common equity, preferred equity, convertible securities and warrants; [and] Structured Products.

Conductor Global Equity Value Fund will be converted into the Conductor Global Equity Value ETF. Shareholders of Class A, Class C, and Class I will have their shares converted into Class Y shares effective July 25, 2022.

EP Emerging Markets Small Companies Fund will change its name to EP Emerging Markets Fund. Champlain Investment Partners, LLC will no longer serve as the sub-advisor to the fund. Euro Pacific Asset Management, LLC will serve as the advisor to the fund. The management team will consist of Luke Allen, CFA, Portfolio Manager of the Advisor, and Patrick Rien, CFA, Co-Portfolio Manager and Senior Research Analyst of the Advisor.

Litman Gregory has announced plans to change iMGP Equity into iMGP Global Select Fund, effective at the end of September 2022. The new version might invest up to 75% in non-US equities but doesn’t have to. iMGP remains one of the industry’s dumbest branding decisions, unexplained even in the 2020 press release that announced the new name. We know only that it “better reflects the collaborative approach it employs.” The logo breaks it into iM Global Partner, which doesn’t materially improve anything.

Effective July 29, 2022, Matthews Asia ESG Fund has become Matthews Emerging Markets Sustainable Future Fund. Coincidentally, Morningstar just dropped analyst coverage of the fund, noting “demand for Matthews Asia ESG MISFX was tepid and so was its investment proposition.”

Roundhill BITKRAFT Esports & Digital Entertainment ETF (ticker: NERD) has been rebranded Roundhill Video Games ETF. Niche funds are about impossible to benchmark in any meaningful way. Morningstar calls it a “consumer cyclical” fund, and it trails 95% of its “peers” in both 2021 and 2022.

Effective September 1, 2022, Tortoise MLP & Energy Income Fund becomes Tortoise Energy Infrastructure and Income Fund.

Closings (and Related Inconveniences)

BNY Mellon Sustainable Balanced Fund will be liquidated on November 15, 2022. The fund had drawn just $15 million across two share classes despite a Morningstar rating of “Bronze” and an above-average long-term record.

Certeza Convex Core Fund was liquidated on or about July 26.

Easterly Global Macro, Multi Strategy Alternative Income, and EHS Funds will be liquidated. Easterly Global Macro will liquidate on August 24, 2022. Multi Strategy Alternative Income and Easterly EHS Fund will liquidate on or about August 12, 2022.

Euclid Capital Growth ETF will be liquidated on August 4, 2022.

Achieving a beta of zero soon: Global Beta Smart Income ETF, Global Beta Low Beta ETF, and Global Beta Rising Stars ETF will all be liquidated by month’s end.

Morgan Creek – Exos SPAC Originated ETF will be liquidated on or about August 18.

Rockefeller & Co. LLC has decided to liquidate the Rockefeller Equity Allocation Fund, Rockefeller Core Taxable Bond Fund, Rockefeller Intermediate Tax-Exempt National Bond Fund, and Rockefeller Intermediate Tax-Exempt New York Bond Fund on August 26, 2022.

Yes, that Rockefeller .. the one located on Rockefeller Plaza near Rockefeller Center, with David Rockefeller on its board. The firm was started in 1882 to manage the Rockefeller family fortune, opened to other rich families in 1979, and was acquired by Viking Global Services in 2008.

The funds were underwhelming, had no discernible manager investment, and were small. It appears that Rockefeller Climate Solutions Fund, launched in July 2021, will soldier on at least a bit longer. On July 22, 2022, that fund substituted Jose Garza for Casey Clark as one of the fund’s two co-managers.

Effective July 22, 2022, Virtus Core Plus Bond Fund, Virtus Global Dynamic Allocation Fund, and Virtus Preferred Securities and Income Fund were liquidated