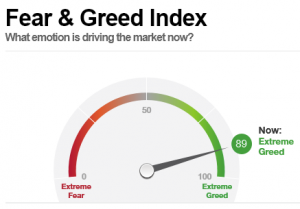
While writing this article, I am reminded of Alan Greenspan’s comment about “irrational exuberance” in 1996 and Ben Bernanke coining the phrase “global savings glut” in 2005. Roughly three years later we had the bursting of the Technology Bubble and the Housing Crisis. We now have inflated asset prices due to nearly of decade of “Quantitative Easing”. The CNN Fear and Greed Index is a timely figure for this article showing “Extreme Greed” in the markets.
“We stay irrationally bullish until peak positioning & peak liquidity incite [a] spike in bond yields & 4-8% equity correction,” – January 19, 2020, Bank of America, MarketWatch

Source: CNN Fear & Greed
In this article, I cover the second of the Six Rules of Investing, “Know the Short and Long Term Investment Environment”, which I introduced in the Mutual Fund Observer January Issue.
Here are the 6 Rules for Investing that I follow.
Rule #1: Develop a Financial Plan
Rule #2: Know the Short and Long Term Investment Environment
Rule #3: Manage Risk First
Rule #4: Invest Appropriate for the Business Cycle and Long Term Trends
Rule #5: Understand the Impact of Taxes on Investments
Rule #6: Develop a Simple Investment Process Based on Rules and Guidelines
The first section of this article looks at long term markets known as secular markets and the second part dives into cyclical markets. The final section looks at current trends in funds and categories that I rank based on the data from Mutual Fund Observer screens.
Why should we care whether the current bull market is in a secular bear market? Ed Easterling says that rowing works best in secular bear markets and sailing works best during secular bull markets. Mr. Easterling founded Crestmont Research and is the author of Probable Outcomes: Secular Stock Market Insights and Unexpected Returns: Understanding Secular Stock Market Cycles. These books were particularly enlightening for me when I began researching investment cycles. In Half & Half: Why Rowing Works, he explains that different approaches work well in secular cycles:
“Hedged portfolios outperform market portfolios in secular bear markets because of the disproportionate impact of losses relative to the gains required to recover losses. Most significantly, as the magnitude of the loss increases, the required recovery gain exponentially increases.
In secular bull markets, on the other hand, gains significantly overpower losses. So although cyclical swings deliver the occasional ‘correction,’ the recoveries far exceed the losses. The result is that above-average returns from sailing cumulatively exceed those from hedged rowing. In secular bear markets, however, gains across the secular period are cumulatively fairly modest or nonexistent. The result is that losses during secular bears well overpower the gains.”
Secular Markets – The Long Term Environment
With hindsight, if you read the following quote from Martin J. Pring on June 17th, 2006, would you have been better prepared for the housing bubble and financial crisis that were beginning to unravel?
“There are occurrences in the business cycle when the consensus of my proprietary primary trend indicators find themselves within the confines of the bearish camp. Unfortunately, now seems to be one of those occasions. The last time the technical, economic, and monetary indicators aligned themselves in such a negative way was the turn of the millennium. Then, as now, for the benefit of my subscribers, and their valued clients and investments, I feel duty-bound to publish a Special Report setting out the arguments for the impending scene about to unfold.”
How did Mr. Pring know? We can improve our investment performance by being students of the market. To better understand the markets, I will start with secular trends. Here is a good definition of secular bear markets by Jurrien Timmer at Fidelity in 2013.
“I define a secular bear market as a prolonged period spanning several business cycles of below-average—although not necessarily negative—nominal returns, an outright decline in real (inflation-adjusted) returns, and a sustained compression in price-to-earnings (P/E) ratios. By that definition, we’ve been in a secular bear market since 2000.”
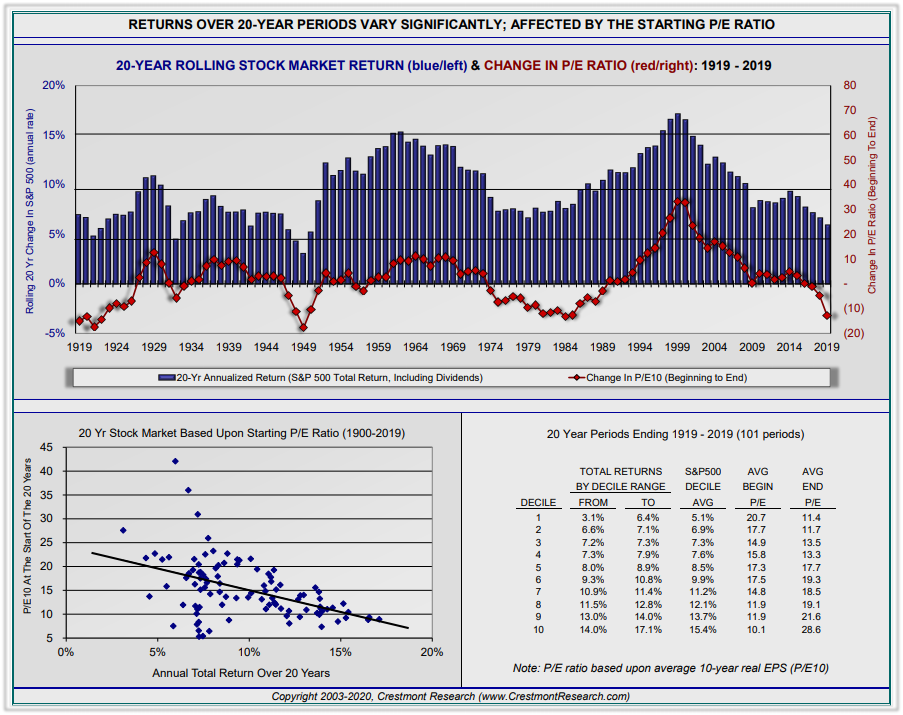
The key to understanding long term trends is inflation and valuations. The following chart from Crestmont Research shows stock market returns for rolling 20 year periods. For example, the stock market returns for the twenty years prior to 200o was approximately 17% while the return over the past 20 years currently is about 7 percent. The red line is the change in the cyclically adjusted price to earnings ratio (CAPE) over the 20 year period. In the 20 years prior to 2000, the CAPE multiple increased by about 35 points while over the current 20 year period the CAPE has fallen by about 15 points. The chart in the lower left-hand corner shows the starting CAPE on the vertical axis compared to the returns over the next 20 years. With today’s CAPE at about 30, the returns over the next twenty years will be in the low single digits based on historical relationships.
Chart #1: Rolling 20-Year Stock Market Returns

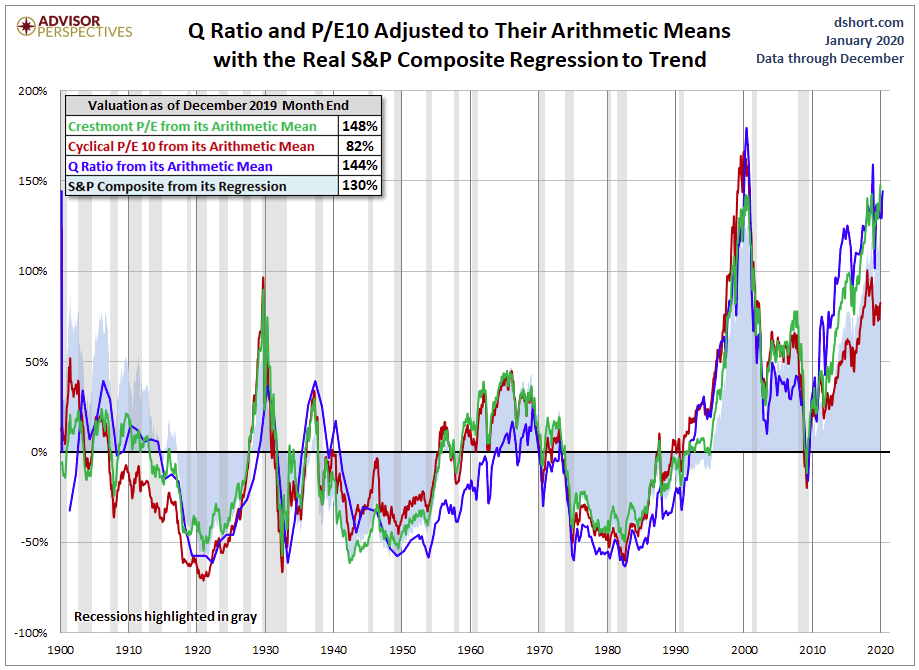
Jill Mislinski produced the following chart for Advisor Perspectives that shows four different valuation methods are historically higher than over the past 120 years. Ms. Mislinski is the Research Director for Adviser Perspectives. She holds a Master of Science from the University of Chicago. Valuations are higher than prior to the 1929 stock market crash and the 2007 Great Recession, but lower than during the Technology Bubble.
Chart #2: Stock Market Valuations Are High

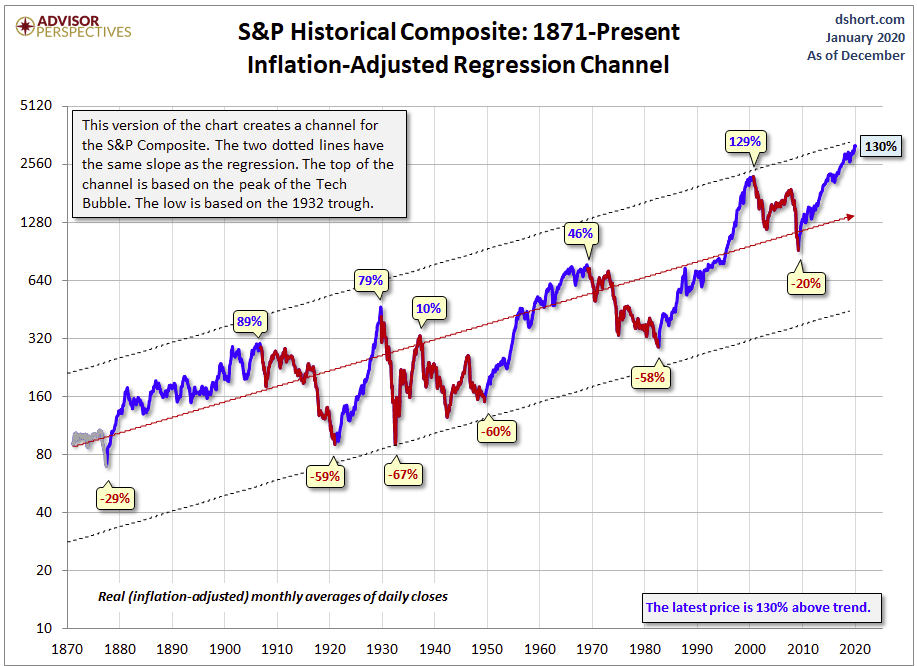
Another great chart by Jill Mislinksi shows that when the stock market is adjusted for inflation, it rises on average 1.86% per year. Chart #3 shows that the trend stays within ranges, and the current market is 30% higher than the trend, and at the high end of the trend. During the next recession, it will likely revert beyond 30% to the mean and fall further.
Chart #3: Inflation-Adjusted Stock Market Returns

Lance Roberts from Real Investment Advice published the following chart showing secular bull and bear markets since 1871. The key take away is that the current market is a cyclical bull market within a secular bear market, based on the CAPE. Mr. Roberts points out that the current bull market is driven largely by monetary policy leading to inflation of assets, and not from fundamental growth.
Chart #4: The Current Bull is in a Secular Bear Market

Both Ms. Mislinski and Crestmont Research show great charts of the impact of valuations on 10-year returns, but my favorite is the following chart by John Hussman which shows that future stock market returns over the next 12 years will be about zero-based on historical data. Dr. John Hussman is the president and principal shareholder of Hussman Econometrics Advisors.
Chart #5: Estimated 12 Stock Market Year Returns

The key take away from this section is that long term trends show that the current markets are highly valued which will result in lower returns over the next one or two decades. This calls for a more active and defensive approach to investing instead of the buy and hold that does so well during secular bull markets.
Cyclical Markets – The Medium Term Environment
In my view, the greatest way to optimize the positioning of a portfolio at a given point in time is through deciding what balance it should strike between aggressiveness/defensiveness. And I believe the aggressiveness/defensiveness should be adjusted over time in response to changes in the state of the investment environment and where a number of elements stand in their cycles.
– Mastering the Market Cycle: Getting the Odds on your Side, Howard Marks
I built an Investment Model to estimate an allocation to stocks and bonds that takes a six-month look into the investment environment. It is based on over thirty indicators including stock and bond returns, leading and coincident indicators, the U.S. and global economic growth, financial risk, interest rates, monetary policy, valuations, inflation, among others. The main index is the dashed blue line. With interest rates falling, last year was a good year for bond returns. As the economy continues to improve bonds will be less attractive. On the positive side, financial risk is low, the stock market is surging, coincident activity is moderate, and housing is improving. On the negative side, corporate health, orders, construction, shipments, and leading indicators are negative. Productivity, income, and investments are declining. Gross domestic product is near its potential with tight labor markets suggesting further improvements in the economy will result in inflation. Valuations are high. The model estimates a defensive allocation to stocks.
Chart #6: Author’s Investment Model

John Butters updates market earnings and revenues for FactSet. I summarize below with a few excerpts.
For the fourth quarter, the S&P 500 is reporting a year-over-year decline in earnings of -2.1%, but year-over-year growth in revenues of 2.7%. Given the dichotomy in growth between earnings and revenues, there are concerns in the market about net profit margins for S&P 500 companies in the fourth quarter.
The blended net profit margin for the S&P 500 for Q4 2019 is 10.7%. If 10.7% is the actual net profit margin for the quarter, it will mark the first time the index has reported four straight quarters of year-over-year declines in net profit margin since Q4 2008 through Q3 2009.
Looking ahead, analysts see mid-single-digit earnings growth for Q1 2020 and Q2 2020.
The forward 12-month P/E ratio is 18.6, which is above the 5-year average and above the 10-year average.
The following two charts by Charles Schwab are of particular interest as they show that stock market prices far exceed the trends in profits and that many measures of inflation are higher than the Fed’s 2% target. They suggest keeping bond durations “slightly lower than average” and adding a small allocation to Treasury Inflation-Protected Securities.
Chart #7: Divergence of the S&P 500 and Corporate Profits

Chart #8: Inflation Estimates Are Higher Than Fed Targets

In the previously cited article, Mr. Hussman estimates that based on historical performance, a conventional 60% stock/40 bond portfolio will have a return near zero, before adjusting for inflation, over the next 12 years. Morgan Stanley also cautions investors that the return on a traditional 60% stock/40 bond portfolio could be in the low single digits over the next decade. Alpha Gen Capital is also of the opinion that a “60/40 portfolio is likely to produce much lower returns in the coming decades” as valuations and returns revert to the mean. Part of Alpha Gen Capital’s solution is to reduce exposure to equity while increasing yield from closed-end funds.
Similar to Mr. Easterling’s philosophy of rowing during secular bear markets and sailing during secular bull markets, Mr. Hussman describes an alternative approach to investing over the next decade.
“Nothing demands that investors ‘lock-in’ the lowest investment prospects in U.S. history. The alternative that investors have is flexibility. The alternative they have is the capacity to imagine a complete market cycle. The alternative investors have is discipline – the willingness to lean away from risk when it is richly valued and unsupported by uniformly favorable internals, and to lean toward risk when a material retreat in valuations is joined by an improvement in the uniformity of market internals.”
The Current Environment – Rowing Instead of Sailing
Irrational exuberance is a state of mania. In the stock market, it’s when investors are so confident that the price of an asset will keep going up, they lose sight of its underlying value. The phrase was coined by former Federal Reserve Chairman Alan Greenspan in 1996. It’s also a book by Robert Shiller describing the 2000 stock market bubble.
–Irrational Exuberance, Its Quotes, Dangers, and Examples, The Balance, Kemberly Amadeo
In Winning The Loser’s Game, Charles D. Ellis points out the disadvantages that individual investors face against the investment teams of professionals at investment companies. The best way to win is just not to play the game. In the current market that is “irrationally bullish” and highly valued, I choose to be more on Howard Marks’s “defensive” spectrum – to protect assets rather than speculate on the earnings catching up to market prices.
We don’t know what will cause the current bubble to burst or when it will occur, but the next quote is worth heeding to keep bond quality high.
With $9.2 trillion outstanding as of the end of 2018, the size of the corporate bond market in the U.S. rivals that of the mortgage-backed securities market. In this post, we argue that, although much of the post-crisis issuance has been in the investment-grade segment of the market, the large volume of issuance with a BAA credit rating may pose a financial stability concern. Moreover, the maturity and firm-characteristic mismatch between bonds with AAA and BAA ratings reduce the usefulness of the BAA – AAA spread as an indicator of investors’ aversion to credit risk.
– What’s In AAA Credit Rating?, Liberty Street Economics, Federal Reserve Bank of New York
Each month, I extract data on about a thousand mutual funds available to individual investors, exchange-traded funds, and closed-end funds from Mutual Fund Observer. I rate funds and objectives based upon risk, risk-adjusted return, income, momentum and quality factors. Table #1contains the top Lipper Objective along with a representative component of the factors. I break them out by nine different buckets including inflation protection, global bonds and income, income and commodities.
Table #1 contains the top-ranked funds for each of the top-ranked Objectives broken out by Vanguard and Fidelity mutual funds and no-load, no-fee funds available through Charles Schwab, exchange-traded funds and closed-end funds. In the current market, I look to diversify away for U.S. equities and longer duration bonds into international funds, income, inflation protection and commodities. Table #2 contains the Top Ranked Funds for the Top Ranked Objectives in Table #1.
Table #1: Top Ranked Objectives (Jan 2018 – Dec 2019)

Source: Created by the Author Based on Mutual Fund Observer
Table #2: Top Rated Funds in Top Rated Objective

Source: Created by the Author Based on Mutual Fund Observer
Suppose that you prefer investing in mutual funds at Fidelity, how might a person build a portfolio based on this article? It would be a conservative portfolio with a tilt toward global funds, inflation-protected bonds, and possibly commodities. Table #3 contains the funds that I would choose and the metrics for the past 12 months. The funds highlighted in blue have the MFO Great Owl classification. The MFO Portfolio Tool classifies the portfolios as Conservative (MFO Risk = 2), with a maximum drawdown of 1.6% and an Ulcer Index of 0.5, yet the portfolio would have returned nearly 18% in 2019. The Martin Ratio is risk-adjusted returns and is a high 34 for the portfolio. Fidelity Strategic Real Return (FSRRX) is about a third inflation-protected bonds and a third commodities, however, the remainder is in floating rate bonds which appear to be lower quality. FIGFX, FSGGX, FIREX, and FPHAX are global funds.
Table #3: Hypothetical Fidelity Portfolio

Closing
John Maynard Keynes (1883 – 1946) was attributed with saying, “The market can stay irrational longer than you can stay solvent.” Institutions have increased money funds by $400 billion since April 2019. They typically increase cash at the tops of markets prior to recessions. What I appreciate about Mutual Fund Observer is that it provides the tools to measure the risk and risk-adjusted performance of a portfolio.
Disclaimer
I am not an economist nor an investment professional. I became interested in economic forecasting and modeling in 2007 when a mortgage loan officer told me that there was a huge financial crisis coming. There were signs of financial stress if you knew where to look. I have read dozens of books on business cycles since then. Discovering the rich database at the St. Louis Federal Reserve (FRED) provides most of the data to create an Investment Model. The tools at Mutual Fund Observer provide the means for implementing and validating the Investment Model.


