Objective and strategy
Ariel Global Fund’s fundamental objective is long-term capital appreciation. The manager pursues an all-cap global portfolio. The fund is, in general, currency hedged so that the returns you see are driven by stock selection rather than currency fluctuation. The manager pursues a “bottom up” discipline which starts by weeding out as much trash as humanly possible before proceeding to a meticulous investment in both the fundamentals of the remaining businesses and their intrinsic value. The fund is diversified and will generally hold 50-150 positions. As of September 2019, there are 55.
Adviser
Ariel Investments LLC of Chicago. Founded in 1983, Ariel manages $12.7 billion in assets spread between nine separate account strategies and five mutual funds; a sixth, Ariel Discovery, was liquidated in June, 2019. Ariel provides a great model of a socially-responsible management team: the firm helps run a Chicago public charter school, is deeply involved in the community, has an intriguing and diverse Board of Trustees, is 95% employee-owned, and its managers are heavily invested in their own funds. One gets a clear sense that these folks aren’t going to play fast and loose either with your money or with the rules.
Manager
Rupal Bhansali. Ms. Bhansali joined Ariel in 2011 and has served as portfolio manager for the International and Global Funds since their inception in 2011. She and her team are based in New York City which substantially eases the burden of meeting representatives of the non-U.S. firms in which they might invest. She has 30 years of industry experience, most recently spending 10 years at MacKay Shields as Head of International Equities, managing MainStay International (MSEAX). Before that, she was a portfolio manager and co-head of international equities at Oppenheimer Capital.
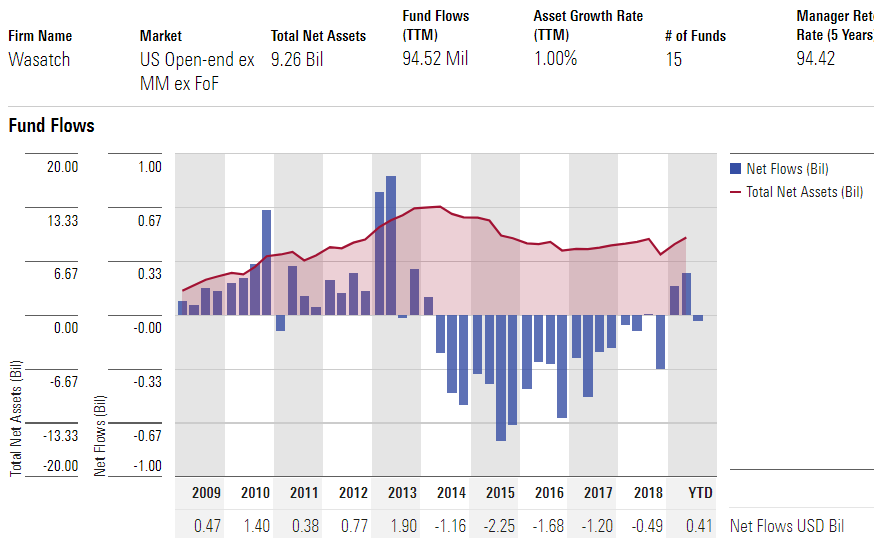
Strategy capacity and closure
Vast. The combined global and international strategies hold about $3.5 billion now but could accommodate $50 billion.
Active share
92.45% as of September 30, 2019
Active share measures the degree to which a fund’s portfolio differs from the holdings of its benchmark portfolio, in this case, the MSCI ACWI Index. The fund’s active share shows a very high level of independence, especially for a fund investing primarily in large cap stocks, from its benchmark.
Management’s stake in the fund
Both substantial and a lot more than is obvious at first glance. Ms. Bhansali’s reported investment in the fund is between $100,000 – $500,000 as of September 30, 2018. She has two layers of additional investment. First, Ariel is owned by its employees and directors so when she joined the firm, she devoted a fair amount of her wealth to investing in it. Second, her portfolios were originally marketed as separately managed accounts; she made a substantial investment in such an account to visibly align herself with her investors. As a result, the reported investment in the fund is a fraction of her total financial commitment.
All of Ariel’s seven independent trustees have substantial investments in the fund, as have four of her five fellow managers. Ariel president John Rogers is an exception, though he does have a $100,000-500,000 invested in its sibling, Ariel International (AINTX).
Opening date
December 30, 2011.
Minimum investment
$1,000 for Investor shares, $1 million for Institutional (AGLYX) ones.
Expense ratio
1.13%, after the expense waiver, for Investor shares on assets of $13.4 million, as of June 2023. The Institutional shares charge 0.88%.
Comments
The question is: do “contrarian” investors pose the most intriguing opportunities when their fund have five stars or two? Contrarian portfolios, which are typically identified as value portfolios, tend to have two phases. In the accumulation phase, the manager has identified an opportunity (or set of opportunities) that others have dismissed as trash. The manager buys, the stock declines, and the manager buys more. In the interim, their Morningstar rating falls and investors grow restless. In the harvest phase, the rest of the world catches on and begins bidding up the price of the misunderstood holdings. They hit to contrarian’s “sell” trigger, at which point they harvest gains and celebrate high Morningstar ratings … just before they restock on misunderstood stocks that cause their ratings to fall and the cycle to begin again.
As Ms Bhansali points out, “I’ve had five-star ratings on my funds. Now I have two stars. The process hasn’t changed, my discipline hasn’t changed. Stars come and stars go. I remain a risk-manager and a high-conviction contrarian investor.”
I have spoken with Ms. Bhansali on three occasions, most recently during the AAII conference in October 2019, and have come away impressed from each encounter. She’s had a long career in international and global investing. She’s very smart and articulate; she really gives the impression of thinking about questions rather than rattling off talking points. She’s made a series of principled and thoughtful career moves, and she’s served her investors well. I hope you have the opportunity to engage with her as well.
Three things worth knowing:
-
She and her team think of themselves as business analysts, not financial analysts. There are a lot of businesses out there which are poorly run, vulnerable to predation or in a dying industry. She wants no part of any of them. “When we look at these fundamental business risks, we eliminate 60% of all firms. Those are stocks that we would not own, ever, regardless of price.” To be clear: they are sensitive to price and valuation, but only if the underlying business is sound.
Of the sound businesses, about 70-80% are fully valued. Those valuations are much more challenging than when we profiled the fund in 2016; back then, the manager estimated that 50% of all sound businesses were fully valued which reduced their immediately investable universe to 20% of the market. At the stretched valuations in late 2019, they focus their 360-degree analysis on the ever-smaller pool of sound businesses available at attractive valuations: about 5% of the market.
-
She and her team are very risk conscious. “We start with the question, ‘what can go wrong? How bad could it get?’ and if we don’t like the answer, we walk away. No amount of theoretical upside is worth some of these risks.”
-
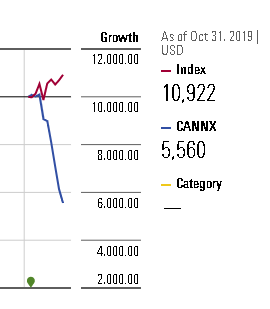
She and her team build the portfolio stock-by-stock. They’re not benchmarking themselves against an index or peer group; the culture at Ariel favors independent thinking even when it means being out of step. Similarly, they don’t make thematic bets. They allow ideas to compete for space in the portfolio. The more misunderstood a firm is, the more it’s likely mispriced. An example she cites frequently is the choice between Microsoft (which she does own) and Apple (which she doesn’t). Everyone knows that these are two tech giants and everyone knows that tech companies post flashy growth numbers, everyone knows that Microsoft’s best days are behind it. In consequence, everyone bought Apple. As it turns out, “everyone” was wrong. Over the past five years, an investment in Microsoft – a steady cash machine with predictable, recurrent cash flows – was far more profitable (up 196%, as of 10/31/2019) than an investment in Apple (up 127% with substantially greater volatility). “Everyone is ‘contrarian’ but it’s not enough to be contrarian. You must be contrary and correct. Very few are.” The most mispriced firms earn the largest spots in the portfolio. As of October 2019, Microsoft is the fund’s largest holding. Like most of the fund’s top 10 holdings, it has been in the portfolio virtually since inception.
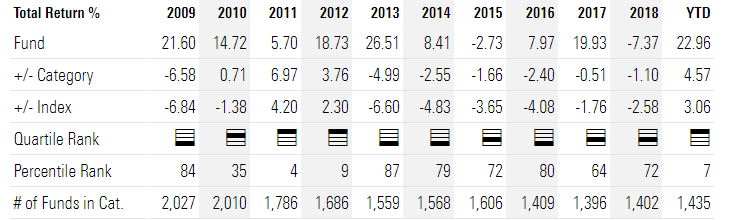
Her preference for a global portfolio of sound businesses with mispriced stocks lands her in Lipper’s Global Large Cap Value category along with the likes of Oakmark Global Select (OAKWX), Dodge & Cox Global Stock (DODWX) and Tweedy, Browne Value (TWEBX). It’s good company. Among the 13 funds and ETFs in the category with a record of seven years or more, here are Ariel’s rankings:
| Absolute value | Rank | |
| Annual return | 8.8% | 6th best of 13 |
| Maximum drawdown | -11.5% | 4th |
| Sharpe ratio | .80 | 1st (tied with BlackRock Global 100) |
| Sortino ratio | 1.30 | 1st |
| Martin ratio | 2.42 | 1st |
| Capture ratio, MSCI ACI xUS | 1.42 | 2nd |
| Capture ratio, S&P 500 | 0.85 | 1st |
| Ulcer Index | 3.3 | 1st |
Annual return is a pure return measure, made without consideration of volatility. By that measure, Ariel Global is a tiny bit above average. Maximum drawdown is a pure risk measure, looking only at the worst slum a fund suffered during the period. By that measure, Ariel is substantially above average.
The fund’s greatest distinction comes in the five measures of risk-adjusted performance. It is, by every measure, the best or second-ranked option for investors over the past seven years. While Sharpe ratios are familiar as the most common metric for risk-adjusted returns, MFO and the MFO Premium screeners are more risk-aware than most and so we complement that with additional metrics:
Sortino: an adaptation of the Sharpe ratio which focuses on a fund’s returns relative to its downside volatility; Sharpe looks at both upside and downside volatility which, critics say, ends up punishing funds with “good” volatility and masking some with “bad” (or downside) volatility.
Martin: an adaptation of the Sharpe ratio which focuses excess return relative to a fund’s typical drawdown, again since people rarely worry about volatility (“is my fund high or higher?”) in rising periods.
Capture ratio: is simple the ratio of Upside to Downside Capture. A fund that captures, say, 80% of a market’s upside and 50% of its downside is far more attractive than a fund that captures 80% of the upside plus 100% of the downside. Since we don’t have a global benchmark in the database, we offer Ariel’s performance against the MSCI international index (2nd) and the domestic S&P 500 (1st).
Ulcer Index: which captures both how far a fund falls and how long it stays down, with the notion that falls that go down and stay down give their investors (and their managers) the worst ulcers.
The simple generalization is this: since inception, Ariel Global has offered its investors reasonably good returns with exceptionally good risk-management. That’s certainly in line with Ms. Bhansali’s description of herself as an investor who manages risks rather than returns.
Bottom Line
Cautious, global and value have not been in favor for the better part of a decade. Much of that is attributable to interest rates near, or even below, zero which has engendered and rewarded all sorts of corporate shenanigans. Ms. Bhansali’s judgment is that “a market that’s been on steroids is now on opioids which, I believe, cannot end well.”
Ariel International and Global follow the same discipline. Purists might prefer to look more closely at the larger International (AINTX) fund. Both because it’s smaller and it affords its manager greater flexibility, we chose to profile Global. In either case, patient, risk-sensitive investors interested in expanding (or upgrading) their international exposure should add the funds to their due-diligence list.
Fund website
Ariel Global. Ms. Bhansali just published her first book, Non-Consensus Investing: Being Right When Everyone Else is Wrong (2019) which intertwines her life story, her investment perspective and her concern that other women be empowered to take responsibility for their financial futures. It’s available in paper and Kindle through Amazon. The writing’s a bit uneven but the content is powerful. The News page on the Ariel Funds site has several good stories involving Ms. Bhansali, including her recent addition to the Barron’s Roundtable.
© Mutual Fund Observer, 2019. All rights reserved. The information here reflects publicly available information current at the time of publication. For reprint/e-rights contact us.

 Another example, and then I will move on. Some years back I was in a supermarket located in that triangle area of Massachusetts within spitting distance of New York and Connecticut. I was watching a direct store deliveryman for a potato chip company fill up his section of the salty snack aisle. (FYI – hands up those who think you can learn more about brands and what the competition is doing by talking to the direct store deliveryman or, instead of by sitting at the well-scrubbed set of presentations at a company’s analyst day). The gentleman noticed that I was looking for something and asked if he could help. I mentioned a special brand of potato chip that his company made. I had purchased it when in the DC and Virginia areas. He said that was their best selling and best tasting potato chip – and the only one that they still cooked in lard. He told me that I wouldn’t find it in Massachusetts or Connecticut. This apparently was the dictate of the health police. I wonder what they would make of poutine sold everywhere in Quebec – but I digress.


 Andrew Ross Sorkin wrote an interesting piece in the Business Section of The New York Times for Monday, July 29, 2019. It was about a retired corporate attorney, Jamie Gamble, who concluded in retirement that corporate executives, including the ones who used to hire him and his firm, “are legally obligated to act like sociopaths.” Mr. Gamble’s argument centers around a corporation’s obligation to focus on itself (preservation) and defining increased profitability as the prime directive; that is, the maximization of shareholder value. I encourage you to read the article,
  them to your attention. First, the short, five-episode series on HBO,
  the grandmother, ostensibly under the guise of a family wedding. The grandmother is not being told that she has cancer and only a short time (so say the doctors) to live. The granddaughter learns things about her grandmother she did not know, such as that she was in the army and shot. These things she learns from two retired People’s Liberation Army generals who come to the wedding to see her grandmother. The movie is in Chinese with subtitles, but the contrast between our culture and that of China is quite stunning and compelling. If you want a short lesson in what the real differences are between the U.S. and China, this is a great way to get it in two hours.