Yearly Archives: 2019

December 1, 2019

By David Snowball

Dear friends,

Welcome to the last 2019 issue of Mutual Fund Observer. Thanks for being here.

There’s rather a lot going on with this month’s issue whose theme might be “get some perspective while it’s still possible.” We’ll talk a bit about preparing for less hospitable markets. Vanguard’s Total Stock Market Index is up 27% YTD without a notable stumble along the way; it simply doesn’t get more hospitable. Since the economy, earnings and CPI didn’t grow by anywhere near that much, most of the gain comes from “multiple expansion,” the willingness of investors to pay more today than they did yesterday for the same thing. Vanguard itself is not enthused.  Joe Davis, Vanguard’s chief economist and investment strategist warned in mid-November.

Our near-term outlook for global equity markets remains guarded, and the chance of a large drawdown for equities and other high-beta [more volatile] assets remains elevated and significantly higher than it would be in a normal market environment. (MarketWatch, 11/19/2019)

High-quality fixed-income assets, he says, “remain a key diversifier.”

So we’ll highlight some of the funds that might help, and rather a lot that won’t. And, as part of maintaining a healthy mind as well as a healthy perspective, we’ll share the argument for fewer hours with web browsers and more with books.

Well, books and smart people.

Make Me Smart

Really, that’s more of a challenge than you’d imagine.

Make Me Smart” is an exceptional weekly podcast on technology, the economy, and culture. It’s produced by American Public Media, NPR’s chill next-door neighbor, which also hosts the Marketplace franchise. The show generally runs 30 minutes, unless they don’t have 30 minutes’ worth of good stuff. Then it’s shorter. I like that. Generally, they have one question or guest which occupies half the show, and then give-and-take about the week’s events.

It feels a lot like having lunch with two really smart, amiable old friends. A recent episode focused on the team of economists who received this year’s Nobel Prize in Economic Science. Their work, on global poverty reduction, might be summarized by the phrase “look before you leap.” The hosts and I both seemed astounded that you could revolutionize the field of economics by pointing out that policies made in the absence of careful evidence are likely to be failed policies. The team spent a lot of time looking at efforts to improve education in Kenyan. Starting point: the Kenyan system is a disaster, with no resources for the students, no textbooks, 80 students per class and teachers who live in poverty.

Easy conclusion: add resources, provide textbooks, raise class sizes, pay teachers more.

Their strategy is to rigorously test each of those “solutions” before implementing them. The surprising results: almost all of them are wastes of money, with just one “obvious” solution showing any promise at all. Their guest, French economist Esther Duflo, offered the conclusion that all of us should probably keep taped to our monitors:

Your intuition can be so wrong. It is quite likely that your idea is not that great. You’re going to learn it in the field and that learning is quite helpful because you are going to progressively learn, what is the real issue? If you have to humility to realize that, most of the time, our great ideas are not all that great.

Nobel Laureate economist Esther Duflo, Make Me Smart November 19, 2019

A week earlier they had a slightly outraged discussion of an infuriating situation: Apple released a credit card that it said that drew on the Apple cachet and the promised to be different from those dirty old bank credit cards. And then it turned out to be wildly sexist: in one couple after the next (including, famously, Apple co-founder Steve Wozniak), the system issued vastly higher credit limits to the male partner than to the female. When pressed on the issue, Apple reps said they couldn’t explain it and that it wasn’t sexist “because it was all done by an algorithm.” The algorithms in question either wrote themselves (?) or were written by the bank behind Apple’s “this ain’t no stinkin’ bank” card.

It would be quite worthwhile to listen.

Yuh … hold it right there, bubba

From my inbox this week:

“Without even doing any in-depth analysis dot dot dot”? Any article that leads with “I haven’t bothered to do any analysis” is a great candidate for emphatic use of the “delete” button.

Here’s their argument, in brief: the fund’s raw returns have lagged, the fund charges 1.8%, buy an index fund.

Thank goodness they didn’t waste time with any of that in-depth research stuff that might have noted that this is a conservatively managed quant fund, that it currently holds 32% cash, that its risk-adjusted returns are strong, and that its total returns have pretty much clubbed its peers since inception. All of which might, or might not, be more relevant than its 1.8% e.r.

If you’re interested in a bit more from us…

BottomLine Personal interviewed me about interesting funds “below the radar.” The result was the article “The Best Stock Funds You Never Heard Of.” That spawned a lively debate on the MFO discussion board.

A few upgrades and experiments

New at MFO Premium this month, Charles has added an “averages and indexes” comparison to the fund screener.

That allows for easy, direct comparisons between the three for any of the dozens of specific periods (including entire market cycles, multi-decade periods and down markets) we compute.

We’re also testing a new element for each of our fund-specific pieces: brokerage availability. As with many of our changes, that was the result of a thoughtful recommendation by an MFO reader. Carlyn Steiner wrote in mid-October,

It would be helpful if you could note where a fund may be purchased when you review it.  Also, short of opening an account at Harbor and at Seafarer to purchase a single fund, can you tell me where I might buy each of the funds, Harbor and Seafarer …

That took a bit of doing, and Morningstar’s generosity. Brokerage information used to be part of Morningstar’s online profiles of each fund but they found limited user interest and dropped the feature. I was stymied about how to address Carlyn’s request until Michael Laske, a Product Manager at Morningstar Research Services, reached out with the offer of providing brokerage information for all of the funds they cover. With the perfectly sensible proviso that I cannot directly share the whole list, we’re able to use it to highlight availability in each Launch Alert, Elevator Talk, and profile.

Beginning this month, we’ve added the feature. David Welsch is faithfully retconning all of the profiles we’ve published this year; that is, he’s editing each to integrate the brokerage information.

Reaction on the discussion board was mixed, at best. Lots of folks suggested just checking directly with your brokerage. Please do let us know what you think. We can continue, expand or terminate the experiment, all of which is based on your needs.

Thanks to Michael and the folks at Morningstar for their generosity and support!

The month’s Elevator Talk with Joe Shaposhnik of TCW New America Premier Equities was also seeded by a reader suggestion. Michael Weingarten wrote to us on November 15 about a couple of funds.

A while back you mentioned that we should email you if we’d like to suggest funds for a writeup in the monthly commentary. There are 2 funds that I’m very interested in learning more about. FAMEX is one that you analyzed several years ago and I thought it would be very interesting to revisit them. The fund held up incredibly well in the Fall selloff last year and I was curious if they had modified their strategy to be more conservative after their large drop in 2008 (49%). I really enjoyed your analysis on this one. The second fund is TGUSX. This one is only 3 years old and has had an incredible risk-adjusted performance. There’s not a lot of info available on this fund. Thanks very much and have a great weekend.

By happenstance, Mr. Shaposhnik had also begun a conversation with us. The confluence resulted in this month’s Elevator Talk and January’s update to the FAM Dividend Focus (FAMEX).  Following your suggestions, we’re also working on the father/son funds at Yacktman and YCG.

Matching grant/challenge grant offer.

The only source of support for MFO is reader contributions. We’re frequently offered the opportunity to host “paid placements” or Google ads. We’ve always refused such offers, for two reasons. First, ads are annoying, distracting and intrusive; they make it difficult to read our content.  Second, they would represent a compromise in our independence. We’d much rather do good work on a shoestring budget than provide compromised content in exchange for cash. Not. Gonna. Do. It.

What’s “a shoestring budget” look like. In broad terms, it costs $24,000 a year to keep the lights on here and at MFO Premium. That doesn’t account for any compensation to our staff or contributors. In general, in the years where we run a surplus, we try to share a year-end honorarium to the folks who make MFO happen. It is, otherwise, a volunteer effort.

That’s modestly below the $1.02 billion in revenue that Morningstar reported for 2018.

We hit the break-even point in about two years out of three, mostly because of the contributions we receive in December.

In past Decembers, Deb Walters – our fund-raising strategist and good friend – personally underwrote challenge grants to give folks the incentive to do what they’ve been intending on doing all along. When Deb passed away at her home in New Mexico this summer, we lost both a friend and a leader.

This year two anonymous donors have offered up modest challenges, for which we’re grateful.

Challenge One targets new memberships to MFO Premium. Our potential donor will match five new memberships to MFO Premium, a tax-deductible $120, but we do need to reach the threshold of at least five new members.

Challenge Two is triggered by other reader contributions in excess of $500; that is, if we receive at least $500 from folks other than the Challenge One crew, they’ll chip in another $500.

If it’s in your budget and your best interest, we’d encourage you to make a tax-deductible year-end contribution to MFO. Contributions of $120 or more get you a year’s access to MFO Premium, home of the unique fund screener that we’ve built for folks who want information – sophisticated risk measures, rolling returns, correlations between funds – that are normally unavailable to regular folks. If you would like to receive access to MFO Premium, please use the MFO Premium link! Contributions made through that link are automated and seamless, which gets you access more quickly and smoothly.

If you’d like to simply support the mission of MFO but aren’t interested in Premium access, please use our “regular” PayPal link. Similarly, you’re welcome to write a check (and a note! We love reading your notes!). If you do write a check and would like MFO Premium access, just remember to share an email address with us. Whether you choose to give $1 or $10,000, we’re grateful and we’ll keep digging on your behalf.

Some folks have chosen to use our PayPal link to create regular monthly contributions, which we find almost freakishly cool. Thanks especially to the folks at S&F Investments for their generous, ongoing support (We owe you a third MFO mug, we thought there was only an S and an F!) and, as ever, to Greg, Doug, David, Seshadri, Brian, Matthew, James, William, and the other William, whose continued monthly support makes us smile. Thanks, too, to Larry, Rae, Ira, Wilson, Dan, Leah, Marvin, Richard, and Binod for your kind contributions in October and November.

Wishing you a joyful holiday season,

david's signature


MFO’s Portfolio Pruning Primer

By David Snowball

We’re near year’s end, decade’s end, and quite possibly the bull market’s end and the economic expansion’s end. It’s been easy to be a bad investor for the past 10 years: the market’s relentless rise, fueled by enormous amounts of fiscal (hello, trillion-dollar deficits!) and monetary (hello, negative real interest rates!) stimulus, had made it likely that even a badly constructed portfolio booked acceptable – perhaps even double-digit – returns.

Do not bet your future on a repeat of that happy pattern.

The Observer’s core beliefs are (1) valuations matter and (2) you will do harm to yourself given the opportunity. It’s time to reduce the opportunity.

Our Portfolio Pruning Primer

  1. If the number of investments exceeds the number of fingers, it’s time to prune.

    In, say, a three-fund portfolio, every fund counts and every fund can be accounted for. That is, you have the brain space to keep track of three objects. Psychologists, famously, think you have the brain space to keep track of five to nine objects (expressed as “seven plus or minus two,” a limit of working memory first tested in 1956). You have no more prospect of keeping track of 15 funds running around your portfolio than you have of keeping track of 15 toddlers running around your house.

  2. If you don’t need it, prune it.

    Having three domestic growth funds has no advantage over having one. Having minuscule positions in 14 asset classes that you can’t weigh, monitor and rebalance is a lot less powerful than having access to four that you can. (Doubt me? Go play with the portfolio risk analyzer at MFO Premium. Set up a 14-fund portfolio and a one fund/four asset class portfolio – Fidelity Four-in-One Index will do – and try to figure out what you’ve gained from clutter.)

  3. If you can’t explain it, prune it.

    Commitment is the key to long-term success. Most investors undercut themselves by buying what’s been hot and selling, sometimes in a panic, what’s been cold. That has always been a recipe for failure.

    The key to holding on is knowing what you own and why you own it. For each fund I own, I can explain in about three sentences, in terms my 19-year-old can understand, what each of my managers does and why I have chosen them. I have confidence in them, I’m unconcerned by consecutive years of sub-par returns, and I sell a fund about once a decade. That patience would be incredibly hard to sustain if I mostly thought “my guy has a secret sauce or magic wand or something that he uses when he … uhh, hedges his naked straddles?”

  4. If the manager won’t buy it, prune it.

    There’s decent evidence that managers with substantial “skin in the game” make fewer impulsive moves than those without. Returns might not improve, but riskiness declines. There’s fascinating evidence that managers whose board of trustees have skin in the game are much more responsible; nothing focuses your attention quite like the prospect of losing a lot of your boss’s money. That’s why we report manager and trustee ownership in every fund profile. You can find the same data in the fund’s Statement of Additional Information.

  5. If it doesn’t protect you in bad times, prune it.

    Market-cap weighted index funds and ETFs can be wonderful devices for capturing the gains in a rising market, and their enormous popularity entirely corresponds to 12 years of a relentlessly rising market. They’re also going to capture 100% of every collapse and have no liquid reserve (aka “dry powder”) to capture opportunities in the face of a collapse. That’s not a criticism of them, it’s just an explanation of their structure.

    About 80% of active funds are no better: their managers are so desperate to win the “beat the market” game that they have poor risk or downside management and little upside advantage. Many are just fat, expensive, slightly desperate index wannabees.

    Don’t buy those. If you’ve bought them, it’s time to reconsider.

In this story, we look at three different measures of downside risk and highlight the funds that have the worst decade long performance on each measure. The point of this roll call of the wretched is both to answer the question “how bad can it get?” but, more importantly, to point you at the sorts of tools you can use to protect your own assets.

A warning about benchmarks and stats

The tables below report one funds’ behaviors over the past 10 years (144 months). That’s been a bull market, with just 34 down market and 15 bear market months. As a result there’s a degree of optimism built in.

Deviation stats are relative, not absolute. A bear market deviation of 15 does not mean that you’ll lose 15% in a bear market year, far from it. You need to compare your fund’s downside to a relevant benchmark’s; if the benchmark value is 7 and your value is 15, anticipate about twice as much pain as whatever the benchmark suffers.

We offer two benchmarks in each table, representing a 100% US equity portfolio and a 60% equity/40% bond portfolio. Those are directly relevant to some funds, less to others but they do reflect about 90% of investor portfolios. MFO Premium subscribers can access all the specific category averages and can play to their heart’s content with time periods and metrics.


The Worst of the Deviants

While we generally endorse looking at risk-return metrics such as the Martin Ratio, ferreting out funds that might pose the greatest threat in a serious market downturn requires focusing clearly on pure downside measures. Using the tools at MFO Premium, we’ve identified the 10 worst equity-oriented funds of the past decade based on each of three different downside measures.

To be clear, these are not the biggest laggards, they’re just the most challenged ones.

Greatest 10-year downside deviation

Downside deviation can be thought of “day-to-day downside.” It measures only downward variation; specifically, it measures a fund’s return below the risk-free rate of return, which is the 90-day T-Bill rate (aka cash). Downside deviation doesn’t worry about how the stock market is doing, it just identifies funds which – in any market – return less than money in a savings account would.

  Lipper category Downside deviation 10-year annual returns Worst drawdown vs peer group
Benchmarks          
Vanguard Total Stock Market VTSMX Multi core 7.9 13.5 -17.7 1.7%
Vanguard Balanced Index VBINX Growth allocation 4.4 9.6 9.0 1.0
           
iShares MSCI Turkey ETF TUR EM 22.0 -4.3% -68.2% -8.4%
Madison Small Cap BVAOX Small core 21.4 1.2 -63.55 -10.2
Jacob Small  Cap Growth JSIGX Small Cap 20.4 3.9 -51.5 -9.3
VanEck Vectors Brazil Small Cap BRF Latin Am 20.1 -0.9 -79.0 -1.2
iShares MSCI Brazil ETF EWZ Latin Am 19.9 -1.3 -70.7 -1.7
Vanguard Global Capital Cycles VGPMX Global multi value 19.1 -5.4 -74.2 -12.4
Upright Growth UPUPX Global multi value 18.8 0.5 -73.6 -6.6
Schneider Small Cap Value SCMVX Small value 17.5 5.2 -44.5 -5.2
VanEck Vectors Russia RSX EM 17.5 1.2 -61.3 -2.9
Pacific Advisors Small Cap Value PASMX Small value 17.4 7.1 -54.8 -3.3

The worst big fund: Vanguard Global Capital Cycles (VGMPX) with a downside deviation of 19.1 – more than twice the market average – and $1.2 billion in assets.

Greatest 10-year down market deviation

Down market deviation can be thought of as “the downside in any sort of declining market.” Pure downside deviation includes only fund returns less than zero. Basically, DMDEV indicates the typical annualized percentage decline based only on a fund’s performance during negative market months. So, if the market drops by even 0.1% in a month, we report how each fund did and then project it over 12 months.

  Lipper category Down market deviation 10-year annual returns Worst drawdown vs peer group
Benchmarks          
Vanguard Total Stock Market VTSMX Multi core 7.8 13.5% -17.7 +1.7
Vanguard Balanced Index VBINX Growth allocation 7.8 9.6 9.0 1.0
           
Schneider Small Cap Value SCMVX Small value 17.5 5.2 -44.5 -5.2
Pacific Advisors Small Cap Value PASMX Small value 17.4 7.1 -54.8 -3.3
VanEck Vectors Brazil Small Cap BRF Latin Am 20.1 -0.9 -79.0 -1.2
iShares MSCI Brazil ETF EWZ Latin Am 19.9 -1.3 -70.7 -1.7
Miller Opportunity LMOPX Multi core 15.5 11.7 -39.8 -0.1
VanEck Vectors Russia RSX EM 17.5 1.2 -61.3 -2.9
Pacific Advisors Mid Cap Value PAMVX Mid core 15.2 3.6 -38.1 -8.0
Voya Russia LETRX EM 14.7 4.1 -53.3 0.0
Oberweis China Opportunities OBCHX China 14.2 7.5 -42.0 2.1
Hodges HDPMX Small growth 14.1 9.6 -37.0 -3.7

The worst big fund: Miller Opportunity Trust (LMOPX) with a down-market deviation of 15.5 – exactly the broad market average – and $1.5 billion in assets.

Greatest 10-year bear market deviation

Bear market deviation can be thought of as “the downside in a seriously declining market.” Basically, bear market deviation indicates the typical annualized percentage decline based only on a fund’s performance during bear market months. For equity-oriented funds, a bear market month is one in which the market declined by 3% or more in 30 days.

  Lipper category Bear market deviation 10-year annual returns Worst drawdown vs peer group
Benchmarks          
Vanguard Total Stock Market Index VTSMX Multi core 7.4 13.5 -17.7 1.7
Vanguard Balanced Index VBINX Growth allocation 3.9 9.6 9.0 1.0
           
Schneider Small Cap Value SCMVX Small value 15.0 5.2 -44.5 -5.2
Pacific Advisors Small Cap Value PASMX Small value 14.5 7.1 -54.8 -3.3
Miller Opportunity LMOPX Multi core 14.0 11.7 -39.8 -0.1
Pacific Advisors Mid Cap Value PAMVX Mid core 13.5 3.6 -38.1 -8.0
Oberweis China Opportunities OBCHX China 13.2 7.5 -42.0 2.1
Invesco Golden Dragon PGJ China 13.0 5.2 -44.5 -5.2
Hodges HDPMX Small growth 12.9 9.6 -37.0 -3.7
Cambiar Global Ultra Focus CAMAX Global multi value 12.7 9.3 -39.9 2.3
Auer Growth AUERX Small core 12.7 2.9 -36.8 -8.5
Invesco China Small Cap HAD China 12.6 2.9 -39.6 -2.5

The worst big fund: Miller Opportunity (LMOPX) again! It has a bear market deviation of 14, nearly twice the broad market’s.

Managers with some serious explaining to do

And if you’re still alive and your money is among the $3 billion entrusted to these folks, you need to be asking some serious questions of yourself, your financial advisor and your fund managers.

These are the funds that simultaneously fit into four bad boxes:

  1. Worst downside deviation – for 10 years!
  2. Worst down-market deviation – for 10 years!!
  3. Worst bear market deviation – for 10 years!!!
  4. Worst returns (bottom 20%) in the peer group for the past 1, 3- and 5-year periods. We designate those as “Three Alarm” funds.

Just to add a bit of salt to the wound, we’ve also noted their greatest loss over the past decade (called “maximum drawdown”) and we’ve ordered the table by how far they’ve trailed their peers annually over the past 10 years.

    APR Bear market dev Down market dev Downside dev Max drawdown vs. peers Assets
Benchmarks                
Vanguard Total Stock Market VTSMX Multi core 13.5 7.4 7.8 7.9 -17.7 +1.7 $845B
Vanguard Balanced Index VBINX Growth allocation 9.6 3.9 4.3 4.4 9.0 +1.0 $43B
                 
Nysa NYSAX Small Growth -4.7 10.9 12.5 14.9 -51.7 -18 $1.6M
Catalyst Small-Cap Insider Buying CTVAX Small Growth 3.7 12.5 14 14.7 -40.1 -9.6 10.3
CGM Focus CGMFX Multi Value 2.8 11.4 12.6 14.1 -42.2 -8.1 472
Pacific Advisors Mid Cap Value PAMVX Mid Core 3.6 13.5 15.2 15.6 -38.1 -8 2.9
TANAKA Growth TGFRX Multi Core 6 10.9 12.2 12.7 -27.1 -5.9 9.7
Mission-Auour Risk-Managed Global Equity OURAX Global Multi-Core 2.7 10.6 11.4 12.2 -39 -5.8 16.9
Pacific Advisors Balanced PAABX Growth Allocation 3 6.9 8.4 8.8 -29.9 -5.6 3.3
Schneider Small Cap Value SCMVX Small Value 5.2 15 16.5 17.5 -44.5 -5.2 28
Hodges HDPMX Small Growth 9.6 12.9 14.1 14.5 -37 -3.7 154
Bridgeway Ultra-Small Company BRUSX Small Value 6.8 10.7 12.1 12.9 -30.9 -3.6 67
CGM Mutual LOMMX Growth Allocation 5.1 6.8 8.4 9.2 -21.2 -3.6 304
Rydex S&P SmallCap 600 Pure Value RYAZX Small Value 7.3 12.5 13.7 14.6 -28.1 -3.1 35.6
RiverFront Asset Allocation Aggressive RLTIX Aggressive Growth Allocation 6.7 7.7 8.6 8.9 -22 -2.8 35.8
AllianzGI Micro Cap AMCIX Small Growth 11.1 11.5 13.2 13.8 -35.4 -2.1 17.3
Arrow DWA Tactical DWTTX Flexible 5 7.2 8.2 8.7 -19.1 -1.9 117
Bridgeway Aggressive Investors 1 BRAGX Multi Core 10.3 10.8 11.5 11.7 -31 -1.5 169
Adams Small Cap Value SCAPX Small Value 9.2 11.1 13 14.3 -40.2 -1.2 14.4
Hotchkis & Wiley Mid-Cap Value HWMIX Mid Value 10.3 11.1 12.5 13 -31.1 -0.9 964
AllianzGI Ultra Micro Cap AUMIX Small Growth 12.4 11.1 12.5 13.2 -31.2 -0.8 16.2
Putnam Capital Spectrum PVSYX Flexible 8.9 7.5 8.2 8.7 -29.7 2 632
                $3071M

Collectively, these funds have the poorest downside performance over the past decade, and consistently bad 1-, 3-, and 5-year returns. Nineteen of the 20 also trail their peers for the past 10 years.

The biggest dumpster fire?

At $99 billion, American Funds Investment Company of America (AIVSX) is the biggest Three Alarm fund, trailing 80% of its Lipper peers over the past 1-, 3- and 5-year periods. It’s trailed its peers (by 1.1% per year) over the past 10 years to boot. Morningstar awards it “Silver” status but recognizes it’s trailed 75% of its Morningstar peers over the decade.

I’m incredibly saddened to see the two Bridgeway funds (Aggressive Growth and Ultra-Small Company) here. They were once brilliant performers, their design and execution are data-driven and sensible, and their adviser is one of the most principled and admirable firms in the entire industry. They have funds with tremendous upside (since inception, BRUSX is up 1529% while the small-cap index is up just 975%), and tremendous downside; they share the tendency to be either at the very top or at the very bottom of their peer groups. Sticking with the funds now is a pure act of faith.

Two questions about the list as a whole:

  1. If they perform so poorly on the downside, why don’t they trail by much more?

    AllianzGI Ultra Micro, for example, has double-digit returns and trails in the long-term by just 0.8% a year.

    Answer: the past 10 years have been a relentless upmarket. Funds with bad downside performance have not been penalized a lot because there’s been much less downside than upside over the past decade.

  2. What’s up with Putnam Capital Spectrum? They have a substantial 10-year lead over their peers.

    Answer: the five fat years have been followed by the five lean years. Putnam had above-average to top-tier performance through 2014 and money poured in. Starting five years ago, in 2015, they’ve had absolutely bottom-tier performance and money poured out. Here’s the snapshot from Morningstar:

Bottom line:

It’s time. Downside deviation, down market deviation, maximum drawdown and bear market deviation are all tools designed to help you answer three questions:

  1. How bad can it get?
  2. Am I ready to suffer that much?
  3. Do I have to suffer that much?

Our list of Great Owl funds offers alternatives for those who don’t like the answers to 1-3. The Great Owls are funds with consistently excellent risk-adjusted performance, with special emphasis on resilience in down markets. While not all of them might be right for your portfolio, they illustrate the sorts of concerns that we think you should build into every portfolio.

Liquidity Risks and Warnings

By David Snowball

What’s the worst that could happen? Managers’ own words on liquidity risks

Liquidity seems like an awfully esoteric concern, something akin to “coverage ratios” or “yield to call calculations.” In general, it feels like background noise.

Your fund managers disagree. New research estimates that 50% of high-yield funds and, more importantly, 15% of all fixed-income funds are vulnerable to a liquidity crunch. To understand what that means, you first need to understand that “liquidity” means. If you need to polish up your understanding of the term – or your ability to explain it to clients – start with the section entitled What’s Liquidity? If you’re rock solid on the concept, then jump ahead to Welcome to a Liquidity Crisis.

What’s “liquidity”?

“Liquidity” is a really simple concept. It’s your ability to convert an asset you own to cash. If you have a $5 bill, you can walk into pretty much any store or bank in America and trade it for five ones. That’s a purely liquid asset. At the other extreme, trading in your time-share condo for cash is ridiculously hard and time-consuming, and you might end up writing off 50% of your investment just to cash out. That’s called an “illiquid asset.”

In order to liquidate an asset, you need two compatriots: you need someone with cash who’s willing to pay about what you’re looking for and you need someone to coordinate you and your buyer; that’s the middleman who hands you their cash, takes your asset in exchange and then sells your asset to the end buyer. That person’s called a “market maker.” Market makers have no earthly interest in owning the thing you’re selling; they just want to be the conduit between you and someone who will very promptly pay them a predictable amount for your asset.

Some assets are highly liquid; that means that there are always lots of prospective buyers out there willing to trade their cash for your assets. Examples of highly liquid assets are bonds or bills issued by the US Treasury (backed by “the full faith and credit” of the government) or stocks issued by blue-chip corporations.

Bonds issued by an economically challenged firm? Sort of liquid in good times. Given time and effort, you can probably get some sort of agreement with a potential buyer. But what happens to that same bond if the market (or the economy) suddenly sputters? The economically challenged issuer might see its chances of survival (hence, of repaying its bonds) go from 60% down to 40%. The potential buyers might well be spooked and be reluctant to shell out anywhere near the full price. Market makers might well be spooked about their ability to recover the money they’ve fronted and be reluctant to handle your sale. In short, unless you’re willing to sell for pennies on the dollar, you might find that you can’t sell at all.

In summary: Some assets are almost always easy to sell (T-bills). Some assets are almost always hard to sell (your time-share). Some are deceptively easy to sell when everything’s going right but near impossible to unload when it’s not (say, shares of ultra-microcap Paradise Inc. PARF which makes the candied fruit in fruitcakes and trades about 600 shares/day).

Welcome to a liquidity crisis

“Liquidity rarely matters, but when it does, it’s all that matters.” Savita Subramanian, Bank of America Merrill Lynch’s equity and quant strategist

Why bring the subject up now? Good question!

There have been structural changes in the markets that impair liquidity.

Liquidity markets require two sets of actors with ready access to cash: intermediaries or market-makers and ultimate buyers.

Market-makers are firms that exist to pair buyers and sellers. When you offer shares of your ETF for sale, a market maker buys them from you at a tiny discount to NAV and sells them to an interested buyer at a slightly higher price. Their profit resides in the often-tiny spread between what you sell a share for and what the next person buys the share for. Market-makers have a limited pool of money so they need to believe they can sell your share almost immediately for a predictable price. If they’re not sure they can sell fast and for a predictable price, they’re going to protect themselves by (1) not buying your share or (2) buying it at a discount to what you think it’s worth. As uncertainty grows, so do those two tendencies.

Structural changes have reduced the capital available to market-makers. The Fed is policing the size of banks’ capital reserves, and higher reserve requirements mean less cash allocated to market makers. As spreads narrow, which happens in bull markets, market-making becomes less profitable and banks allocate less there. So market-makers can handle high volumes if and only if the market is acting normal; as it becomes volatile, each trade becomes potentially riskier for them and their ability and willingness to handle high “sell” volume for iffy securities – from junk bonds and “barely-above junk” bonds to real estate and thinly traded microcaps – collapses.

The financial system used to have other reliable fallbacks which guaranteed liquidity for the best customers (read: Fidelity). Ed Studzinski notes that,

… in days of old, Goldman Sachs, Morgan Stanley, and their ilk used to be prepared at the end of a trading day, to hold a position overnight for good clients, recognizing that they should cut the price enough that they were willing to pay so that any loss they might incur overnight was more than covered by the margin in the price they paid … [not too long ago] they stopped being willing to hold securities overnight that were not liquid that they would sell the next day – in a nutshell, they did not want them on their books, given the complexities of the derivative and other positions they were holding, especially for their own accounts.

Most mutual funds (and we have written about this) have lines of credit with banks to cover the unhappy situation where they have more withdrawals than cash on hand.  “Committed lines of credit” are more-or-less guaranteed to be there, but you pay a higher fee  for the security; many funds rely on “uncommitted lines of credit” where they will lend to you if they can, but are assuming the Fed will flood the market with liquidity to keep a meltdown from happening.  

Ultimate buyers are the counter-parties, the people with cash and a willingness to buy from you at a price you can live with. If there’s a wave of selling, who’s available to buy? Traditionally, it might be value investors with lots of “dry powder” or mutual funds with cash reserves. As those two sets of buyers shrink, who takes their place? By definition, it’s not the managers of passive funds; they’re forced to sell when the market drops, they have neither the mandate nor the resources (remember, they’re fully invested all of the time) to buffer a fall. That means more and more of the responsibility lies with hedge funds, sovereign wealth funds, private investors and the owners of various dark pools.

So, liquidity may be increasingly impaired. That was illustrated in September. Much of this liquidity stuff takes place in something called “the repurchase market,” known slangily as “the repo market.”  The repo market serves as a source of short-term cash for the financial system; a mutual fund might borrow a few billion overnight, surrendering some of their portfolio securities as collateral. It takes about a trillion dollars a day to keep the repo market working and, on September 16-17, it ran out of liquidity. The Fed didn’t see it coming and hadn’t prepared for it. They hurriedly stepped in, making tens of billions available on short notice, to keep the short seizure from becoming a major crisis. The Fed, since then, has been pouring in additional billions to keep the market working and may need to re-establish a program to deal with other shortages. Ed notes, too, “that the U.S. Treasury market, which is supposed to be the most liquid in the world, has on occasion also seized up and become relatively illiquid in terms of the size trades you could put through without moving the bid-ask spread.”

Exceptional investors have gone hoarse yelling about the risk.

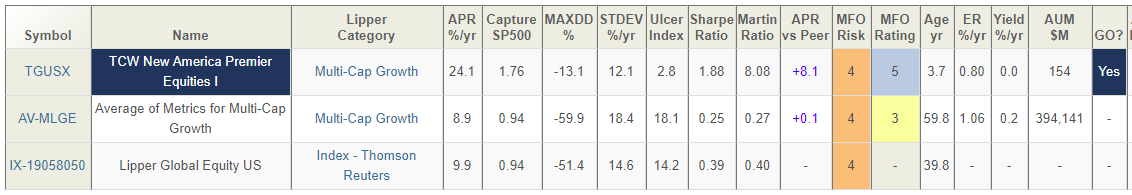
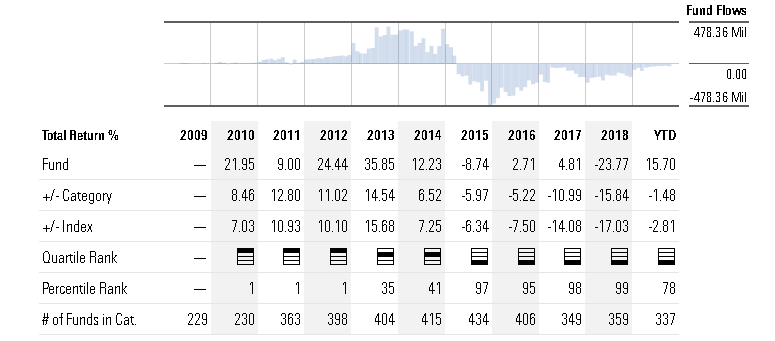
Quite beyond Ed Studzinski’s long series of reflections on liquidity losses, several other “A” tier managers or former managers have been speaking out. Tad Rivelle, TCW’s chief investment officer, a guy responsible for $175 billion in fixed-income assets and Morningstar’s 2005 Fund Manager of the Year recently published “Why a Liquidity Crisis Is Heading to a Market Near You” (September 2019). Rivelle’s argument is that the quality of the bond market – and the transparency of the financials for bond issuers – has taken a dramatic turn for the worse.

Traditionally, leveraged borrowers had this choice: borrow in the high yield bond market and live by the disclosure and reporting standards of the public debt markets. In the alternative, if management preferred to adhere to a lesser standard of disclosure, the company could issue in the (private) loan market and subject itself to a battery of covenants designed to limit the ability of management to engage in risky or lender unfriendly actions. Thanks to the central banks, borrowers in this cycle no longer had to choose: they could obtain cheap loans without agreeing to restrictive covenants nor providing on-going financial disclosure.

Hence, not only have the debt markets ballooned in size, but the growth has come disproportionately from those segments of the debt market where financial disclosure is poor:

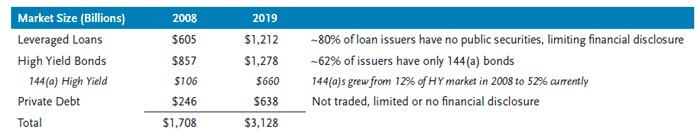
Source: JPM, Bloomberg Barclays, Prequin

While a paucity of financial disclosure is not problematic during a bull market for credit, it is a defining feature of a liquidity crisis during a bear market. Human beings are naturally inclined towards fear–even panic–when they are unable to obtain the information they deem critical to their (financial) survival.

The problem, in his mind, is that passive fixed-income funds have been scooping up sludge because the sludge is part of their index. What happens, he asks, when a recession turns the sludge toxic and antsy investors suddenly want the security of cash?

Thus far, in this cycle, passive funds have exploded in size. Anyone wonder what might happen should passive funds become large net sellers of credit risk? In that event, these indiscriminate sellers will have to find highly discriminating buyers who–you guessed it–will be asking lots of questions. Liquidity for the passive universe–and thus the credit markets generally–may become very problematic indeed.

Passive Fixed Income Funds (Including ETFs)

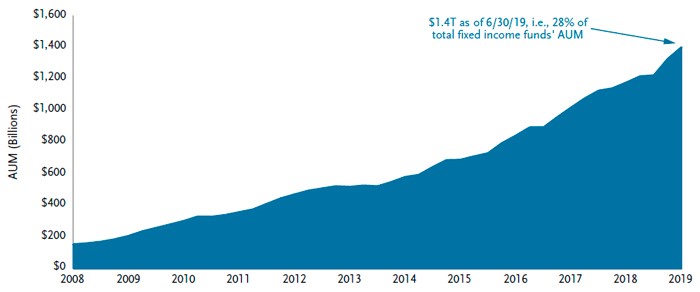
Source: Morningstar, TCW

He concludes that you might want to gather your security blanket now, while you still can:

Capital markets are reflections of human nature. So, until the robots take over, fear and greed will remain in the DNA of asset markets and result in bouts of liquidity wherein “anything goes” alternating with periods where “nothing” is believed. As such, while holding a portion of your net worth in such dull investments as cash or Treasuries forgoes some bragging rights, history suggests that it could be among the most important allocation decision you make in a late-cycle environment.

Bob Rodriquez, as befits a retired titan of finance, is rather more outraged. Mr. Rodriquez is one of only two managers to win Morningstar’s fund manager of the year three times (1994, 2001, 2008) and the only manager to win in both the equity arena (for FPA Capital) and fixed income (for FPA New Income). He was interviewed by Robert Huebscher in September 2019, with the edited version appearing in Rob’s Advisor Perspectives under the title, “The Fed is Clueless.”

Mr. Rodriquez’s argument might be summarized as “you’re all fools and you’re going to suffer a lot for a long time.” He warned a decade ago, in the wake of the Fed’s unprecedented interventions in the market, that the Fed was engaged in wishful thinking. They could offer up free money, which underwrote – and hence encouraged – bad behavior on the part of managers and investors. They issued ever-greater quantities of ever-iffier debt, and used to the proceeds for financial engineering – share buybacks, underwriting dividends, buying competitors – rather than for productive purposes. In consequence, he argued, the Fed stimulus wouldn’t achieve its fundamental goal of strengthening the economy. He believes that as the market gets shakier, the Fed’s interventions will become bolder, broader … and less effective. His recommendation, broadly speaking, is to strip your portfolio down to the best of the best.

When one believes the optimal capital structure is for elevated levels of leverage, one can be reasonably assured they are succumbing to the theory that “this time is different.” When this credit cycle ends, it will be among the worst, if not the worst, since the Great Depression. With such a high level of investment-grade corporate bonds hovering above a high-yield credit rating, in the upcoming recession, many fixed-income fund investors will be surprised by how their “investment” grade bond funds perform poorly. They should gain a better insight about the credit quality mix of their respective funds NOW!

Laura Kodres, a former division chief at the International Monetary Fund’s global financial stability unit, argues that the “hedge funds for the masses” philosophy, which makes complex and sometimes inexplicable magic wands available to the average investor, is likely to see enormous liquidity challenges when everyone tries to unwind their derivative positions simultaneously:

“There is a sense in which retail investors should have some opportunity to take risks that were previously just the purview of high-net-worth individuals,” Kodres told MarketWatch in an interview. But that democratization, she said, also has resulted in financial products that may be unable to sell their underlying assets quickly, if shareholders get spooked and they rush to pull cash out.

“To be fair, probably somewhere in the fund documents it says there is liquidity risk and redemptions are not guaranteed within 24 hours,” she said. “But I’m not sure everyone has read that fine print as closely they should.”

Her concerns lie not with standard funds that buy stocks that frequently trade on regulated exchanges, but with the swell of mutual funds that now hold less liquid assets, namely corporate debt, emerging-market bonds, and real-estate exposure that can take days (or months) to unload in a jittery market. (“Investors putting too much faith in mutual funds to return money in a panic, former IMF financial stability analyst says,” MarketWatch, November 12, 2019)

Bank of England Governor, Mark Carney, warned that investment funds that hold illiquid assets, but promise investors daily liquidity, were “built on a lie” and could pose systemic risks.

How likely are you to face such a risk in your own portfolio? Pretty likely, if Deutsche Bank is right. Deutsche Bank’s chief economist Torsten Sløk published research in November showing half of funds with high-yield assets would face liquidity shortfalls if managers experience a repeat of the worst redemption shocks felt between 2000 to 2019.

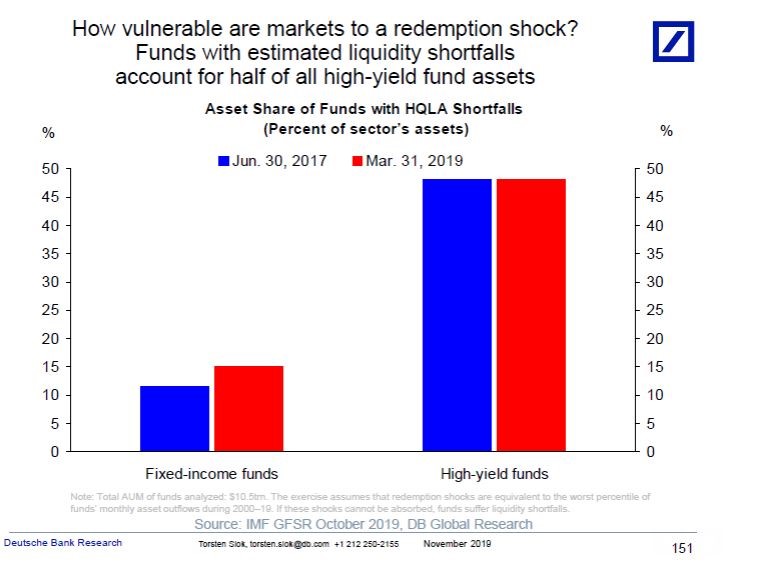
Source: Deutsche Bank

The left-hand bars might be scarier: perhaps 15% of all fixed-income funds – including “investment grade” vehicles – might face similar challenges.

What your managers are telling you about the risks you confront

Not all funds discuss liquidity as a principal risk, and some funds highlight liquidity in some years rather than others. In general, fixed income funds with a high-yield or international component, small caps and anyone reliant on the derivatives markets tend to share warnings, which are mostly unread.

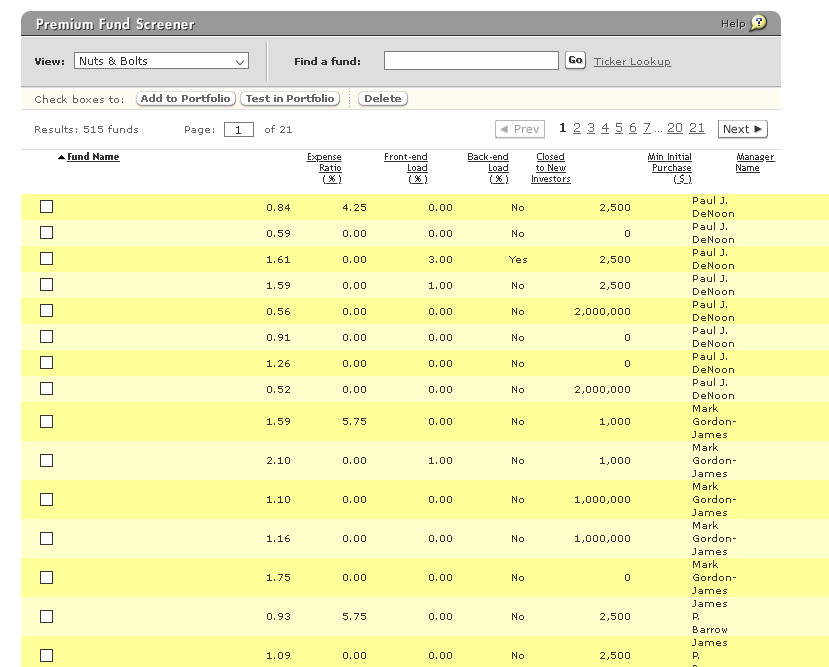
We searched the SEC website using “485a” and “liquidity risk” as our search terms. Those typically led to prospectuses (Form 485a) and liquidity discussions. We then sampled the first 20 results, not all of which represent the most recent version of the prospectus.

Why aren’t they the most recent ones? Uhhh … blame the algorithms?

For folks who have not read the liquidity risk disclosures in bond fund and ETF prospectuses, let me share some of their clearer warnings:

Met West: We “may not be able to sell at all”

Liquidity Risk: the risk that there may be no willing buyer of the Fund’s portfolio securities and the Fund may have to sell those securities at a lower price or may not be able to sell the securities at all, each of which would have a negative effect on performance. Over recent years, there has been a dramatic decline in the ability of dealers to make markets, which can further constrain liquidity and increase the volatility of portfolio valuations. High levels of redemptions in bond funds in response to market conditions could cause greater losses as a result. Past changes in regulations such as the Volcker Rule may further constrain the ability of market participants to create liquidity, particularly in times of increased market volatility. Met West Flexible Income 2018 prospectus,

TCW: Us too, “may not be able to sell at all”

Liquidity risk: the risk that there may be no willing buyer of the Fund’s portfolio securities and the Fund may have to sell those securities at a lower price or may not be able to sell the securities at all, each of which would have a negative effect on performance. TCW Concentrated Value Fund, 2016 prospectus

Russell, alternately the price we can get “may fall dramatically”

Liquidity Risk: Liquidity risk exists when particular investments are difficult to purchase or sell. The market for certain investments may become illiquid under adverse market or economic conditions independent of any specific adverse changes in the conditions of a particular issuer or a security’s underlying collateral. In such cases, the market price of certain investments may fall dramatically if there is no liquid trading market. Russell Small Cap High Dividend Yield ETF, 2012 prospectus

Vanguard, even if we buy liquid assets, they may “suddenly become illiquid for an indefinite period of time”

Liquidity risk is the chance that the markets, assets, and instruments in which the Fund invests are, or may become, illiquid. The advisor expects that the Fund generally will seek to invest in liquid markets, assets, and instruments, although the Fund may have the ability to invest a portion of its assets in markets, assets, or instruments that are or may become illiquid. There is no assurance that investments that were liquid when purchased will not suddenly become illiquid for an indefinite period of time. Vanguard Commodity Strategy Fund, 2019 Prospectus

PowerShares, derivatives “may not always be liquid”

Liquidity Risk. The Fund will invest in derivatives and other instruments that may be less liquid than other types of investments. Investments that are less liquid or that trade less can be more difficult or more costly to buy, or to sell, compared to other more liquid or active investments. This liquidity risk is a factor of the trading volume of a particular investment, as well as the size and liquidity of the market for such an investment. The derivatives in which the Fund invests may not always be liquid. This could have a negative effect on the Fund’s ability to achieve its investment objective and may result in losses to Fund shareholders. PowerShares Multi-Strategy Alternative Portfolio LALT, 2014 prospectus

iShares, real estate is like small caps, “relatively illiquid [with] abrupt or erratic price fluctuations”

Liquidity Risk. Investing in Real Estate Companies may involve risks similar to those associated with investing in small-capitalization companies. Real Estate Company securities, like the securities of small-capitalization companies, may be more volatile than, and perform differently from, shares of large-capitalization companies. There may be less trading in Real Estate Company shares, which means that buy and sell transactions in those shares could have a magnified impact on share price, resulting in abrupt or erratic price fluctuations. In addition, real estate is relatively illiquid, and, therefore, a Real Estate Company may have a limited ability to vary or liquidate properties in response to changes in economic or other conditions. iShares Evolved U.S. Healthcare Staples ETF (IEHS), 2018 prospectus

Here’s the one to post on your fridge:

iShares ESG 1-5 Year USD Corporate Bond ETF (SUSB), 2017 prospectus

Liquidity Risk. Liquidity risk exists when particular investments are difficult to purchase or sell. To the extent the Fund invests in illiquid securities or securities that become less liquid, such investments may have a negative effect on the returns of the Fund because the Fund may be unable to sell the illiquid securities at an advantageous time or price. To the extent that the Fund invests in securities with substantial market and/or credit risk, the Fund will tend to have increased exposure to liquidity risk. Liquidity risk may be the result of, among other things, the reduced number and capacity of traditional market participants to make a market in fixed-income securities or the lack of an active market for such securities. Liquid investments may become illiquid or less liquid, particularly during periods of market turmoil or economic uncertainty. Illiquid and relatively less liquid investments may be harder to value, especially in changing or volatile markets. Although the Fund primarily seeks to redeem its shares in-kind, if the Fund is forced to sell underlying investments at reduced prices or under unfavorable conditions to meet redemption requests or for other cash needs, the Fund may suffer a loss. This risk may be magnified in a rising interest rate environment or other circumstances where redemptions from the Fund may be greater than normal. Other market participants may be attempting to liquidate fixed-income holdings at the same time as the Fund, causing increased supply of the Fund’s underlying investments in the market and contributing to liquidity risk and downward pricing pressure. There can be no assurance that a security that is deemed to be liquid when purchased will continue to be liquid for as long as it is held by the Fund.

Bottom Line

I am not particularly apocalyptic, in general. I worry about things but try to keep a healthy distance from panic: humanity will survive, the Republic will survive, the markets will rise (and fall) again, the sun will rise again.

None of that excuses ignorance. As investors, we need to be aware of the risks we’re taking (or that others are taking on our behalf) and we need to be weather the worst-case outcomes that our choices engender. “Weathering” is starts with knowledge.

    1. What’s your asset allocation? How much downside does an allocation of that variety risk in a major correction?
    2. What have your managers said about how they view stewardship of your money? Do they imagine themselves as risk managers, or returns managers?
    3. To what extent can you explain what your managers actually do? Or what biases are embedded in your passive product?
    4. To what extent are you exposed to the assets: 144a bonds, private placements, high yield, EM bonds, microcaps, bonds that have undergone or are near downgrade that pose the most risk in a liquidity crunch?
    5. To what extent have they recalibrated the portfolio’s risk exposure in the past year?

If your answers to yourself are some combination of vaguely and mumbled, you might want to take a bit of time while the sun is still shining to check the darker corners.

David Sherman, an eminently sensible investor, spent nine pages in his last shareholder letter reviewing the risks that were, he believes, poorly accounted for by investors and the steps that he and his team have taken to de-risk his portfolios.

He closed his last shareholder letter with the same words we’ll share now: “Fall is here, winter is coming.”

Business Cycle Portfolio Strategy

By Charles Lynn Bolin

The mere fact that a belief is common and comfortable does not make it true. Accepting such beliefs makes you part of “the herd,” which is good only when the herd is thriving. But when the herd faces serious threats from hostile changes in their environment, whether it’s drought or wolves, the last thing you want is to have your survival tied tightly to the herd’s.

That holds true in investing, as well as in pastures.

Two such errors animate this month’s essay. First, there appears to be a widespread belief that investing according to the business cycle is market timing to make more money. Second, there’s a widespread belief that the measure of active management is its ability to “beat the market,” or at least the market’s raw returns. Neither is correct. Both adapting your portfolio to our place in the economic cycle and using active management are excellent ways to manage risk and strengthen our risk-adjusted returns. Similarly “active” management is compared unfavorably to index funds which usually invest within the same fund category. Market technician Gregory L. Morris, in Investing with the Trend: A Rules-based Approach to Money Management (2013), argues that active management and investing with the trend are about reducing risk. Mr. Morris was Senior Vice President, Chief Technical Analyst, and Chairman of the Investment Committee for Stadion Money Management, LLC. I concur.

Adjusting allocations across asset classes can be used to reduce risk and increase risk-adjusted returns. In this essay, we’ll review four business cycle models and create a fund rotation framework using 25 years’ worth of data and fund and category performance from the Lipper Global Data Feed, which I access through the MFO Premium screeners.

The simplest form of adjusting portfolios to the business cycle is to own four to six funds and adjust allocations during regular quarterly or annual rebalancing. For those who want to be more active, you may add a few sector funds or rotate between growth and value funds. Portfolios should remain diversified in each stage of the business cycle. In The Intelligent Investor, Benjamin Graham suggested a guiding rule that the investors should never have less than 25% nor more than 75% of their money in stocks. I also suggest a rule of thumb to never put more than 5% into any sector fund, closed-end fund, or riskier fund/Lipper Category.

The business cycle is clearest in the rearview mirror, but insights can be gained from reputable sources. Below are two opinions on global growth from the International Monetary Fund and UBS (Switzerland’s largest bank).

The Fidelity Figure of the Week for November 14th states:

The International Monetary Fund (IMF) cut their 2019 global growth forecast to 3%, matching the weakest performance since 2009. The IMF cites trade wars as a primary factor undermining the worldwide expansion. However, the IMF expects growth to rebound a bit in 2020.

“A Global Economic Recovery is Coming — but ‘Much Later’ than People Think, UBS Says”, CNBC

Our fear is that actually you are going to get a recovery, but it is much later than people think, and it is on a trajectory that is much flatter than people expect.

When the global economy is bumping along the bottom, it is time to be a “bit” conservative despite expectations that growth might rebound a “bit” next year.

Valuations Matter

The commonly cited price to earnings ratio is a poor measure of valuations because earnings are so cyclical. There are a host of other methods to measure valuation such as Warren Buffet’s market capitalization divided by gross domestic product, Robert Shiller’s cyclically adjusted price to earnings ratio, John Hussman’s market capitalization divided by gross value-added, and James Tobin’s Q Ratio of market value to replacement value. In Figure #1, I show my Investment Model composite indicator of five valuation methods. The market is much more highly valued than prior to the 2007 bear market but less so than prior to the bursting of the technology bubble in 2000. High valuations set markets up for steeper falls during bear markets.

FIGURE #1: VALUATIONS

Source: Created by the author based on St. Louis Fed Reserve (FRED) & S&P Dow Jones Indices

Below are quotes from investment professionals describing current market valuations:

John Hussman, “A Striking Collection of Duck-Like Features”:

The combination of extreme stock market valuations and depressed interest rates continues to imply dismal estimated expected returns for passive investors. As of October, our estimate of the prospective 12-year average annual total return for a conventional asset mix (invested 60% in the S&P 500, 30% in Treasury bonds, and 10% in Treasury bills) has declined to the lowest level in history aside from the week of the 1929 market peak.

Lance Roberts, “Corporate Profits Are Worse Than You Think”:

“If the economy is slowing down, revenue and corporate profit growth will decline also. However, it is this point which the ‘bulls’ should be paying attention to. Many are dismissing currently high valuations under the guise of ‘low-interest rates,’ however, the one thing you should not dismiss, and cannot make an excuse for, is the massive deviation between the market and corporate profits after tax. The only other time in history the difference was this great was in 1999.”

Crescat Capital, “Crescat Capital 1Q19 Letter: Dismantling the Bull Case: ‘Central Banks Do Not Have Your Back’ ” by Jacob Wolinsky, ValueWalk

Crescat’s macro model combines sixteen factors across key fundamental, economic, and technical indicators to time the stock market and business cycle. After the year-to-date rally, the model is just two percentage points from record overvalued and record late-cycle levels!

Business Cycle Model #1: Financial Physics

Two of the most educational books for me are Unexpected Returns: Understanding Secular Stock Market Cycles and Probable Outcomes by Ed Easterling, because they explain the differences in long periods of high stock market returns and low returns. Mr. Easterling was a professor at Southern Methodist University and founder of Crestmont Research which maintains interesting articles such as Financial Physics (Figure #2). Financial Physics shows the relationship between inflation and valuations upon stock market returns.

FIGURE #2: FINANCIAL PHYSICS

Source: Crestmont Research

To illustrate Mr. Easterling’s concept of secular markets, the S&P 500 returned nearly 17% annually from 1985 until 2000, rising from low valuations with high inflation culminating in the technology bubble. In the nearly 20 years since the bursting of the technology bubble, the S&P 500 has returned less than 6% annually. That the stock market has returned 11% for the past 35 years misrepresents that the majority of the gain was in the first 15 years.

Figure #3 shows the performance, including dividends and expenses, of Vanguard Wellington (VWELX) with about 65% stocks, the Vanguard Wellesley Income (VWINX) with about 35% stocks, and the S&P 500 (VFINX) over the past 22 years. It took the Wellington fund 15 years following the bursting of the 2000 bear market to outperform the more conservative Wellesley fund and another 5 years for the S&P 500 to catch up. Recessions have not been eliminated and we are in the late stage of the business cycle.

FIGURE #3: ILLUSTRATION OF SECULAR PERFORMANCE

Source: Portfolio Visualizer

Regarding valuations, Mr. Easterling writes (The P/E Summary October 3, 2019):

In the third quarter, the stock market gained an additional 1.2%. As a result, normalized P/E increased to 32.7—significantly above the level justified by low inflation and low-interest rates. The current status remains “significantly overvalued.” Note that stock market valuation is in a zone of exuberance such that each higher level (or slight decline) is equally “high.”

Business Cycle Model #2: Six Stages

Martin Pring was described in Forecasting Financial and Economic Cycles (1994) by Michael P. Niemira and Philip A. Klein as advocating a six-stage business cycle framework which is shown below. Mr. Pring has written numerous books that I found informative and runs the InterMarket Review. The six-stage business cycle model shows how stocks, bonds, and commodities perform during each of the stages.

FIGURE #4: MARTIN PRING’S SIX STAGE BUSINESS AND MARKET CYCLE MODEL

The six stages of the model are summarized by StockFigures as follows:

    • Stage 1 shows the economy contracting and bonds turning up as interest rates decline. Economic weakness favors loose monetary policy and the lowering of interest rates, which is bullish for bonds.
    • Stage 2 marks a bottom in the economy and the stock market. Even though economic conditions have stopped deteriorating, the economy is still not at an expansion stage or actually growing. However, stocks anticipate an expansion phase by bottoming before the contraction period ends.
    • Stage 3 shows a vast improvement in economic conditions as the business cycle prepares to move into an expansion phase. Stocks are rising and commodities are anticipating an expansion phase by turning up.
    • Stage 4 marks a period of full expansion. Both stocks and commodities are rising, but bonds turn lower because the expansion increases inflationary pressures. To combat this, interest rates start to move higher.
    • Stage 5 marks a peak in economic growth and the stock market. Even though the expansion continues, the economy grows at a slower pace because rising interest rates and rising commodity prices take their toll. Stocks anticipate a contraction phase by peaking before the expansion actually ends. Commodities remain strong and peak after stocks.
    • Stage 6 marks a deterioration in the economy as the business cycle prepares to move from an expansion phase to a contraction phase. Stocks have already been moving lower and commodities now turn lower in anticipation of decreased demand from the deteriorating economy.

Business Cycle Model #3: Four Stages

Fidelity does a great job explaining secular and cyclical markets in How to Invest Using the Business Cycle. If an investor wanted to sit down for an hour and understand the current investment environment with respect to business cycles, this Fidelity presentation is where I recommend starting.

FIGURE #5: FIDELITY INVESTMENTS FOUR STAGE BUSINESS CYCLE MODEL

Source: Fidelity Investments

Figure #6 shows Fidelity’s assessment of sector performance during the business cycle.

FIGURE #6: SECTOR PERFORMANCE BY BUSINESS CYCLE

Source: Fidelity Investments

The secular trends that Fidelity identifies are:

    • Less rules-based and less market-oriented global system
    • Peak globalization
    • Higher political risk
    • Inflationary pressures
    • Pressures on productivity growth and corporate profit margins
    • Slower global growth with emerging markets leading
    • Slower long term growth in the US (less than 2% over the next 2 decades)
    • Long term rise in interest rates

These trends have widespread implications for investors. High debt levels and deficits are a concern of mine. For government spending in general, entitlements will have to be reduced or taxes raised. Rising interest rates and inflation will not favor bond investors.

Business Cycle Model #4: Growth and Inflation

The Era of Uncertainty: Global Investment Strategies for Inflation, Deflation, and the Middle Ground (2011) by Francois Trahan and Katherine Krantz is another insightful book about investing according to the business cycle. Francois Trahan is UBS’s head of U. S. equity strategy, and Katherine Krantz is a Managing Director at UBS. I created the following table based on their book. They create a nine-box investment style based on economic growth and inflation. The yellow shaded area is what they say does well during a low growth, low inflation environment. If you believe that we are moving toward a recession with deflation and low growth then government bonds, cash, gold, staples, health care, and utilities are the investments to own. If you believe that growth will pick up and inflation will stay low then corporate bonds, technology, financials, and consumer discretionary funds are the place to be.

TABLE #1: ERA OF UNCERTAINTY GROWTH VS INFLATION MODEL

Source: Developed by Author Based on Era of Uncertainty

Balanced Fund by Stage

I use the Vanguard Wellesley Income and Vanguard Wellington Funds for comparisons by stage, using the S&P 500 as a baseline. The stages were selected on business cycle indicators for the past 25 years and not by cherry-picking the tops and bottoms of the stock market. Table #2 shows the average annualized return and average Maximum Drawdown. The Vanguard Wellington and S&P 500 outperformed the conservative Wellesley fund during the early and middle stages, but the gap narrowed in the late stage. The Wellesley was far superior during the recessions. This is reflected in the drawdowns.

TABLE #2: FUND PERFORMANCE BY STAGE

Source: Portfolio Visualizer

Developing a Business Cycle Allocation Model

Keep it Simple. A model built on sound principles will probably survive the tumult of the markets much longer and much better than an overly complex model. Complexity tends to fail, and unfortunately, usually at the worst time… It seems that too often investors associate complexity with viability. That is not correct.

Investing with the Trend: A Rules-based Approach to Money Management, by Gregory L. Morris

In developing an allocation strategy, I wanted to look at what has done well during the past 25 years, taking into account that each business cycle and recession is different. The best Lipper Categories are grouped by business cycle stage to provide longer periods of time where funds may outperform.

Powerful, user-friendly databases allow the individual investor to do an incredible amount of research. I divided the past 25 years into four stages of the business cycle using the St. Louis Federal Reserve FRED database based on the Federal Funds rate, Inflation (PCE Price Index), Unemployment Rate, Real GDP, and recessions. I used the Mutual Fund Observer to create a list of 146 diverse exchange-traded funds in existence before the 2007 recession, and two lists of mutual funds with a few closed-end funds. I then used Portfolio Visualizer to create two portfolios for each stage of the business cycle. I combined the portfolios by Objectives that performed well during each stage of the business cycle.

Table #3 shows the Core Funds including cash, short term and general treasuries that should be in every balanced portfolio. Both retail and institutional investors have been increasing allocations to money funds for the past several years while the stock market valuations increased and risks have risen. Real estate is a broad classification and there is usually one type of real estate that is doing well in each stage of the business cycle. One simple rotation strategy is to own more of a moderate or growth mixed-asset fund like Vanguard Wellington (VWELX) during the early and middle stages of the business cycle and more of a conservative mixed-asset fund like Vanguard Wellesley Income (VWINX) during the late and recession stages.

The bond funds that do well in the early and middle stages of the business cycle are Corporate Debt BBB-Rate, High Yield, and Corporate Debt A-Rated. In the late stage of the business cycle when the Federal Reserve is raising rates then Ultra-short Obligations, short term investment grade, and U. S. Government debt do well. As interest rates stop rising or start to fall, Municipal Debt, Core Bond, GNMA, U.S. Mortgage, and Global Income do well. As the economy goes nears a recession, quality debt like Government intermediate debt and Municipal Debt do well. General Bond does well during recessions and into the early stage, but in the mid to late stages, Municipal High Yield, Flexible Portfolio, and Inflation Protected Bonds tend to do well.

TABLE #3: CORE AND BOND FUND ROTATION BY BUSINESS STAGE

Source: Created by the author based on Mutual Fund Observer and Portfolio Visualizer

Table #4 shows which equity objectives do well by stage. As the economy starts to recover, natural resources, technology health care, financial services, growth funds, small-cap funds, and industrials tend to do well. In the latter stages, consumer staples, utilities, large-cap value, equity income (Dividend Funds) and low volatility funds do well.

TABLE #4: EQUITY FUND ROTATION BY BUSINESS STAGE

Source: Created by the author based on Mutual Fund Observer and Portfolio Visualizer

Other categories may be considered by some investors as shown in Table #5. Precious metals tend to do well in the late stage, recessions, and the early stage because of uncertainty or recessions.

Alternatives: These strategies usually come to fruition during the mid- to later years of secular bear markets, when investors realize that passive investing is no longer working. Futures, hedging, options, and a whole host of derivative products are used across the board of the alternatives strategies.

– Investing with the Trend: A Rules-based Approach to Money Management, by Gregory L. Morris

TABLE #5: “OTHER” FUND ROTATION BY BUSINESS STAGE

Source: Created by the author based on Mutual Fund Observer and Portfolio Visualizer

Top Ranked Funds

Since last month, I have made some changes to my ranking system. I used the Ulcer Index, Martin Ratio, MFO Risk, MFO Rating, and performance during recessions to divide the funds by Objective into Buckets to categorize funds by withdrawal needs. The Ulcer Index factors together with the depth and duration of a fund’s drawdowns; funds that go down a long way and stay there a long have higher Ulcer Indexes. Bucket #1 is for money that needs to be kept safe. The MFO Rating assesses a fund’s risk-adjusted returns based on the Martin Index; the Martin Index itself measures a fund’s performance during drawdowns, based on the logic that volatility on the upswing is annoying but volatility on the downside is disastrous. Only the top four categories per bucket are listed in Table #6. I also added funds that tend to do well when inflation is increasing.

Each month I download about a thousand funds from MFO Premium MultiSearch. I rank objectives and funds based on Momentum (3 and 10 month trends and moving averages), Quality (bond rating, low leverage, Fund Family Rating, Ferguson Metrics, composite ratings), Valuation (price to earnings ratio, price to cash flow, price to book), Risk (Ulcer Index, MFO Risk, capture metrics, debt to equity, performance during recessions), Risk-Adjusted Returns (Martin Ratio, MFO Rank, Great Owl Classification), and Income (Yield). The data in Table #4 is based on the past two years from November 2017 to October 2109 because I like to capture the rotation to late business cycle stage investments. The Bear column is the average performance during the past two recessions.

TABLE #6: TOP RANKED OBJECTIVES BY BUCKET (NOV 2017 to OCT 2019)

Source: Created by the author based on Mutual Fund Observer

Top-ranked funds are listed in Table #7 for each Objective. “Other” refers to no-load funds available through Charles Schwab. Cohen & Steers Global Realty (CSSPX) has a minimum investment of $100,000, but I include it because I am able to purchase it through an employer-sponsored plan with no minimum. The low-minimum “A” shares of the same fund are available no-load/NTF through Schwab as well.

TABLE #7: TOP RANKED FUNDS BY OBJECTIVE AND BUCKET

Source: Created by the author based on Mutual Fund Observer

This month, I loaded the 10 top-rated funds from each of Vanguard, Fidelity, mutual funds available at Schwab, closed-end funds, and exchange-traded funds into Portfolio Visualizer and created a portfolio of 18 funds. I show more funds than necessary for a diversified portfolio to give readers a selection. Since November 2017 (two years), the portfolio has a correlation of 0.71 to the US Stock Market, a Sortino Ratio of 2.5, and a maximum drawdown of less than 2%. The average annual return was 7.4% with a yield of 3.3%.

TABLE #8: MODEL PORTFOLIO PERFORMANCE NOV 2017 TO OCT 2019

Source: Created by the author based on Mutual Fund Observer

Notes:

    1. Funds highlighted in blue are MFO “Great Owl” funds, which have top-tier risk-adjusted returns in every trailing measurement period longer than twelve months.

The MFO Premium screener defaults to showing a fund’s oldest share class (OSC), which is often the institutional class. That does not mean that your access is limited to the high minimum version. For example, JERIX has a minimum investment of $100,000 at Charles Schwab but the fund offers five other share classes, including a no-load, retail “T” class, JERTX, with a $2500 minimum.

Closing

This article highlights some of the philosophies that have influenced me over the past decade. I find the new Mutual Fund Observer Portfolio Tool (MFO Premium access required) to be one of the best “keep it simple” tools for the individual investor. It gives me a quantitative method for pruning funds that no longer fit into my “sleep at night” lifestyle.

Books and Articles about Business Cycles

MFO’s December 2019 on books and sanity highlights books that aren’t explicitly about markets and investing. Those books emphasize virtues like distance, fresh perspectives and, well, sanity. I’d like to supplement those with some technical works, including essays I’ve published elsewhere, that are more narrowly focused on the significance of business cycles in your success as an investor. I hope you find them provocative and profitable!

Business Cycles: History, Theory and Investment Reality, (2006) by Lars Tvede

Business Cycles (1999) by Francis X. Diebold, Glenn D. Rudebusch

The Age of Deleveraging: Investment Strategies for a Decade of Slow Growth and Deflation, (2011) by A. Gary Shilling

Recessions and Depressions: Understanding Business Cycles (2010) by Todd A. Knoop

Business Cycle: Simple Portfolios by Stage, Charles Lynn Bolin

Business Cycle: Boring Bond Funds, Charles Lynn Bolin

Business Cycle: Slowing Sales with Growing Inventories, Charles Lynn Bolin

Disclaimer

I am not an economist nor an investment professional. I became interested in economic forecasting and modeling in 2007 when a mortgage loan officer told me that there was a huge financial crisis coming. There were signs of financial stress if you knew where to look. I have read dozens of books on business cycles since then. Discovering the rich database at the St. Louis Federal Reserve (FRED) provides most of the data to create an Investment Model. The tools at Mutual Fund Observer provide the means for implementing and validating the Investment Model.


Rearranging the Deck Chairs

By Edward A. Studzinski

Democracy is grounded upon so childish a complex of fallacies that they must be protected by a rigid system of taboos, else even half-wits would argue it to pieces. Its first concern must thus be to penalize the free play of ideas. In the United States, this is not only its first concern, but also its last concern.

Henry Louis Mencken, In Defense of Women (1918)

We are at that time of year when people should be reviewing their investment portfolios with a view towards adding or removing investments that (a) no longer suit their goals and objectives or (b) have met their goals or objectives and need to be replaced or (c) the investments have fundamentally changed. There is also the need to review tax or estate planning issues, as well as liquidity needs.

Following My Own Advice, At Last

Years back I observed that too many of us, myself included, owned too many mutual funds/pooled investments in publicly traded securities. If memory serves correct, I found to my horror that while I thought ten or less was the appropriate number, I had around twenty. Apropos of David’s comments this month about portfolio pruning, I have been doing a substantial amount of it. Some of it has been driven by the realization that I had become over-diversified (and I strongly suggest that one look at the holdings of the funds that one owns to see if you have drifted into that situation – you don’t need three funds that all own in their top ten J.P. Morgan Chase, Alphabet, Bank of America, Amazon, and the like). Often you will find that large cap active managers have effectively indexed themselves. I have moved to do what I have told others to do, seek uncorrelated investments. And then there is the control issue. I realized that I could do at least as good a job selecting individual equity investments as most of the fund managers whose products I was looking at. With that came the control over when to realize gains or losses from an individual tax perspective.

Parts of this process are relatively easy to implement. One does not need to have three different tax-free money market funds, a commercial paper and a U.S. government money market fund. Depending on your situation, one should be enough. You may find that your brokerage firm, for liquidity reasons, will probably force you into a government money market fund as a clearing vehicle. Find a provider that is large enough to deal with the vagaries of money market instruments. It should also be large enough to not “break the buck” when money markets go haywire. Which means we are talking about a Schwab, a Fidelity, a Vanguard, or a Northern. Costs are key. You are best off with the low-cost provider with the best back office service.

The equity portion of the assets will be the most difficult area for individuals to handle. Increasingly, given the governance structure of most 1940 Act mutual funds, you have a board of trustees, and an announced investment methodology. Most likely there is an investment committee or committees. In today’s world, that is a cumbersome process where a day’s delay can eliminate an inefficiency and investment opportunity. I look for vehicles where the process has a smaller number of steps to go through.

The ideal is the one-person investment committee. You are more likely to see a shortened chain in a limited partnership investment vehicle (with restricted liquidity, for qualified investors) or, in some closed-end funds. And closed-end funds may give you a greater bang for your buck given that they are often selling at a 10 to 15% discount to net asset value. But that discount only becomes real to you in a tax-free situation, which is why some closed end funds are the ideal vehicle for a Roth IRA. And now that we are living in a zero trading-commission world, the disadvantage relative to no-load funds is gone. Since the capital structure is fixed, there is no potential redemption problem. Assuming an ethical management that does not dilute you with rights offerings, but rather repurchases stock when appropriate, you have a value investor’s preferred structure.

There is a column about closed-end funds in this weekend’s Barrons (12/2/2019) by Leslie Norton on page 29 entitled “These Ancient Funds Keep Beating the S&P.” I recommend it. These are funds that survived the 1929 Crash. Of course, one reason the funds have achieved that kind of long-term success is that they are not getting cash at the wrong time (top of the market) that they have to invest nor do they have to sell things at the wrong time to meet redemptions. To buy something they generally must sell something. I would suggest that the three funds that she highlights first – Central Securities (CET), Adams Diversified Equity (ADX), and General American Investors (GAM) are worthy of a look by those with a long-term focus. I would also strongly suggest that one read the annual and semi-annual reports for those funds, to get a sense as to how they communicate with their investors.

Hedge Fund Exodus

Besides the spate of stories about funds, especially small cap funds, liquidating, there have been a number of hedge funds shuttering. Funds that have taken a “macro” approach have been especially hard hit. The most recent to announce a closing, at least to outside investors, has been Moore Capital, run by Louis Bacon. He joins others such as Stan Druckenmiller, who has scaled back his Duquesne Capital to a family office operation.

Last month, I wrote about the ability to earn a positive alpha having been arbitraged away in many instances. The increase in the number of algorithmic quantitative hedge funds that will exploit even the most minute inefficiency in the marketplace has made life even more difficult, nay impossible, for the traditional global macro hedge funds. For the twenty years from 1990 to 2010, those funds gained an average of 14.4 per cent a year. In 2019 to date, they barely exceed 5%.

This complements the failure of active stock pickers to succeed in the current environment. On the one hand, firms such as AQR have launched funds that quantitatively try to mimic the types of investments made by Warren Buffett (good luck with that). At the same time, investors such as Jeff Vinik have dipped their toes back into the investment water, only to pull them out rather quickly. A lack of patience by institutional investors, coupled with caution about high fees in general, has made investors such as David Scarozza, head of equities at the Commonfund unwilling to pay high fees for “simple ideas he could easily access through an index.” One thus finds the active stock pickers who are relative value players continually falling behind as well. They are using the approach of regression to the mean to rather cheaply endeavor to provide a strategy that generates excess returns without overpaying for deep research analytical talent. They end up lagging in terms of both performance and asset retention. It remains to be seen whether the absolute value investors will end up similarly or be able to provide a differentiation that provides an excess return over time over the germane benchmark.

Year-End Book List

I will leave it to others to put out the reading list of the usual suspects of investment and finance books that talk about gambling, poker playing, horse racing, blackjack, and other skills thought to provide an edge in investment management. I find myself in agreement with David Rubenstein, of Carlyle, who is of the opinion that too few Americans these days know anything about their history. To solve that problem, he has come out with a book entitled The American Story: Conversations with Master Historians, which is a collection of interviews with famous historians. They are discussing famous individuals in American history, such as John Adams, Alexander Hamilton, Lincoln, Martin Luther King, and Lyndon Johnson. I would agree with the thought that those who are ignorant of history are condemned to repeat it, which should be of great concern.

The other book I recommend I learned about from a recent presentation at The Pritzker Museum and Library. The Australian historian David Stahel was speaking about his new book, Retreat from Moscow, about the German army’s retreat in 1941 from Moscow. Mr. Stahel’s specialty is researching and writing about the Eastern Front in WWII. He has published several books on that topic. We as Americans tend to know a lot about the Western front in Europe in WWII, the battles in North Africa, western Europe, and Italy. We tend to know very little about the Pacific War, which was really the American war and a separate one. And we know next to nothing about the Eastern Front.

One of the questions that I put to Mr. Stahel at his presentation was how the Americans and British would have fared had the German army taken up static defensive positions in Russia after October of 1941. Mr. Stahel indicated he hates hypotheticals, but then proceeded to answer me. Seventy-five per cent of the Wehrmacht, the cream of the German army, was on the Eastern Front in 1941. The casualty ratio at that time was six Russian casualties for every one German casualty. It raises questions about how things would have gone had the Soviets not been willing to take the kind of casualties they took and the Germans been able to shift more of their front line troops to the west. It also puts into perspective some of the resentments felt even today by Russians about the costs to them of “The Great Patriotic War.”

Why is Stahel interesting, especially from an investment perspective? In his in-depth research (down to reading diaries), he tends to stand things on their head and reach conclusions that are very different from conventional wisdom. Being inculcated with that approach and methodology is not a bad lesson to take and apply to looking at the investment and asset management world today. After all, we are, with a world of negative interest rates, someplace we have not been before. And dealing with those facts will require a different mindset than those that have been in place to date.


Reduce your 2020 risks by 50% with this one move!

By David Snowball

(Made you look.)

(And I’m not the only one who has.)

Those are emblematic of stories designed to tease you into clicking, just to discover what the secret financial move or stock is. The web is awash with them.

Why are people trying to tease you into clicking?

The nature of journalism has changed, and not for the better. Here’s the synopsis of my October 2019 AAII presentation on the matter:

  1. Under the traditional model of journalism, the “news hole” – the amount of news that could reach people – was limited to about an hour of broadcast news time and some number of column inches in your local paper. Back then, we paid journalists to gather and vet news candidates and we paid editors to screen out the worst of the trash: poorly sourced stories, invented controversies, and stuff that couldn’t be carefully checked before it reached the public. Journalists tended to be professionals and tended to value verification of stories.
  2. The launch of CNN in 1979 blew up the news hole. Suddenly, a network, and soon its competitors, had to find something … anything … to fill nearly 9,000 hours a year of airtime. That meant more “citizen journalists” – aka “person on the street” interviews and scrapping the verification process in favor of immediacy: “get it on air first” trumped “get it right.”
  3. The worldwide web dealt a near-fatal blow to traditional journalism. Every goober with a keyboard, an opinion and a modest set of technical skills could emerge as a journalist. “News” was everywhere, and everywhere “free.” People abandoned paid outlets, newspapers and magazines, in droves in favor of free and fascinating words from the web. The economic model of traditional journalism began to implode, and layoffs reached the tens of thousands. The standards of traditional journalism likewise imploded; get read, get seen, get eyeballs, get clicks all succeeded “get it right.”
  4. The arrival of the web in your pants pocket made it all much worse. People find it almost impossible to put their cellphones down. Researchers report that the average American has 80 sessions a day on their phone, where a “session” occurs any time you wake the phone up from sleep mode to do something with it. On average, we touch, tap or stroke our screens 2,000 times a day with the vast majority of touches tied to web surfing or social media use.

That addictiveness is not accidental, it’s a carefully designed element of our mediated connection. It’s not a side effect, it’s a design feature.

As a practical matter that means:

    1. You’re awash in a sea of noise.
    2. You’re paying a lot of attention to it.

This leads us to the one magic move which will dramatically reduce your losses, reduce your blood pressure, improve your sleep, brighten your smile and revive your romantic … oops, better not go there!

Turn off your browser for the next three months. The more specific and focused advice is:

Do an end-of-year gut check on your portfolio. Do you own more funds, ETFs and equities than you can count, much less follow? If so, check our Portfolio Pruning Guide <insert link>. Do you hold more than 50% equities in your portfolio? If so, check our research on The Discreet Charm of a Stock-Lite Portfolio. As an illustration, let’s look at the performance of several fund categories over this entire market cycle, beginning in October 2007.

Lipper Category Stock exposure Maximum loss Recovery period Annualized returns
Conservative allocation 30% -24% 29 4.1%
Moderate allocation 60% -35 38 4.6
Aggressive allocation 75-90% -51 64 4.5

Here’s one way to read that: a stock-heavy portfolio crashed by 51% and took over five years to get you back to where you started. Your willingness to ride that roller coaster rewarded you with 4.5% returns. A stock-light portfolio lost less than half as much, recovered in less than half the time, and still returned 4.1%.d

Stop following the financial media, at least until the crocuses bloom in spring.

Why? Two reasons.

First, these people have no clue but have a vested financial interest in pretending they do.

Yup – these all appeared side-by-side on the same day. So, which is it? Are you about to lose all your money or have we dodged a stock market bubble? Do we have 10 more years of rising markets or will it all meltdown soon? Is Dalio staking billions in a bet against the market, or isn’t he? And, regardless, should you care?

Second, you have no clue. In particular, most of us – individual investors and advisors alike – have no idea of what portfolio moves to make in the face of specific, individual threats. Read the chart below carefully, there’s going to be a quiz.

Quiz question #1: The Fed misjudges the strength of the economy in making its next move and imprudently reduced the overnight rate. What changes should you make in your asset allocation or sector exposure to buffer the effects of their error?

Quiz question #2: There is a sudden disruption in the US shadow banking system, interrupting capital access for low-income borrowers. Should you change your exposure to consumer discretionary stocks, high-yield bonds, both or neither?

Quiz question #3: The Saudis and Iranians are simultaneously stupid; oil spikes to $110 / barrel. What do you do? What do you do?

If your only answer is “Sell stocks! Sell stocks! Sell more stocks!” then you’re over-exposed to the stock market now. And you’re not particularly capable of making crafty tactical moves to exploit the stuff that keeps dominating the financial media’s headlines.

So why are you reading them? They create anxiety (that’s a design feature: they’re trying to tease and terrify because that’s what it takes to drag you in) and raise the risk that you’re going to do something ill-informed in the midst of a crisis. As actual bad-ness in the market or the economy manifests, the headlines (from the clueless) will become even more hysterical, making us feel and act worse.

What might you do instead?

How to read a book, again

A lot of us read fewer books than once we did, with many lamenting their diminished attention span and having lost the art of “getting into” a book.

Don’t demand “relevance.” There’s nothing dumber than selecting a book “because I need something that’s going to help me get ahead.” Meh. That’s “book as broccoli” and it doesn’t work. You’re far more likely to grow from immersing yourself into Ursula LeGuin’s Left Hand of Darkness or Barbara Tuchman’s A Distant Mirror: The Calamitous 14th Century – which will offer you possibilities you’d never imagined – than you’ll ever get from the latest tome on corporate culture or life coaching.

Fifteen minutes with a book is better than fifteen minutes without. Don’t deter yourself with impossible expectations. Some days I might find an hour, many days I can sneak in just 15-20 minutes lying in bed with my Kindle. Finding 15 minutes a day is a grand victory.

Celebrate stacks of unread books, they’re not signed of failure, they’re opportunities awaiting their moment.

Read free samples, which are available for almost all Kindle books. Download 20 samples to your e-reader, tablet or phone. It takes hardly more than five minutes with a book to know whether it’s a keeper or best in someone else’s library.

Don’t feel compelled to finish every book you start. Some authors need only five pages to create a spark, others have tried to stretch a fascinating 10 page essay into a dreadful 300 page book.

Avoid ghost-written pap from politicians, celebrities, celebrity-politicians, self-proclaimed gurus and their children. Any book that began with a consultant’s declaration “we need you to have authored a book” is best viewed as potential compost.

Read books.

Read books that others don’t read. Skip the bestsellers for the best thinkers. Skip the “books as broccoli” bit and try to reignite the delight you once felt, whether it was from The Lord of the Rings, Harry Potter and the Sorcerer’s Stone or A World Lit Only by Fire.

There are two arguments for that. First, if you want to be able to act differently you must first be able to think differently. Books feed thoughts. Books with unexpected perspectives feed unexpected thoughts. Second, books create distance. If you spend your every moment marinating in today’s panic – or today’s FOMO moment – you’re going to assume that whatever is loudest, whatever is brightest, whatever is most in your face, is most important.

It isn’t.

Books for the months ahead, recommendations from the folks at MFO and really smart people.

Ed Studzinski offers his book recommendations, both timely and timeless, in his essay this month.

Lynn Bolin, engineer, data guy, and MFO columnist

Mastering the Market Cycle is a good read in my opinion because it is a topic that I believe in and practice. I like it because it is a good refresher on business cycles with good philosophic insights into market cycles. Distortions in perceptions of risk by some in the media have been driving the markets for the past two years. I particularly like Mr. Marks’s philosophy that investors should adjust their balance toward aggressiveness and defensiveness over time in response to the investment environment.

Warren Buffett, impossibly rich guy

The Most Important Thing Illuminated: Uncommon Sense for the Thoughtful Investor (2013), by Howard Marks and Paul Johnson. Mr. Marks gets an awful lot of respect for the quality of his thought and writing, so it seemed worthwhile to share two of his works with one, one more technical and one more global.

Bill Gates, rich guy, a friend of and card-playing partner with the aforementioned rich guy.

The Myth of the Strong Leader: Political Leadership in the Modern Age (2014). “From one of the world’s preeminent political historians, a magisterial study of political leadership around the world, from the advent of parliamentary democracy to the age of Obama.”

Charles Boccadoro, retired engineer, teacher and impresario of MFO Premium and its suite of tools

Salt, Fat, Acid Heat by Samin Nosrat will forever change the way you think about food, cooking, and even eating.

Amit Wadhwaney, value investor, founder of Moerus Capital, manager of the Bronze-rating Moerus Worldwide Value and one of the most thoughtful people I’ve ever interviewed.

Silence in the Age of Noise (2018) by Erling Kagge.

The second one is:  The Joy of Missing Out: The Art of Restraint in an Age of Excess (2019) by Svend  Brinkmann.

Amit writes, “Neither is prescriptive, notwithstanding the obvious opinions of the respective authors.  The first I shared with my colleagues a year or two ago, silence being one of the prized intangibles of a workplace (as a starter).  The second one, a more recent book is about the joys of self-restraint on pragmatic, moral, psychological and even aesthetic grounds-a sort of celebration of stoicism.  But as I mentioned earlier, neither is a how-to manual which is precisely what makes (or should make), in my mind the lessons and attraction universal.

“There you go … a pair of slender volumes, rich in content if one is willing to pause and allow them to sink in.  And now, off I go into the busy, chaotic streets of Mumbai to my first meeting.”

Cheryl Welsch a.k.a. Chip, MFO co-founder, technical director, college dean

“Because, on many days, my sanity depends on the distance from my workplace and the 150 emails that, on average, wash over me. I was going to recommend Jeffrey Buller’s Positive Academic Leadership (2013), which is set in higher ed but says really sensible things to all of us who are trying to make a difference, but I was afraid our readers would think that’s too narrow. Besides, the cover is dull. So I chose Ande (“Andy”) Li’s The Healer’s Girl (2018) as a beautiful escape into a fantastical, sci-fi world full of strong characters, healing and magick, mystery and suspense.

David Sherman, founder of Cohanzick Asset Management and manager of RiverPark Short-Term High Yield, the most consistent and most consistently-reliable fund in my portfolio.

Happy Thanksgiving!

I am actually composing my 2019 Holiday Books over the weekend.  Some difficult choices this year and I definitely need to narrow the message and list.  In the spirit of your e-mail, the one book up first would be Ryan Holiday, Stillness Is the Key (2019). I’m writing this on my cell phone, so I decided to copy and paste a bit from Goodreads rather than trust my thumbs.

In Stillness Is the Key, Holiday draws on timeless Stoic and Buddhist philosophy to show why slowing down is the secret weapon for those charging ahead. All great leaders, thinkers, artists, athletes, and visionaries share one indelible quality. It enables them to conquer their tempers. To avoid distraction and discover great insights. To achieve happiness and do the right thing. Ryan Holiday calls it stillness–to be steady while the world spins around you.

David Welsch, a.k.a. Chip’s son and MFO’s part-time technical assistant

I thought about recommending Atlas Obscura: An Explorer’s Guide to the World’s Hidden Wonders or How to Swear Around the World, but then remembered that there’s nothing like a good horror novel to take my mind off just about everything except the strange noise coming from the basement. I’ve just pulled out my old copy of The Shining by Stephen King. I read it when I was about 15, but now I’d like to read it again before I read the sequel, Doctor Sleep. 

Snowball’s potpourri

This essay began with the argument that people are intentionally designing products to scramble your attention and impair your judgment. If you find that somewhere between puzzling and infuriating, the place to begin your education is with Tim Wu’s Attention Merchants: The Epic Scramble to Get Inside Our Heads (2017). Like Malcolm Gladwell, Mr. Wu writes on a broad array of topics, and writes well. Unless Mr. Gladwell, Mr. Wu has a serious academic perch as a professor of law at Columbia.

To folks who declare “the world is broken, we’re spinning out of control, chaos rules!” I nod and say, “well, yes. Yes, it is. And it always is. It just means it’s time to start pulling together, instead of pulling apart.” That (relative) calm is informed, in part, by my training as a historian and by my fascination with two cataclysmic periods in Western history: the Middle Ages (sometimes called “the Dark Ages”) and the maelstrom bounded by the start of the First World War and the end of the Great Depression. (When a reporter asked the great British economist John Maynard Keynes if there had ever been anything like the Great Depression, he said, “Yes. It was called the Dark Ages and it lasted 400 years.”)

My favorite broad-brush portraits of “the Dark Ages” are Barbara Tuchman’s A Distant Mirror: The Calamitous 14th Century (1987) and William Manchester’s A World Lit Only by Fire: The Medieval Mind and the Renaissance: Portrait of an Age (1993).

Neither of them is state-of-the-art, neither really appeals to academic historians who fuss about the fact that they gloss over bunches of interpretive debates and get some of the facts wrong. And yet they are compelling, engaging, enlightening and right about 95% of the time. That’s an average we should all aspire to. Manchester is more broad-brushed, Tuchman uses the life of a single noble family as a lens with which to examine broad questions. Both are a little bit depressing (Ummm … the “fire” of Manchester’s title was from the burning of martyrs) and both offer a profound sense of how far we’ve come and how much we’ve overcome.

I’m working steadily through Bradley Hart’s Hitler’s American Friends: The Third Reich’s Supporters in the United States (2018), a study of Depression-era demagoguery and our responses.

Some will love Hart’s writing because he’s willing to draw explicit parallels to the contemporary alt-Right movement and its enablers; others will detest it for the same reason. As a guy who teaches about demagogues to students who think the world began at right around the time they began noticing it, I’m really enjoying Hart’s sharp, focused portraits of groups like the German-American Bund, Silver Legion and the National Union for Social Justice.

I’m often befuddled by people’s tendency to dismiss really good stories as “children’s fiction.” Perhaps I am too child-like, but I’ve found rather some glee in engaging tales that a bright 10-year-old might share with me. Two I’ve read this fall are T. Kingfisher’s Minor Mage and Patricia Wrede’s Dealing with Dragons.

From there we switch to something as far from amiable children’s tales as we can. (Ummm … good Baptists should avert their gaze and move to safer grounds about now. Just sayin’.)

For folks who are suffering Fifty Shades of Grey withdrawal, (1) huh? and (2) there’s better. A friend, both of ours and of MFO, wrote a tale both darker and better than the plodding Grey corpus. 

The pseudonymous Jasmine shared the tale of the tale:

I can’t say for sure when I started writing Mindgames.  I have a definite recollection of staying after work in the late 1980s and writing on an electric typewriter there. (I stayed so late that my boss inquired whether I was living in the office.) But I think there may have been an even earlier beginning in a spiral notebook.

The story was a romance about a slavegirl named Mariah. She was brave and strong and obnoxious and would prefer death to continued servitude. She trusted no one and believed that friendship was a weakness. The hero was a healer named Gabriel. He arrived in Riviera on a mission of mercy for which he had traveled by horseback hundreds of miles across uninhabited land. Of course, he was horrified by the decadence of Riviera. And of course, he could see past Mariah’s hard facade into her true self.

As I was writing, I was busy living my life. There were years when I didn’t have time to work on Mindgames at all. When I did work on it, it was in stolen 30-minute increments.

In the meantime, the internet had come into being. After a few years of lurking on erotic story sites, I started to publish the early chapters of Mindgames. To my amazement people loved it. It was one of the most popular and highest-rated stories on the biggest BDSM story site. If the counter was correct, it had millions of views.

At its heart, it was still a smutty romance, but this was no 250-page Harlequin. Minor characters became major. I explored the entire society. After all, why shouldn’t I? The internet was a new world. I could do what I wanted on it. I started to think of the book as a Trojan horse. People came to read a dirty story but ended up with something a little deeper, a tale about speaking truth to power. The tag line became, “How one person can change the world, or be destroyed by it.”

I know she’s hosted a book club discussion over her novel. The mind boggles as to the whole “tea and bondage” discussion, with cute little cucumber sandwiches. Life is rich.

Bottom line

Stop making yourself crazy. Start making yourself thoughtful in ways that your friends would never have seen coming. It’s possible, and a great way to use the dark evenings of the coming season.

North Star Dividend Fund (NSDVX), December 2019

By David Snowball

Objective and strategy

For North Star Dividend, generating dividend income is the primary goal. Capital appreciation comes second. They pursue that goal by investing primarily in dividend-paying small- and micro-cap stocks. They typically target stocks under $1 billion in market cap, which is quite low even for a small-cap fund. Their preference is for stocks yielding over 3%.

The fund’s strategy has them seeking companies with market capitalizations of less than $1 billion that pay dividends, have a history of paying and increasing dividends, and have high free cash flow and attractive values, as measured by their EBITDA earnings.

Adviser

North Star Investment Management. Founded in 2003, North Star is headquartered in Chicago. They provide financial planning and investment management for individuals (both high net worth and not-quite-high net worth) and institutional clients, as well as advising the four North Star funds. The firm has about 25 employees who, collectively, own the company. 

Managers

Eric Kuby and Peter Gottlieb. Mr. Kuby joined North Star in 2004 and has been their Chief Investment Officer since 2005. Mr. Kuby holds an MBA in Finance as well as a BA in Economics from The University of Chicago.

Mr. Gottlieb founded North Star in 2003 and serves as their president.  He’s got a lot of experience in the financial industry. Mr. Gottlieb earned his BA degree from the University of Michigan, School of Business.

On whole, the team manages about $1.4 billion, with $305 million between the four North Star funds, all of which they manage together.

Strategy capacity and closure

Mr. Kuby reports that “We feel comfortable we can go up to $300 million without compromising the discipline. Probably a bit higher.” Most of the strategy’s assets reside in NSDVX, which is right around $80 million.

Active share

98.93. “Active share” measures the degree to which a fund’s portfolio differs from the holdings of its benchmark portfolio. High active share indicates management which is providing a portfolio that is substantially different from, and independent of, the index. An active share of zero indicates perfect overlap with the index, 100 indicates perfect independence. The “active share” research done by Martijn Cremers and Antti Petajisto finds that only 30% of U.S. fund assets are in funds that are reasonably independent of their benchmarks (80 or above) and only a tenth of assets go to highly active managers (90 or above).

NSDVX has an active share of 99, which reflects a very high degree of independence from its benchmark Morningstar Small Value Index.

Management’s stake in the fund

Messrs Gottlieb and Kuby have each invested between $100,000 – $500,000 in the fund. None of the fund’s five board members have chosen to invest in the fund or, for that matter, in any of the 47 portfolios for which they have responsibility.

Opening date

May 31, 2013. The Dividend Fund is the successor to the North Star Dividend Fund, L.P., a limited partnership that had been in operation since 2010. They transitioned to a mutual fund because that “was preferred by our investors primarily because of the daily liquidity and lack of K1.”

Minimum investment

$5,000 for “I” shares, with no minimum for the more expensive “R” shares. The fund is available through relatively few brokerages, though they can be accessed through Fidelity, JPMorgan, Pershing, TD Ameritrade, and Schwab.

Expense ratio

1.46% on assets of $83.6 million, as of July 2023. 

Comments

There is unambiguous evidence that, in the long term, value trumps growth, quality trumps not, small trumps large. For much of the last decade, none of that has been borne out in the markets. Growth has led value by the greatest margin in a century and the large caps have beaten small in five of the six years since NSDVX’s launch. At the extremes, Morningstar’s large growth category has been outperforming its small value ones by 1000 – 1600 bps over the past one, three and five year periods.

That imbalance is unlikely to persist. The dominance of growth over value, or value over growth, frequently lasts for a decade – as it has now – and then reverses, with the downtrodden style decisively outperforming for years. Likewise with small caps, though the length of dominant stretches is shorter and more variable.

We are, at the same time, likely nearer the end of the 12-year bull than its beginning. Market reversals and market volatility are likely ascendant. One question is how best to prepare for the market’s next phase. One answer is North Star Dividend.

North Star occupies an unusual niche. It’s one of four dividend-oriented small-cap funds. The fund’s primary objective is dividend income, and its investable universal is small- and micro-cap stocks that are both dividend-paying and dividend-growing.

By Morningstar’s scoring, they are a four-star small-cap value fund where they stand out because of their dividend focus; they have a yield of 300% of the group average. By Lipper’s reckoning, they are an equity-income fund where they stand out because of their small-cap focus; they have, by far, the lowest average market cap of any fund in the group.

Their distinctions are, we think, a source of strength.

There’s a large universe of dividend-paying small-cap stocks which few explore. There are 6500 stocks with market caps under $1 billion. Of those, 1150 have a positive dividend yield with 600 yielding 3% or more. About 200 have grown their dividends over the past five years.

North Star is actively seeking out the 40-50 best. They prefer “simple businesses to understand with solid-to-improving financials.” Two strategies are at play. First, they’re looking for companies that pay substantial and growing dividends. Their argument is that the income provided by dividends is much more predictable than a stock’s capital appreciation, so those stocks tend to be steadier and better-performing. Part of that superior performance comes from the strengths of the firms’ management teams: “we generally find that corporations that have a long history of paying dividends may be more attentive to managing capital structures appropriately in order to maintain dividend payments.”  Second, they’re looking for high-quality companies which they operationalize as firms with lower than average leverage ratios and higher than average return-of-equities. In short, evidence of less debt and better capital allocation decisions.

Finally, they impose a series of structural risk controls. Positions are capped at around 5% of the portfolio. They tend to build positions slowly, which they describe as a “nibble and bunt” approach. They attend to ESG concerns, which they explain this way:

It’s not a top priority, but is something we keep in mind. We don’t think businesses that are bad for society or poorly governed are good businesses to invest in.

Turnover is low, 11% over time, but they’ll sell if there’s a dramatic change at the firm.

The fund has, so far, achieved their goal. Morningstar awards them four stars. We used the fund screener at MFO Premium to compare them to the 104 funds in Lipper’s small-cap value category. In broad terms, since inception, North Star beats the small-cap value universe in every measure of risk, return, and risk-return tradeoff that we track. When ranked against individual funds, it combines top tier total returns with the best downside protection in its peer group. It almost magically marries exposure to some of the market’s smallest stocks with the creation of one of the group’s highest dividend yields.

  Absolute Relative
Return 6.8% 18th out of 104 SCV
Max Drawdown 18.6 13th
Worst 12 month return -12.6 9th
Sharpe ratio 0.55 3rd
Sortino ratio 0.84 3rd
Martin ratio 1.04 15th
Downside deviation 7.1 1st
Down month deviation 5.7 1st
Bear month deviation 5.0 1st
Yield 2.4 5th
Average market cap 544 9th smallest

All data for the trailing six years, through October 31, 2019, per Lipper Global Data Feed at MFO Premium.

There are small-cap value funds with higher returns, but those returns come at the price of substantial jumps in volatility and downside risk. For all of the small-cap value funds with six-year returns greater than North Star’s, we calculated the jump in volatility you might encounter.

  North Star Top tier %age diff
Return 6.8 8.0 18
Standard deviation 10.9 15.0 37
Downside deviation 7.1 9.8 38
Down month deviation 5.7 9.2 61
Bear month deviation 5.0 7.9 58

On average, you gain 18% higher returns at the price of 40% higher routine volatility and 60% higher volatility in months were the market has declined.

Bottom Line

This strikes us as an exceptional fund. Including its years as a hedge fund, it has a long history, and a sensible, conservative approach to an otherwise volatile, underfollowed set of stocks. It has offered exceptional returns with remarkably strong downside protection. For investors seeking income, or just managed volatility, from small-cap stocks, North Star Dividend is very much worth adding to your due-diligence list.

Fund website

North Star Dividend

© Mutual Fund Observer, 2019. All rights reserved. The information here reflects publicly available information current at the time of publication. For reprint/e-rights contact us.

Elevator Talk: Joseph Shaposhnik, TCW New America Premier Equities (TGUSX/TGUNX)

By David Snowball

Since the number of funds we can cover in-depth is smaller than the number of funds worthy of in-depth coverage, we’ve decided to offer one or two managers each month the opportunity to make a 200-word pitch to you. That’s about the number of words a slightly-manic elevator companion could share in a minute and a half. In each case, I’ve promised to offer a quick capsule of the fund and a link back to the fund’s site. Other than that, they’ve got 200 words and precisely as much of your time and attention as you’re willing to share. These aren’t endorsements; they’re opportunities to learn more.

Joe Shaposhnik manages TGUSX which launched January 29, 2016. The underlying strategy, launched on July 31, 2015, has a record that’s a bit longer. Mr. Shaposhnik joined TCW in 2011 after a stint as an equity analyst at Fidelity. He now heads three TCW strategies (including Global Space Technology) and leads their ESG investment effort.

New America Premier Equities breaks down this way:

New, which he hoped signaled a new approach to investing

America, which represents the fund’s focus on North America with the portfolio split about 80/20 between the US and Canada

Premier, which represents their investable universe of the highest quality corporations in healthy industries

Equities, which means he buys their stocks.

Mr. Shaposhnik’s investable universe contains only a couple hundred companies. His screening criteria are “enduring, cash-generating businesses whose leaderships prudently manage their environmental, social and financial resources and whose shares are attractively valued relative to the free cash flow generated by the businesses.” His search for enduring cash generation leads him to businesses that have recurrent revenue streams that are very predictable; a simple example would be the makers of toner cartridges for laser printers, once you buy the printer you’re also committing to buy four years’ worth of toner. He refers to these as firms with “evergreen business models.”

He argues that that’s an intrinsically valuable characteristic.

Customers that purchase recurring revenue, mission-critical products or services may not add to their existing … orders in a recession but they are unlikely to cancel their recurring purchases … [such businesses] experience shallower declines and perhaps less vigorous recoveries than the alternative, but we believe they also experience far fewer catastrophic outcomes as well.

Once he adds the “attractively valued” screen, he’s normally tracking 75-100 businesses for inclusion in a portfolio that typically holds around 30 names.

Such firms occur across the market spectrum. While he has about 75% of the portfolio invested in large-cap stocks, he also had 20% in small- and mid-cap names and 5% in cash. Both of those were far higher exposures than his peers managed, which is reflected in an average market cap ($50 billion) that’s about one-quarter of his Morningstar peer group’s ($180 billion). Lipper characterizes it as a multi-cap growth portfolio, which is probably fairer.

Regardless of which peer group you choose, New America Premier Equities has posted stunning return, risk, and risk-return numbers since launch. We combined Lipper’s multi-cap growth peer group (where they place the fund) and large-cap growth group (pretty much where Morningstar places it), then generated its key metrics since launch.

Performance of the fund, from inception through 10/31/2019, against the Lipper multi-cap and large-cap growth categories:

  Absolute value Relative value Lipper peer average
Annual returns 24.7% #3 out of 344 funds 16.2
Sharpe ratio 1.78 #5 1.06
Sortino ratio 3.19 #5  
Martin ratio 7.45 #7 3.56
Capture ratio 1.76 #5  
Ulcer index 3.1 #19 (t) 4.5
Maximum drawdown -13.1% #36 -16.4

Here’s how to read that:

Annual returns, a measure of pure upside: top 1% of comparable funds and 50% better than its average peer.

Maximum drawdown, a measure of pure downside: top 10% of comparable funds and 20% better than its average peer.

Sharpe, Sortino, Martin and Capture ratios, measures of a fund’s risk-return tradeoffs: top 2-3% of comparable funds and vastly better than its peers

I suspect that two factors help explain the magnitude of the fund’s outperformance. One is the use of ESG screens as signals of the strength of corporate cultures. Firms that act with exceptional responsibility in areas captured by ESG metrics are often firms with thoughtful and accomplished management teams, ones that are investing capital wisely and avoiding unnecessary risks to the corporation. The second is Mr. Shaposhnik’s view of himself as a risk manager, rather more than a returns manager. “Our approach,” he writes, “is squarely focused on avoiding catastrophic investments” and to minimize the risk of “a left tail outcome in any given year.” He broadens that focus in his most recent shareholder report:

Our primary objective, as stewards of your capital, is to control risk while seeking attractive returns. We control risk in a unique manner; initially we apply our proprietary ESG quantitative framework to identify better managed businesses that have lower quantified and unquantified risks. Subsequently we hone our efforts on those businesses that we believe operate in stable industries with attractive industry structures [and] that produce products that are critical to their customers …

Given that there are 350 funds trawling the larger cap US equity space, mostly unsuccessfully, we decided to ask Mr. Shaposhnik why he thought he had a compelling reason to launch yet another. Here are Joe’s 200 words on why you should add New America Premier Equities to your due-diligence list:

Our goal is to create a compounding machine—a machine that compounds capital at higher than market rates while incurring lower than market risk. We endeavor to accomplish this by using nontraditional performance information to help uncover better-managed businesses and invest only in a select group of predictable growth businesses that generate consistent free cash flow. We seek businesses that sell critical products or services to a wide spectrum of customers on a recurring basis. We also prefer companies that require low amounts of incremental capital to fund ongoing sales growth and therefore have significant excess cash flow to invest in value-enhancing internal projects or acquisitions. This flywheel of consistent recurring cash flow growth that is reinvested in value-creating projects or acquisitions can accelerate free cash flow per share growth which we believe is reflected in the per-share value of businesses over time. A portfolio that is populated with these types of businesses, purchased at reasonable free cash flow multiples, is less exposed, in our view, to gyrations of the global economy and less prone to experiencing negative surprises. In short, it is a compounding machine. 

 It is important to note what we do not do. We do not: own businesses that are undergoing rapid change (e.g. cutting edge technology), own businesses that lack recurring revenue, overly diversify, obsess over sector/benchmark considerations, swing the bat wildly in hopes of hitting home runs (singles and doubles are just fine; strikeouts are not), and invest with unproven or lackluster management teams.

TCW New America Premier Equities has a $2000 minimum initial investment for “N” and “I” shares, with the “I” shares carry a lower capped expense ratio (0.80%) than “N” (1.0%). The fund has about gathered about $180 million in assets since its January 2016 launch.  It’s available through a relatively small number of brokerages, though the list does include Fidelity, Schwab and TD Ameritrade.

 Here’s the fund’s homepage. It’s got a lot of links to other documents but is otherwise fairly Spartan.

Small-Cap Dividend Options

By David Snowball

We’ve written in November and December about two excellent options for investors interested in small-cap funds with a dividend focus. Those are Crawford Small Cap Dividend (CDOFX) and North Star Dividend (NSDVX). What might interest you about such funds?

    1. Over the long term, small caps outperform large caps
    2. Over the long term, dividends bolster returns and dampen volatility
    3. There are hundreds of small stocks which pay dividends, but they’re mostly underfollowed and rarely included in passive ETFs / index funds

Readers who would like to explore beyond our two profiled funds can use the screeners at MFO Premium to find the combination of smallness and yield they find more appealing. To help out folks who aren’t that curious, we’ve prepared a shortlist of funds, scattered between three Lipper groups, that are at least three years old, highlight “dividends” in their name or mission and mostly target small-cap stocks.

In each column, we’ve simple highlighted the funds with the best three-year metrics

Name Lipper APR Yield Sharpe Max DD Std Dev Downside Dev Down month dev Bear month dev
ProShares Russell 2000 Dividend Growers ETF SMDV Small Core 11.2 2 0.75 -8.6 12.8 8.1 7.1 6.8
North Star Dividend NSDVX Eq Inc 6.1 2.4 0.35 -18.6 12.8 8.9 7.1 6.9
Crawford Small Cap Dividend CDOFX Eq Inc 11.7 1.3 0.7 -16 14.5 9.8 9.2 9
Principal Small-MidCap Dividend Income PMDIX Eq Inc 8.9 2.7 0.5 -17.7 14.7 10.2 9.8 9.7
KEELEY Small Cap Dividend Value KSDVX Small Value 7.4 1.9 0.34 -21.8 17.3 11.4 10.4 9.8
WisdomTree US SmallCap Dividend DES Small Value 9.8 2.6 0.49 -18.3 16.6 11.2 10.5 10.1
Royce Dividend Value RYDVX Small Core 10.9 0.6 0.61 -20 15.3 10.7 10.3 10.1
Segall Bryant & Hamill Small Cap Value Dividend WTSVX Eq Inc 3.2 1.9 0.1 -21.5 17.4 12.1 10.7 10.2
WisdomTree US SmallCap Quality Dividend Growth DGRS Eq Inc 9.4 2.1 0.44 -17.9 17.8 11.8 10.8 10.3
Sit Small Cap Dividend Growth SSCDX Small Core 7.5 1.3 0.38 -19.3 15.6 11.3 10.8 10.6

Reading that table:

APR measures the fund’s annual percentage returns over the past three years.

Yield measures its income production.

Sharpe ratio is the most widely followed measure of a fund’s risk-return balance.

Maximum drawdown is pure downside, it records the fund’s single worst decline in the past three years

The remaining four metrics measure the funds’ volatility overall (standard dev), downside movements overall (downside dev), downside movements in months where the stock market is below zero (down month dev) and downside movement in months where the stock market is way in red (bear month dev).

The green highlights help make the appeal of Crawford Small Cap Dividend and North Star Dividend immediately apparent: they’re two of the top three funds in almost every measure of downside risk. What about the third, ProShares Russell 2000 Dividend Growers ETF? In general, we don’t profile passive products, either index funds or ETFs, though we’re perfectly happy writing about active ETFs. The strategy for SMDV is to replicate the Russell 2000 Dividend Growth Index. The index is:

The members of the

Russell 2000 Index [which] have increased dividend payments each year for at least 10 consecutive years and meet certain market capitalization and liquidity requirements. The Index contains a minimum of 40 stocks, which are equally weighted. No single sector is allowed to comprise more than 30% of the Index weight

In lieu of a profile, here are the links to the fund’s fact sheet and home page.


Launch Alert: Virtus KAR International Small-Mid Cap Fund

By David Snowball

On October 1, 2019, Virtus launched Virtus KAR International Small-Mid Cap Fund (VKIAX). The fund is managed by the KAR of the title: Kayne, Anderson Rudnick Investment Management, Virtus’s largest wholly-owned subsidiary. KAR, based in Los Angeles, manages rather more than $17 billion in assets. Across all of their portfolios, KAR emphasizes two core attributes:

And, on whole, manages them quite well. In 2018, four of KAR’s investment strategies were designated as “Top Gun Manager of the Decade” performers by PSN, a part of Informa Investment Solutions who you might know through their TrimTabs services. Their TGM award highlights strategies with the highest returns and lowest volatility. The strategies recognized all fall in the small-to-mid cap range: Small Cap Core, Small Cap Sustainable Growth, Small-Mid Cap Quality Value, and Mid Cap Core.

The team responsible for the new International Small-Mid Cap Fund has a fair to middlin’ record with the other two funds that they manage together:

While VISAX has drawn $1.7 billion in assets, the younger VAESX has just over $120 million under management. As of late November, the new strategy passed the $100,000 mark. I suspect it’s got room to grow.

The new fund seeks to generate attractive risk-adjusted long-term returns by investing in the stocks of international small- and mid-cap companies with durable competitive advantages, excellent management, lower financial risk, and strong growth trajectories. They are drawn, de facto, to low volatility businesses which tends to translate to lower volatility stocks. Small- to mid-caps range in size from $0 to $27.6 billion in market cap; funds such as this often invest in stocks formerly held in their pure small-cap funds, but which are growing too large to remain there. In consequence, the research burden for investigating them is mitigated. While they take care to assure geographic diversification, the portfolio will be pretty compact. Christopher Franz, the Morningstar analyst currently covering the older International Small Cap fund, argues that the strategy is sensible and sustainable:

Thrasher and crew seek cash-generative companies with low debt levels and strong competitive barriers, such as brand franchises or high customer-switching costs. They look for international small-cap companies with little sell-side analyst coverage, typically below $5 billion in market capitalization, and invest with conviction, paying little heed to sector or geographic weightings. The resulting 50-stock portfolio looks little like its MSCI ACWI ex USA Small Cap benchmark or foreign small/mid-blend Morningstar Category peer. (Feb. 2019)

The fund is co-managed by Craig Thrasher and Hyung Kim. Mr. Trasher joined KAR in 2008 and led the creation of the international small-cap strategies; he’s been manager since inception of the three international funds. Prior to that, he was an equity analyst at Kirr, Marbach & Company. Somewhere in there, he worked out time to spend six years as an anti-tank assaultman in the Marine Corps Reserve. (It’s a sign of the times that we’re forever “anti” something. Where are the pro-tank assaultmen, I ask you?) Mr. Kim joined in 2017 after time in banking and at Advisory Research. He spent his teen years in Germany and earned a BA in German from Hankuk University and an MBA from the University of Chicago. They’re supported by two equity analysts.

The minimum initial investment for “A” shares is $2,500 and the initial expense ratio is 1.45%. Nominally “A” shares carry a 5.75% load, though those are increasingly easy to dodge. The investment minimum for no-load “I” shares is $100,000. It should be available through about two dozen brokerages including Fidelity, Vanguard, Schwab, TD Ameritrade, and Pershing.


Funds in Reg

By David Snowball

The Securities and Exchange Commission, by law, gets between 60 and 75 days to review proposed new funds before they can be offered for sale to the public. Each month, Funds in Registration gives you a peek into the new product pipeline. Most funds currently in registration will not become available until January, which is a really bad problem for those trying to market the funds. Because these funds won’t be trading on the first day of the year, they’re not eligible for “year-to-date” returns reports and reporting services such as Morningstar won’t give them “credit” for their 2020 record. In consequence, very few funds want to be in the position of filings this late in the year.

We found 15 funds in the pipeline. Two standout. Daniel O’Keefe, of the Silver-rated Artisan Global Value fund, is slated to manage what appears to be a domestic version of the fund, Artisan Select Equity. Given that Artisan has never had a failed fund launch, that is, no Artisan fund has foundered in its first year and the great majority of their funds have been long-term winners, it’s a promising entry. It was also intriguing to see that launch of the first active, non-transparent ETF, Clearbridge Focus Value ETF. While the strategy discussion is a bit thin, the discussion of the risks engendered by this new form of pooled investment vehicle is clear and illuminating. Finally Fidelity has ramped up the hubris which a series of funds promising to focus on “the disruptors” in each of five arenas.

American Beacon TwentyFour Short Term Bond Fund

American Beacon TwentyFour Short Term Bond Fund will seek income and maybe a little capital appreciation. The plan is to maintain a bond portfolio, primarily investment-grade but up to one-third high yield, with a weighted maturity under three years. The fund will be managed by a team from TwentyFour Asset Management (US) LP. Its opening expense ratio is 0.87%, and the minimum initial investment will be $2,500.

Artisan Select Equity Fund

Artisan Select Equity Fund will seek long-term capital growth. The plan is to build focused portfolio of securities of undervalued U.S. companies across a broad capitalization range. It sounds rather like the domestic version of the manager’s Artisan Global Value fund. It even allows that some non-US stocks, bonds and derivatives might sneak in. There’s an interesting disclosure about trying to keep cash under 10%, but not promising. The fund will be managed by Daniel J. O’Keefe, which two co-managers. Its opening expense ratio has not been released, and the minimum initial investment will be $1,000.

Ashmore Emerging Markets Equity ESG Fund

Ashmore Emerging Markets Equity ESG Fund will seek long-term capital appreciation. The plan is to buy ESG-screened EM equities with a discipline that’s, say, 80% bottom-up and 20% top-down. The fund will be managed by Dhiren Shah. Its opening expense ratio has not been disclosed, and the minimum initial investment will be $1,000.

Clearbridge Focus Value ETF

Clearbridge Focus Value ETF, an actively-managed, non-transparent ETF, seeks long-term capital appreciation. The plan is to build a portfolio of 30-40 undervalued domestic stocks. The fund will be managed by Dmitry Khaykin and Robert Feitler Jr of Clearbridge Investments. Its opening expense ratio has not been disclosed. As one of the first generation of non-transparent ETFs, Clearbridge offered an interesting introduction: “This Exchange-Traded Fund is different from traditional ETFs. Traditional ETFs tell the public what assets they hold each day. This ETF will not. This may create additional risks for your investment. For example, you may have to pay more money to trade the ETF’s shares. This ETF will provide less information to traders, who tend to charge more for trades when they have less information.” Nicely done.

Domini Sustainable Solutions Fund

Domini Sustainable Solutions Fund will seek long-term total return. The plan is to invest in a global, all-cap portfolio of companies with “a commitment to sustainability solutions.” Not entirely sure of how their mission – long-term total return – will play out. In general, total return funds has a strong and defined income component, which might be a commitment to dividend-paying stocks, convertibles, bonds or whatever. None of that is explicit here. The fund will be managed by Michael Finocchi of State Street Global Advisors. Its opening expense ratio is 1.40%, and the minimum initial investment will be $2,500, reduced to $1,500 for various sorts of tax-advantaged accounts.

Fidelity Agricultural Productivity Fund

Fidelity Agricultural Productivity Fund will seek long-term growth. The plan is to invest in companies which help to increase crop yields and/or grow food production amid a backdrop of a growing global population and declining per capita supply of arable land. The fund will be managed by Steve Calhoun. Its opening expense ratio is has not been disclosed, and there is no minimum on the initial investment.

Fidelity Disruption Funds:  Automation, Communication, Finance, Medicine, Technology

Fidelity Disruption Funds will seek long-term growth. “Fidelity’s disruptive strategies seek to identify innovative developments that could signal new directions for delivering products and services to customers. Generally, these companies have or are developing new or unconventional ways of doing business that could disrupt and displace incumbents over time. This may include creating, providing, or contributing to new or expanded business models, value networks, pricing, and delivery of products and services.” Each fund will be managed by a large Fidelity team. Its opening expense ratio is has not been disclosed, and there is no minimum on the initial investment.

Fidelity Water Sustainability Fund

Fidelity Water Sustainability Fund will seek long-term growth. The plan is to invest in companies which develop efficiencies, extending the life cycle and/or identifying affordable new technologies to deliver safe, reliable or easily accessible water. The fund will be managed by Janet Glazer. Its opening expense ratio is has not been disclosed, and there is no minimum on the initial investment.

FS Energy Total Return Fund

FS Energy Total Return Fund will seek an attractive total return consisting of current income and capital appreciation. The plan is to invest in the equity and debt securities of firms in the natural resources and energy industry. This will represent the conversion of a closed-end interval fund that’s been in operation since March, 2017. The fund will be managed by a six person team from Magnetar Asset Management, an alternative investment manager with $13 billion in AUM. Its opening expense ratio has not been disclosed, and the minimum initial investment will be $2500.

One Rock Fund

One Rock Fund will seek capital appreciation. The plan is to trust the manager: non-diversified, momentum, tech-heavy, stocks, options, futures, shorting, with the prospect for investing in “short-term opportunistic situations.” There’s also a socially conservative portfolio screen. The fund will be managed by Jeffrey Wrona, he founded Wrona Investment Management LLC in 2019 and serves as the firm’s [INSERT TITLE].” Its opening expense ratio is 1.75%, and the minimum initial investment will be $2000.

Trajan Wealth Income Opportunities ETF

Trajan Wealth Income Opportunities ETF, an actively-managed ETF, seeks current income, conservation of principal and the opportunity for limited capital appreciation. The plan is to invest in domestic preferred securities, income producing fixed income securities, and income producing common stocks. The fund will be managed by Sterling Russell of Trajan Wealth LLC. Its opening expense ratio has not been disclosed.

Manager Changes, November 2019

By Chip

Because the manager change at Elfun Diversified (ELDFX) made Chip’s brain itch (“I’m sorry. ‘Elf Fun,’ what on earth is that about?”) I wanted to take a moment to explain the distinctive moniker. The Elfun funds were originally part of the General Electric retirement system. Their names are a contraction of “Electric Funds.” In a remembrance of his recently-deceased father, Walt Thiessen wrote:

Elfun (short for “electric fund”) was originally a private, upper echelon organization for GE’s top-level managers that enabled those invited to engage in some excellent investment opportunities. One of the main criteria for invitation was that the invitee must be directly involved in his or her local community in a voluntary way. 

In becoming Elfun’s secretary, Mr. Theissen worked to broaden the organization to include hundreds more employees. The original investment fund launched in 1935 and is now named Elfun Trust. The remainder of the Elfun funds launched in the 1980s in response to the broadening of Elfun’s reach; though administered by State Street, they remain available only to GE employees and their families. And now you know.

Beyond that, about 60 funds recorded partial or complete manager changes this month. Lots of “name on the door” changes are afoot. Gerstein Fisher funds now operate without Mr. Fisher, Marmont Redwood is losing Marmont, the Rampart has fallen from Virtus Rampart and Miller/Howard might soon be just /Howard. In other news, the Delaware Funds posted changes in seven of their vehicles.

Ticker Fund Out with the old In with the new Dt
AMMVX Aegon Emerging Markets Debt Fund James Rich will no longer serve as a portfolio manager for the fund. Jeffrey Grills joins Sarvjeev Sidhu, Phillip Torres, and Brian Westhoff on the management team. 11/19
MBESX AMG Chicago Equity Partners Balanced Fund Patricia Halper will no longer serve as a portfolio manager of the fund Keith Gustafson will Michael Budd, Curt Mitchell, and Michael Lawrence on the management team. 11/19
MDBAX BlackRock Basic Value Fund No one, but . . . David Zhao, Franco Tapia, and Tony DeSpirito join Carrie King and Joseph Wolfe on the management team. 11/19
LEGAX Columbia Large Cap Growth Fund John Wilson will no longer serve as a portfolio manager for the fund. Peter Santoro and Melda Mergen join Tchintcia Barros in managing the fund. 11/19
NSGAX Columbia Select Large Cap Equity Fund No one, but . . . Tiffany Wade joins Peter Santoro and Melda Mergen on the management team. 11/19
AMVAX Columbia Select Small Cap Value Fund David Hoffman will no longer serve as a portfolio manager for the fund. Kari Montanus and Jonas Patrikson remain to manage the fund. 11/19
FIUTX Delaware Equity Income Sean Reidy is no longer listed as a portfolio manager for the fund. Kristen Bartholdson, Nikhil Lalvani, and Robert Vogel will now manage the fund. 11/19
FIISX Delaware Global Equity Pedro Marcal is no longer listed as a portfolio manager for the fund. Åsa Annerstedt, Chris Gowlland, Jens Hansen, Claus Juul, and Klaus Petersen will now manage the fund. 11/19
FGINX Delaware Growth and Income Sean Reidy is no longer listed as a portfolio manager for the fund. Kristen Bartholdson, Nikhil Lalvani, and Robert Vogel will now manage the fund. 11/19
FIINX Delaware International Matthew Benkendorf, Daniel Kranson, and David Souccar are no longer listed as portfolio managers for the fund. Åsa Annerstedt, Chris Gowlland, Jens Hansen, Claus Juul, and Klaus Petersen will now manage the fund. 11/19
FIUSX Delaware Opportunity Thomas Alonso is no longer listed as a portfolio manager for the fund. Christopher Beck, Kelley McKee Carabasi, Steven Catricks, Michael Foley, and Kent Madden will now manage the fund. 11/19
FISSX Delaware Special Situations Thomas Alonso is no longer listed as a portfolio manager for the fund. Christopher Beck, Kelley McKee Carabasi, Steven Catricks, Michael Foley, and Kent Madden will now manage the fund. 11/19
FITRX Delaware Total Return Rajeev Sharma, Clinton Momeaux, Bryan Peterman, and Sean Reidy are no longer listed as portfolio managers for the fund. Damon Andres and Babak Zenouzi will now manage the fund. 11/19
ELDFX Elfun Diversified Geoffrey Preston is no longer listed as a portfolio manager for the fund. Leo Law, Michael Martel, and Seamus Quinn will now manage the fund. 11/19
CAPAX Federated Capital Income Fund John Nichol will no longer serve as a portfolio manager for the fund. Linda Bakhshian, Jerome Conner, Todd  Abraham, Mark Durbiano, and Ihab Salib will continue to manage the fund. 11/19
LEIFX Federated Equity Income Fund John Nichol will no longer serve as a portfolio manager for the fund. Linda Bakhshian will continue to manage the fund and will be joined by Stephen Gutch on January 1, 2020. 11/19
FMUAX Federated Muni and Stock Advantage Fund John Nichol will no longer serve as a portfolio manager for the fund. Linda Bakhshian, Jerome Conner, Todd  Abraham, Mark Durbiano, and Ihab Salib will continue to manage the fund. 11/19
FLVIX Fidelity Advisor Leveraged Company Harley Lank no longer serves as portfolio manager of the fund. Brian Chang and Mark Notkin will now manage the fund. 11/19
FBALX Fidelity Balanced Fund Richard Malnight will no longer serve as a portfolio manager for the fund. Jody Simes joins the other eight managers on the team. 11/19
FDAGX Fidelity Consumer Staples Portfolio James McElligott no longer serves as portfolio manager of the fund. Nicola Stafford now manages the fund. 11/19
FDFAX Fidelity Select Consumer Staples James McElligott no longer serves as portfolio manager of the fund. Nicola Stafford now manages the fund. 11/19
FSDPX Fidelity Select Materials Portfolio Richard Malnight will no longer serve as a portfolio manager for the fund, effective April 30, 2020. Jody Simes joins Richard Malnight in managing the fund and will continue upon his departure. 11/19
HROAX FinTrust Income and Opportunity Fund No one, but . . . John Mills joins Allen Gillespie and David Lewis in managing the fund. 11/19
GFMRX Gerstein Fisher Multi-Factor Global Real Estate Securities Fund Gregg Fisher has resigned and will no longer serve as a portfolio manager for the fund. William Jollie, Sanjeev Pati, and Ashvin Viswanathan will now manage the fund. 11/19
GFMGX Gerstein Fisher Multi-Factor Growth Equity Fund Gregg Fisher has resigned and will no longer serve as a portfolio manager for the fund. William Jollie, Sanjeev Pati, and Ashvin Viswanathan will now manage the fund. 11/19
GFIGX Gerstein Fisher Multi-Factor International Growth Equity Fund, Gregg Fisher has resigned and will no longer serve as a portfolio manager for the fund. William Jollie, Sanjeev Pati, and Ashvin Viswanathan will now manage the fund. 11/19
GEDZX GuideStone Funds Extended-Duration Bond Fund No one, but . . . Richard Fong and Justin Henne of Parametric Portfolio Associates are added as to the manager lineup. 11/19
GLDYX GuideStone Funds Low-Duration Bond Fund No one, but . . . Richard Fong and Justin Henne of Parametric Portfolio Associates are added as to the Low-Duration Bond Fund and Medium-Duration Bond Fund. They join a seven-person team from Payden & Rygel. 11/19
OSMAX Invesco Oppenheimer International Small-Mid Company No one, but . . . David Nadel joins Frank Jennings, though it’s not clear how long they’ll remain a couple. Mr. Jennings is committed to serve as Portfolio Manager “to ensure a smooth transition” which sounds rather interim to us. 11/19
OREAX Invesco Oppenheimer Real Estate David Wharmby will no longer serve as a portfolio manager for the fund. Darin Turner, Mark Blackburn, James Cowen, Paul Curbo, Grant Jackson, Joe Rodriguez, and Ping-Ying Wang will now manage the fund. 11/19
OQGIX Invesco Oppenhiemer Macquarie Global Infrastructure Bradford Frishberg and Anthony Felton will no longer serve as a portfolio managers for the fund. Darin Turner, Mark Blackburn, James Cowen, Paul Curbo, Grant Jackson, Joe Rodriguez, and Ping-Ying Wang will now manage the fund. 11/19
JHCDX John Hancock II Core Bond Fund No one, immediately, but … effective on December 31, 2020, Thomas O’Connor will be retiring as a portfolio manager of the fund. Following Mr. O’Connor’s retirement, Maulik Bhansali and Jarad Vasquez will continue as portfolio managers of the fund. 11/19
MRIDX Marmont Redwood International Equity Fund Redwood Investments, LLC and Marmont Parners, LLC will no longer advise the fund effective January 1, 2020. Hardman Johnston Global Advisers, LLC will manage the fund on January 1, 2020. 11/19
MMBWX MassMutual Select T. Rowe Price Retirement Balanced Fund Jerome Clark has announced his intention to step down, effective January 1, 2021. Kimberly DeDominicis will join Jerome Clark and Wyatt Lee on the management team. 11/19
MFBVX Mesirow Financial Enhanced Core Plus Fund Luke Lau will no longer serve as a portfolio manager for the fund. The other four managers remain with this fund, which just launched on October 1st. 11/19
MIDAX MFS International New Discovery No one immediately, but David Antonelli will be leaving effective April 15, 2021. Peter Fruzzetti, Jose Luis Garcia and Robert Lau will remain. 11/19
DBBDX Miller/Howard Drill Bit to Burner Tip Fund Lowell Miller has announced his intention to retire on or about November 15, 2020. He will resign from his current position as Chief Investment Officer of Miller/Howard, and will no longer serve as a portfolio manager to the fund. John Cusick, John Leslie, Michael Roomberg, Bryan Spratt, and Gregory Powell will continue to manage the fund. 11/19
MHIDX Miller/Howard Income‑Equity Fund Lowell Miller has announced his intention to retire on or about November 15, 2020. He will resign from his current position as Chief Investment Officer of Miller/Howard, and will no longer serve as a portfolio manager to the fund. John Cusick, John Leslie, Michael Roomberg, Bryan Spratt, and Gregory Powell will continue to manage the fund. 11/19
QISRX Pear Tree Polaris International Opportunities Martin Schulz and Calvin Yang will no longer serve as a portfolio manager for the fund. Sumanta Biswas, Jason Crawshaw, and Bin Xiau will now manage the fund. 11/19
PRMTX T. Rowe Price Communications & Technology Fund No one, immediately, but … Effective November 7, 2019, James Stillwagon will join Paul Greene as a co-portfolio manager of the fund. Effective April 1, 2020, Mr. Greene will step down from his role and Mr. Stillwagon will become sole portfolio manager of the fund. 11/19
TGLDX Tocqueville Gold Fund, soon to become the Sprott Gold Fund Ryan McIntyre will no longer serve as a portfolio manager for the fund. John Hathaway and Douglas Groh will continue to manage the fund. 11/19
TOPPX Tocqueville Opportunity Fund Thomas Vandeventer is no longer a portfolio manager of the fund. Paul Lambert will now manage the fund. 11/19
TTAI Trimtabs All Cap International Free-Cash-Flow ETF Theodore M. Theodore is no longer listed as a portfolio manager for the fund. Janet Johnston will continue to manage the fund. 11/19
TTAC Trimtabs All Cap U.S. Free-Cash-Flow ETF Theodore M. Theodore is no longer listed as a portfolio manager for the fund. Janet Johnston will continue to manage the fund. 11/19
ZNAVX USA Mutuals Navigator Fund Jordan Waldrep will no longer serve as a co-portfolio manager of the fund. Steven Goldman will continue to manage the fund. 11/19
VICEX USA Mutuals Vitrium, formerly the Vice Fund Jordan Waldrep will no longer serve as a portfolio manager of the fund. Jeffrey Helfrich and Charles Norton now manage the fund. 11/19
VBCVX VALIC Company I Systematic Value Mark Giambrone, Michael Nayfa, and Terry Pelzel are no longer listed as portfolio managers for the fund. Thomas Simon and Gregg Thomas are now managing the fund. 11/19
VEMBX Vanguard Emerging Markets Bond Fund No one, but . . . Mauro Favini joins Daniel Shaykevich in managing the fund. 11/19
VGCIX Vanguard Global Credit Bond Fund No one, but . . . Arvind Narayanan joins Samuel Martinez and Daniel Shaykevich in managing the fund. 11/19
PDPAX Virtus Rampart Alternatives Diversifier Fund, which may soon become Virtus Duff & Phelps Real Asset Fund. Rampart Investment Management will no longer subadvise the fund, effective January 14, 2020. Duff & Phelps will subadvise the fund. 11/19
IAPVX Voya Global Perspectives Effective October 31, 2019, Karyn Cavanaugh no longer serves as a portfolio manager for the fund. Douglas Coté will continue to manage the fund. 11/19
IPARX Voya Global Perspectives Portfolio Effective October 31, 2019, Karyn Cavanaugh no longer serves as a portfolio manager for the fund. Douglas Coté will continue to manage the fund. 11/19
MBFAX Wells Fargo Core Bond Fund No one, immediately, but … Thomas O’Connor has announced his intention to retire on December 31, 2020. Maulik Bhansali and Jarad Vasquez will continue to manage the fund, upon Mr. Rifkin’s retirement. 11/19
EKGAX Wells Fargo Global Small Cap Fund No one, immediately, but … Robert Rifkin has announced his intention to retire on April 15, 2020. James Tringas, Oleg Makhorine, and Bryant VanCronkhite will continue to manage the fund, upon Mr. Rifkin’s retirement. 11/19
IPBAX Wells Fargo Real Return Fund Effective immediately, Kayvan Malek is removed as a portfolio manager to the fund. Kandarp Acharya, Petros Bocray, Michael Bradshaw,  Christian Chan, Jay Mueller, Garth Newport, and Thomas Price will remain as portfolio managers. 11/19
WSGIX Wells Fargo Short Duration Government Bond Fund No one, immediately, but … Thomas O’Connor has announced his intention to retire on December 31, 2020. Maulik Bhansali and Jarad Vasquez will continue to manage the fund, upon Mr. Rifkin’s retirement. 11/19
ESPAX Wells Fargo Special Small Cap Value Fund No one, immediately, but … Robert Rifkin has announced his intention to retire on April 15, 2020. James Tringas and Bryant VanCronkhite will continue to manage the fund, upon Mr. Rifkin’s retirement. 11/19
EVUAX Wells Fargo Utility and Telecommunications Timothy O’Brien is no longer listed as a portfolio manager for the fund. Kent Newcomb and Jack Spudich will now manage the fund. 11/19


Briefly Noted

By David Snowball

This is a first for us. Aspiriant Defensive Allocation Fund (RMDFX) will be reorganized as a newly created closed-end fund called (ready?) Aspiriant Defensive Allocation Fund that will operate as an interval fund.  The change should occur by the end of the first quarter of 2020.

Closed-end funds? Hard to remember that they’re alive and well. That slice of the industry originated in the 1890s and they’re sort of an open-end mutual/active ETF hybrid. They trade throughout the day on secondary exchanges like ETFs, which means that their price per share can diverge dramatically from their net asset value per share. During the financial crisis, for example, a lot of CEF categories traded at double-digit discounts to their NAV. What does that mean? It means that the manager owned, say, $100 worth of stocks and you could buy those $100 for $85 because owners were panicked and willing to give money away. Weird. There are 554 closed-end funds in operation with about a quarter trillion in assets. Here’s a snapshot of the highest YTD returns, through 10/31/2019.

Never mind! The Cannabis Growth Fund (CANNX) had announced a long series of changes: conversion of Institutional shares to Investor ones, liquidation of the Institutional share class, termination of the 12(b)1 plan and a reduction in the e.r. for Investor shares. On November 13, they admitted that they had their fingers crossed when they said they were going to do all that stuff. The plan is now to do none of it.

Having lost 10% in the preceding 30 days and 40% in the preceding 90 days, I think we could all agree that neither switching share classes nor rearranging deck chairs gets to the heart of the fund’s problems.

Eventide Multi-Asset Income ETAMX assures us that “Boyd Watterson is primarily responsible for the day-to-day management of the Fund’s assets allocated to Boyd Watterson for investment.” Boyd Watterson is relieved.

On November 14, 2019, the FundX Investment Trust Board of Trustees approved a change in the strategy of the FundX Sustainable Impact Fund (SRIFX) to align with Morningstar’s ESG/sustainability methodology. (Talk about the tail-wagging dog.) 

Gator Financial Fund (GFFIX, formerly Gator Focus) just added a new Principal Risk of Investing, viz Large Shareholder Risk. Curious about what might have triggered the addition, I went to the fund’s most recent SAI which shows that just three guys, two sharing the same surname, own 67% of the fund’s shares. One of those three accounts for nearly half of the tiny fund’s shares.

Lazard US Realty Equity Fund has received a second stay of execution. The fund was slated to be dispatched on October 31, which was extended to November 30 and now until January 31. The announcement of the stay contains a perfectly unclear statement of the fund’s future: “The Board anticipates that an announcement that the liquidation will proceed, or that another option will be, or continues to actively be, pursued, will be made no later than January 31, 2020.” If I wrote the word sequence “will be, or continues to actively be, pursued, will be made,” several readers would gently inquire about my health or sanity.

Small Wins

Effective December 13, 2019, the minimum initial investment for Class I shares of Aegis Value (AVALX) is being lowered from $1 million to $10,000 for non-IRA accounts and $5,000 for IRA accounts. They’re simultaneously getting rid of the low-load, low minimum “A” shares. It’s a fascinating fund: Scott Barbee has been managing it since 1998, it’s almost purely microcaps (75%), it has about the highest active share possible (99.7) and periodically explodes:

In the past decade, three years of gains exceeding 35% a year (35, 70 and 91%) and three years with double-digit losses (-26, -24, -17).

Effective as of November 1, 2019, CrossingBridge Advisors reduced the operating expense limit on CrossingBridge Low Duration High Yield Fund (CBVLX) by 0.10% so to not exceed 0.80%.

Effective November 15, 2019, Moerus Worldwide Value Fund (MOWNX) will no longer charge a redemption fee.

Vanguard Alternative Strategies Fund (VASFX) has reduced its minimum investment from $250,000 to $50,000 but appears open only to clients of certain financial advisors. The Bogleheads are, alternately, disappointed by its limited availability and irked by a change in its investment objective.

Closings and other inconveniences

Gerstein Fisher Multi-Factor Growth Equity, Gerstein Fisher Multi-Factor International Growth Equity and Gerstein Fisher Multi-Factor Global Real Estate Securities funds closed to all new purchases as of November 3, 2019. “The Advisor is currently evaluating possible alternatives for the Funds” in the wake of the resignation of manager Gregg Fisher. For now, William Jollie, Sanjeev Pati, and Ashvin Viswanathan have been added as portfolio managers for each of the funds.

In an unusual and seemingly aggressive move, Westwood has opted to increase the minimum initial investment on institutional class shares of Westwood SMidCap Fund, SmallCap Fund, Strategic Convertibles Fund, and Flexible Income Fund (WFLEX) from the current $5,000 t0 $100,000. The difference is small, but the decision is odd.

Old Wine, New Bottles

On November 15, 2019, Aberdeen Global Unconstrained Fixed Income Fund became Aberdeen Global Absolute Return Strategies Fund; Aberdeen adds the helpful sidenote “(the “GARSTM Fund” or the “Fund”).”

Advisory Research continues its withdrawal. Sometime in the first quarter of 2020, Advisory Research All Cap Value Fund (ADVGX, three-star, $10M AUM) and the Advisory Research Strategic Income Fund (ADVNX, four-star, $10M AUM) become North Square Advisory Research All Cap Value Fund and the North Square Strategic Income Fund. As the names imply, AR will continue to subadvise All Cap Value but will surrender Strategic Income to a new team. This follows last month’s movement of two funds from the Advisory Research to Vaughan Nelson nameplates.

Marketing to the tax-aware conservatives: Effective January 1, 2020, the American Funds Tax-Advantaged Growth and Income Portfolio (TAIAX) will change its name to American Funds Tax-Aware Conservative Growth and Income Portfolio.

The Aptus Behavioral Momentum ETF (BEMO) was very bad at what it did, trailing 100% of its peers. For visual learners, there appears to have been an unmanaged drawdown that looked like

They’re the blue line. Fortunately, it’s not doing Behavioral Momentum anymore. With the change of name, objective, strategy, status (from passive to active) and enumerated risks, it’s now Aptus Drawdown Managed Equity ETF (ADME). May all their drawdowns be managed ones.

Cambria Core ETF (CCOR) is on its way to a new home, the Listed Funds Trust. David Pursell, one of the CCOR’s two managers, is leaving Cambria. (As you might imagine, no reason has been given.) to form Core Alternatives LLC. Under the proposed reorganization, sometime in early 2020 Cambria Core will become the Core Alternatives ETF and Mebane Faber will no longer serve as a co-manager for the fund. So far the $100 million fund has had one great year (2018, up 4.6%, top 3% of its options-based fund peer group) and one horrible one (2019, up 3.8%, bottom 8% of its peer group). At base, it dodged its peer group’s horrendous crash at the end of 2018 and subsequent ferocious rebound. Measured since inception, the fund has been good but not great.

Effective November 19, 2019, the Leader Floating Rate Fund (LFVFX) is renamed the Leader High Quality Low Duration Bond Fund, currently invests in high quality, low duration investments and will continue to do so.

Fund New Fund
Equinox Ampersand Strategy Fund AXS Alternative Growth Fund
Equinox Aspect Core Diversified Strategy Fund AXS Aspect Core Diversified Strategy Fund
Equinox Chesapeake Strategy Fund AXS Chesapeake Strategy Fund
Equinox IPM Systematic Macro Fund AXS IPM Systematic Macro Fund

Effective December 20, 2019, Highland Long/Short Healthcare Fund (HHCAX) becomes Highland Healthcare Opportunities Fund. At that point, it becomes a balanced equity/debt fund and gives up the business of shorting healthcare stocks.

Just a bit later, on January 31, 2020, Highland Long/Short Equity Fund (HEOZX) will merge into Highland Merger Arbitrage Fund (HMEZX). The explanation is refreshingly straightforward: the funds have the same managers but Merger Arbitrage is working better and the merger will allow them to drop expenses a bit. We ran an analysis of the funds’ rolling 12-month averages and a correlation matrix. Merger averages 6% over any given 12-month period while Long/Short clocks in at 3.6% and, measured by the worst 12-month performance, the downside on Long/Short (-9.5%) is far greater than the downside of Merger (-0.1%). The funds don’t have much similarity (R-squared of .26) but Merger is the better diversifier and is far steadier, so it looks to be a good development.

Effective January 1, 2020, Marmont Redwood International Equity Fund (MRIDX) will become the Hardman Johnston International Growth Fund. Upon Hardman Johnston assuming day-to-day investment management responsibilities for the International Growth Fund, it is expected that most of the Fund’s existing holdings will be sold and replaced by new securities identified by Hardman Johnston.

No problem, I’m planning on living Lifestyle 3.0: Effective December 2, 2019, Putnam Retirement Income Fund Lifestyle 1 (PRMMX) will be renamed Putnam RetirementReady Maturity Fund. As for me, I’m thinking of embracing Lifestyle 3, cheerful indolence, instead.

Effective December 28, 2019, the Tortoise Select Opportunity Fund (TOPTX) will be renamed the Tortoise Energy Evolution Fund. The “evolution” in the title means “investing in companies in the lower-carbon / zero-space business.” That’s about 180 degrees from its current portfolio which is filled with oil companies which implies a near-complete liquidation of the portfolio and potentially large capital gains bills.

The changing face of Vice: Somehow I missed the fact that the Vice Fund (VICEX) has become the Vitium Fund. From the latest SAI: “From inception to July 28, 2014, the Vitium Global Fund was named the USA Mutuals Vice Fund. On July 28, 2014, the … name changed … to USA Mutuals Barrier Fund. On September 29, 2016, the Fund was renamed the USA Mutuals Vice Fund. Effective September 30, 2019, the Fund was renamed the USA Mutuals Vitium Global Fund.” Vice (Chuck Jaffe once opined that the fund might have taken its name too literally), Barriers, Vice, Vitium. Endlessly curious, I consulted the Wiktionary about the meaning of “vitium.”

Sort of a kinder, gentler take on vice. The prospectus notes that they target “aerospace and defense industries, casinos and gaming facilities, manufacturers of cigarettes and brewers, distillers, vintners and producers of other alcoholic beverages.” The argument in their favor is that such industries have high barriers to entry, low economic sensitivity and customers whose loyalty verges on, well, addiction. The argument against it is that this portfolio, through its various renaming and leanings, trails 69-98% of its over various trailing periods from 3 – 15 years.

In a sort of cautionary tale, there’s a move afoot to boot Rampart Investment Management from the Virtus Rampart Alternatives Diversifier Fund (PDPAX). The hang-up is that the fund’s rules were written in a way that requires formal shareholder approval for such hirings and firings. The risk isn’t that shareholders will disapprove (which happens rarely), it’s that they won’t get around to vote (which happens a lot). So the shareholders are meetings on January 14 to bring Duff & Phelps onboard, change the fund’s name to Virtus Duff & Phelps Real Asset Fund and change the rules to let the Board handle hiring and firing.

Effective December 19, 2019, RARE Global Infrastructure Value Fund (RGVAX) will be renamed RARE Global Infrastructure Income Fund. The prospectus will change to add “income and” to the current mission. It’s a Legg Mason Partners fund. Small, mediocre, and no reported ownership by the three RARE fund managers.

Effective November 22, 2019, the Trillium P21 Global Equity Fund (PORTX) became Trillium ESG Global Equity Fund and boldly changed its objective from “capital growth” to “capital appreciation.” An article at TheNest.com helpfully explains the significance of the change: “Capital appreciation, also known as capital growth, refers to the increase in the value of an investment over time.” Which is to say, there is none. At the same time, the Trillium Small/Mid Cap Fund (TSMDX) changed Trillium ESG Small/Mid Cap Fund. In case you’re wondering, the objective here remains “long-term capital appreciation.” In case you’re wondering about the more consequential question, both of these funds have been ESG funds since launch. The name just highlights that fact.

Dustbin of history

Adalta International Fund (ADAQX) liquidated on November 29, 2019.

AGFiQ U.S. Market Neutral Size Fund (SIZ) will be liquidated on or about December 30, 2019

Based on the judgment that the funds “are not viable on an ongoing basis,” AQR announced the impending liquidation of AQR Large Cap Relaxed Constraint Equity Fund, AQR Small Cap Relaxed Constraint Equity Fund, AQR International Relaxed Constraint Equity Fund and AQR Emerging Relaxed Constraint Equity Fund.

BlackRock Large Cap Focus Growth Fund will merge into BlackRock Focus Growth at some point in the fourth quarter. Effective upon the closing of the reorganization, the acquiring fund will change its name from BlackRock Focus Growth Fund to BlackRock Large Cap Focus Growth Fund. Okay … Fund B eats Fund A, whereupon is renames itself Fund A? You can sort it out for yourself by checking the SEC filing.

BMO Global Long/Short Equity Fund (BGAQX) will be liquidated on December 23, 2019 “or such other date as determined by management.” (Isn’t that always the way?)

Cushing Energy & MLP ETF, Cushing Utility & MLP ETF, Cushing Transportation & MLP ETF and Cushing Energy Supply Chain & MLP ETF were given their two weeks’ notice on November 13 and liquidated on November 27, 2019.

In a spectacularly unclear filing, the shareholders of Comstock Capital Value Fund (COMVX), a perma-bear Gabelli fund, voted to be something. Something really big. Read it three times. Mailed it off to Ed Studzinski. Got no real idea except that it will “cease to be an investment company under the Investment Company Act of 1940.” They’re issuing stock and transferring assets to New Comstock, Inc. and liquidating old Comstock unInc.  While New Comstock “will no longer hold itself out as an investment company,” it will be a company that makes investments as soon as the SEC de-registers it as an investment company.

Defiance Next Gen Video Gaming ETF (VIDG) will be AFK for the last time on December 27, 2019.

Equinox IPM Systematic Macro Fund (EQIPX) was scheduled to be reorganized out of existence on November 15, 2019. Its Board now affirms that “certain conditions … were not met as of that date.” And so the fund will “continue its operations for the present time.” No idea what those conditions were, either.

Franklin Flexible Alpha Bond Fund’s reorganization into Franklin Low Duration Total Return Fund (FLDAX) has been delayed until December 6, 2019, but may occur earlier or later if circumstances should change. It was originally slated for October 25, 2019. No hint about what “circumstances” are at play.

The Board of Trustees of Harbor Funds has determined to liquidate and dissolve the $32 million Harbor Small Cap Value Opportunities Fund (HSOVX). The liquidation of the Fund is expected to occur on December 20, 2019.

Highland Energy MLP Fund (HEFAX) will be liquidated on or about January 20, 2020 

InsightShares LGBT Employment Equality ETF (PRID) and InsightShares Patriotic Employers ETF (HONR) ceased operations and liquidated on November 22, 2019.

Lord Abbett Global Select Equity Fund (LGSAX) will be liquidated and dissolved on or around January 15, 2020

The $10 million Morgan Dempsey Small/Micro Cap Value Fund (MITYX) has been closed and will be liquidated on December 12, 2019.

PIMCO 1-3 Year U.S. Treasury Index Exchange-Traded Fund (TUZ) will be liquidated on or about December 18, 2019.

PNC Multi-Factor Large Cap Growth Fund will merge with Federated MDT Large Cap Growth Fund (QALGX), quite likely right about now. The merger has been delayed once and might not occur until “the date of the next effective Prospectus” for the Federated Fund.

Powell Alternative Income Strategies Fund (PAISX) is expected to liquidate on or about December 13, 2019.

Low PSI? PSI All Asset Fund (FXMAX) will be liquidated on December 30, 2019.

Schroder Emerging Markets Small Cap Fund and Schroder Short Duration Bond Fund aren’t going to make it to New Year’s Day; their liquidation is slated for December 31, 2019.

Timothy Plan Emerging Markets Fund (TPEMX) has terminated the public offering of its shares and will discontinue operations on or about December 27, 2019. The decision came, in part, because of “the general lack of interest among Trust shareholders in the Fund.”

The Westwood Strategic Convertibles Fund (WSCIX) is expected to cease operations and liquidate on or about December 13, 2019.

November 1, 2019

By David Snowball

Dear friends,

It’s November 1, the traditional beginning of the holiday avoidance season. It’s the time of year when I program-out the local radio stations (not listening to you, Mix96) that switched to the 24/7 Christmas music today and the big box retailers who have declared that November 1 is Black Friday. (Looking at you, Kohls.) I will, with all my might, avoid their tinsel-festooned commercial caverns all of this month, and as much of next as I might.

That’s not because I dislike the year-end holidays. No, quite to the contrary: I’ve always embraced the communal spirit of celebration, the defiance of the cold winter nights and the opportunity to take a moment to remember to be grateful for one another. This dogged insistence on flogging holiday sales months in advance of the events does nothing but drain away any sense of the specialness, sacred or civil, that those few mid-winter nights once offered.

Thoughts after my AAII Conference sojourn

Thanks to the folks at AAII for inviting me to speak at their annual conference, this year in Orlando. Going from 40 and breezy in Iowa to 90, humid, with thunderstorms and scamper-y, mouse-sized lizards in Florida was a bit much for my system.

They are, Chip tells me, “anoles.” I mostly nodded and prayed they’d stay out from underfoot.

For those interested, the title of my talk was “The Indolent Investor: Managing Long-Term Decisions in a Sea of Short-Term Noise.” I tried to broaden my listeners’ understanding of the media universe that surrounds them, its effects on their own (investing and other) behavior and the strategies for managing it. The quick summary of the problem looked like this:

I suggested three sets of strategies: insulating ourselves from the noise, inoculating ourselves against the worst sorts of stories, and aligning our portfolios with long-term needs rather than short-term reactions. I’ll happily share the specifics with anyone interested.

The talk gave me the opportunity to share one of my favorite graphics, from a powerful and readily-accessible presentation by Rob Arnott. His point is that valuation matters in the long-run. A lot. Really, it matters more than anything. Here’s the graphic:

What you’re looking at is the relationship between what you pay for stocks (the CAPE p/e, along the bottom) and how much you make from stocks. Panel A shows the relationship after one year. More properly, the lack of relationship after one year. It’s clear that you sometimes buy a cheap market and, a year later, have lost a mint; those are the dots in the lower left of Panel A. Sometimes you buy into an egregiously overvalued market and, a year later, have made a mint; that’s the 40% gain dot in the upper right. In the short term, price doesn’t matter.

But in the long term? That’s Panel C, which shows your returns after 10 years. In that time frame, there’s a clear, evident and consistent pattern. The dashed yellow line represents the average return at each price point. If you pay 52 p/e (Amazon’s current rate, fyi) for a basket of stocks, after 10 years you’ll have made zero on average and below zero (for 10 years!) frequently. Our current Shiller CAPE p/e is 30, which is not a pretty portent.

Rupal Bhansali impressed me. We had a thoughtful, though brief, conversation about the evolution of her funds and her take on the market. Roughly, she’s attracted billions in institutional money but a tiny fraction of that from retail investors. And, given her insistence on investing only in sound businesses and discounted prices, she estimates that her investable universe has shrunk to about 5% of the market. That’s caused her to trim the number of positions in her portfolios, though she remains almost fully invested.

James O’Shaughnessy impressed me. His keynote address was funny and wide-ranging, and started from the premise “we are all descended from cowards.” His point is that, in an evolutionary sense, “the fight or flight reaction” worked best as “the flight reaction” because bold and fearless aboriginals generally got eaten before achieving parenthood. Instinctive risk aversion, he argued, cannot be educated away. His solution was reliance on quantitative models which knew no fear, and that’s the direction his firm has gone. My own reaction is that quant models are one possibility, but only one and quite often as flawed as the humans they supplant. (Quant funds, as it turns out, work pretty poorly in falling markets, as do the rest of us.)

Mebane Faber did not impress me, at least not positively. Manager of the Cambria ETFs, he came across as arrogant, disrespectful, full of unconditional declarations and easy generalization, and largely lacking in self-reflection. I left about halfway through, and was not the first to depart.

The FINRA representatives asked if I would mention to you the existence of their Fund Analyzer. They seem rather proud of it for its ability to do side-by-side comparisons of fund and ETF expenses. FINRA is the industry’s Congressionally-authorized self-regulatory scheme. Folks on the MFO discussion argue that FINRA, like most self-regulators, is forced into a series of compromises that belie the celebratory rhetoric.

Since I’m mentioning tools, the folks at As You Sow offer a simple tool for identifying funds with high scores on four hot button issues: carbon-free funds, gun-free funds, deforestation-free funds (who knew?) and gender equality funds. Since sorting through the increasingly mountain of ESG-come-lately funds is getting tougher and tougher, they seem to be offering a useful service.

Morningstar’s challenges

If you’ve had difficulty using Morningstar’s fund tools, or even accessing them, you’re not alone. One of the longest recent threads on MFO’s discussion board is entitled “Morningstar is falling apart.” The complaints raised there echo my own experience and I’ve spent a lot of time in recent weeks trying to work things through with Retail Support (aka “Joe”). For example, I tried to chart the total return of the Voya Corporate Leaders Trust (LEXCX) against the DJIA from the fund’s 1935 inception.  Nine or ten emails later, that turns out to be impossible. The evident option in their chart only tracks the Dow for nine years. With the intervention of the media relations folks and the Morningstar Direct folks, I got closer to an answer which is the indexes have sort of secret internal codes. If you know the codes, you can get close to the answer but it’s not necessarily possible to find the code.

A pending discussion asks how it’s possible for a fund to simultaneously be in the top 32% of its peer group for a particular year and trail the peer average. The response simply explained to me what 32% meant.

Our most dramatic discussion surrounds this image:

The Premium Fund search was willing to give me what I asked for, as long as what I asked for didn’t include the names of any funds. The folks in Morningstar media relations confirmed the difficulty and got back quickly with the message that the screener might be functioning again in the middle of next week. (sigh)

Even folks with access to Morningstar Direct, the high-end professional product, are complaining that they’ve lost access to data they could once easily retrieve.

I mention all of that for two reasons. First, if you’re having trouble and doubting your sanity, set your mind at rest. Second, if you’re having trouble, reach out to Morningstar. They’re running a tremendously complicated operation, and they’re doing it in the context of a parent corporation whose priorities are … uh, evolving. They are trying to do a good job for as many people as their knowledge and resources permit, while surely under pressure to support the corporation’s earnings. Letting them know, clearly and politely, what’s not working is our best option for encouraging changes that keep the system alive.

The $2500 solution

We all know we need “an emergency fund,” that ill-defined pot of money designed to help us surmount … well, an emergency. The problem is that no one seems ever to have figured out what “an emergency” looks like or how much it plausibly costs. That gave rise to rules of thumb that seemed designed to discourage anyone from even trying to establish such a fund, since they’d never reach the “six months’ worth of expenses” threshold.

Why six months? Because it’s the rule.

Turns out there’s a far more reassuring answer than that, one grounded in empirical analysis. Economists from the University of Colorado and Diego Portales University in Chile looked at 70,274 low-income households across the country and concluded that lower-income households would be quite fine with an emergency account of $2,467. They found that emergencies costing $500 dollars are surprisingly common, but those costing $5000 are surprisingly rare. As they chart out the frequency of emergencies by the dollar-size of them, you get a graph that goes flat at about $2500. That means that $6000 is not much more helpful, in practical terms, than $2500 is.

A decent non-technical walk-through of their research is here, while the original, downloadable research paper is here. NPR, being NPR, did a nice job of placing the research in its larger context.

My own emergency fund consists of a modest insured savings account (paying almost nothing) and a rather larger investment in RiverPark Short Term High Yield (RPHYX), an exceptional fund only open to those purchasing through the adviser. For folks like me who can tolerate some variation in share price, Zeo Short Duration Income (ZEOIX) and PIMCO Enhanced Short Maturity Active ETF (MINT) offer something like 3% returns with minimal downside.

Thanks, as ever …

Thanks to Kevin, Philip of Bloomfield Hills, and our cadre of loyal Paypal subscribers Greg, Doug, David, Sheshadri, Brian, William, Matthew, and the other William. Special thanks to our newest Paypal subscriber, James!

In answer to your questions: we do have a summary of how all of the funds we’ve profiled have done. It’s our monthly Dashboard, a free resource hosted at the MFO Premium site. And I’m still working on how to include brokerage availability in each of our fund profiles. Formerly that was something that Morningstar collated, but they’ve dropped that service from their website. I’m looking for a reliable alternative.

Finally, I’d urge everyone to read Charles’s piece this month, on changes at MFO Premium. The power of the tools on that site has grown exponentially over the past five years and the cost of the data feed that drives it has risen over 20%. As a result, we’ve increased the threshold for gaining access to the MFO Premium site from $100 to $120. We believe that the tools offer great potential and are, relative to any comparable service, a great value.

If you would like to contribute and gain access to MFO Premium, please use the MFO Premium link. Likewise, if you’d like to send a check and gain access to MFO Premium, please note that on the memo line and share your email address with us.

The Mutual Fund Observer itself is, and always will be, a free, non-commercial, reader-supported public service. Your contributions, large and small, make it all possible.  Folks who aren’t seeking MFO Premium access should continue to use our regular PayPal link, the one over there on the right.

Illness and a freak late October snowstorm threw plans a bit off-schedule this month, which means that our North Star Dividend and Yacktman Focus profiles will debut in our December issue, as will an update to our Akre Focus profile. Please join us for that, and much more, in the December – post-Thanksgiving, post Macy’s Parade, okay we can at least start talking about the holidays – Observer!

david's signature

Liquidity, Always Liquidity

By Edward A. Studzinski

“The only way a man can remain consistent amid changing circumstances is to change with them while preserving the same dominating purpose.” Winston S. Churchill, “Consistency in Politics,” Nash’s Pall Mall, July 1927, reprinted in Churchill’s Thoughts and Adventures (1932)

Where’s the Risk?

Horizon Kinetics, in its Q3 Commentary, again did a superb job of raising issues that investors should be thinking about, given a wide range of potential outcomes for Gross Domestic Product, as well as inflation and deflation. Now I am fully aware that both David Snowball and I have been banging the drum about the dangers of extreme overvaluation in the marketplace, and the possibilities of a major market decline. For those “Game of Thrones” fans I will say it differently, “Winter is coming.”

We are at a point where there are things taking place that we have not seen before, all happening concurrently. On the one hand, we have rapidly growing companies, the Amazons and Mastercards, trading at price to earnings ratios often in excess of 30. (Forward p/e’s of 54 and 31, respectively, as of 11/01/2019.) Or rather, they are trading at 30 years’ worth of earnings. They represent (and I am showing my age here), the new Nifty Fifty like the growth stocks of old, the Polaroids, Data Generals, and Digital Equipments.

At the same time, we have very mature companies that are often showing minimal or negative growth, that are trading in a range around 24X earnings. In this category you can find a 3M (19X earnings) or a Kellogg (29X earnings). For these companies to survive, you are dependent on a continued environment of low (or suppressed) interest rates.

Don’t like being in the stock market, especially if you are near retirement or in retirement? What’s your alternative? An eighteen-month certificate of deposit at 1.75% or a ten-year U.S. Treasury at roughly the same return, 1.7%? Try living on that, Dividend yield on the S&P 500 is closer to 2%. There has been a migration to stocks by people who really don’t want to be invested in them, but who have not a lot of alternative choices.

Finally, we have the issue of non-diversification. You think if you own a couple of ETF’s or index products that you have become broadly diversified? I recently had to point out to a young widow that she, although owning three or four of the most popular equity index mutual fund products out there, was in reality under-diversified and over-concentrated. Because if you look carefully, you will find in the portfolios that the same stocks, depending on the product category of the fund, are presented as a Value stock, a Growth stock, a High Yield stock, or some other category, all at once.

Why is this happening? It is now a question of money flows into funds and products, and trading liquidity. One of my former colleagues, after some of the early trading and liquidity debacles in 2001-2002, pre-ETF availability, started limiting the position sizes of equity positions in his fund to a number of days trading volume to enter or exit a position. Concomitant with that, he no longer was interested in mid-cap stocks, where he had achieved a successful performance record. Rather, he style-drifted upwards to large cap and mega-cap issues. This worked for a while. Now, because of the amounts of money that have gone into these newer ETF vehicles and indexation, his ability to earn a positive alpha in his fund due to his own skill set has been arbitraged away because everyone owns the same stuff. Differentiation is not easy (which explains more money spent on marketing than research).

A similar explanation seems to fit as to why hedge funds have also lost their ability to thrive and outperform, where individual manager stock-picking by hedge fund managers has lost both its cache and its edge. In that vein, I commend an article in the Wall Street Journal this week concerning Highfields Capital in Boston, as well as an explanation as to how the endowment at Harvard University shot itself in the foot. (“Twilight of the Stock Pickers: Hedge Fund Kings Face a Reckoning,” 10/27/2019)

Amundi’s chief investment officer has warned the asset management sector could be on the verge of a wider liquidity crisis, amid heightened scrutiny by investors in the wake of Neil Woodford’s downfall.

“This business is a trade-off between risk, return and liquidity. We have the ingredients of looming liquidity mismatches across the industry,” said Pascal Blanqué.

The CIO’s comments reflect growing concerns that some open-ended funds could suffer the same fate as Woodford by struggling to sell some of their holdings fast enough to pay back investors. MarketWatch, 10/23/2019

Which brings me to what should be the most concerning fact of all. And, it raises again the liquidity issue. In June of 2019, Morningstar issued a report that indicated that there were now more assets in indexed vehicles (passive management) than were placed with active managers. This of course is driven primarily by asset allocation strategies, often set by consultants. Should individuals or institutions one day wake up and decide to reallocate their assets to different strategies or allocations, especially to cash, the markets lack the ability to buy those equities and provide liquidity. The allocations are effectively hung assets. The active managers lack cash, which they would have to raise, in effect driving clearing prices in the markets lower. The resulting permanent capital losses would end up causing other serious effects.

What’s to be done? I again would argue that investors need to review their allocations and comfort zones with those allocations, especially as to their ability to replenish their assets in the event of a permanent capital loss. Things that were five or ten years ago are often no longer what they seem. Just ask anyone who owns coastal property which is now in an area reclassified as a flood plain due to rising sea levels.

First, don’t be afraid to hold more cash than you usually would. Secondly, if you are going to be invested in equities, try and make sure that they and your other assets are as uncorrelated to the general markets as possible. Look for things that are unloved. Avoid asset classes that are laden with debt, especially where the cash flows may not be sustainable to pay the debts in the event that rates rise. And try to protect yourself from asset managers who are talking their own book.

Many years ago, I would run to get the Barron’s Roundtable write-ups, to see what good new ideas were out there. Imagine my surprise when I learned some time after the fact, having discovered 13-F filings, that often the issues being recommended were being sold out of the recommending firm’s portfolios. There was a need to stimulate interest (and liquidity) in some of the issues.

Reformulation Redux

I have previously touched on reformulation as it pertains to consumer brands, and to a certain extent pertains as well to money management firms. There, as in many businesses tied to individuals, the intellectual capital assets go down the elevator at the end of the day. And they may or may not come back, depending on any number of other factors.

We have seen an impact at Artisan International Value Fund and Artisan Global Value where, in October 2018, one organization basically split into two, with different personnel and locations (San Francisco and greater Chicago). You of course don’t need to have a tag day for the lead portfolio managers of each fund, as each one received more than $100M in stock when Artisan Partners went public. But how have the fund investors fared since then?

Similar questions need to be raised at other firms where the culture and personnel begin to shift for a variety of reasons.  If the research and portfolio brand management equity of a firm has been built upon the synergies of having everyone sited in one place (like a Dodge and Cox), changes need to be commented upon when they become noticeable.  Such synergies may be as de minimis as the intellectual exchanges that take place daily in the lunchroom, especially when you have marketed them as such.  Alternatively, if your lead portfolio managers of funds begin telecommuting from distant locations or states, it should raise questions as to whether there is a pre-retirement transition going on at that firm.  And existing and future clients would want to be made aware of those transitions.  Obviously, modern technology such as “Go to Meeting” software makes on-line commuting much easier.  But where your brand equity has been built upon the synergies of having your intellectual capital in one place?  For example, Wellington Management has announced that the portfolio manager of Vanguard’s Wellington Balanced Fund will be retiring in 2020, and that the succession planning is under way.   What is happening is in effect a reformulation of the brand which should be and has been disclosed to the clients.  The clients have a right to not be surprised with something different than what they thought they signed up for.  Another example of fair disclosure would be that of Bob Rodriguez, the retired First Pacific Advisors managing partner and portfolio manager, who when I saw him in 2009 in Chicago, a few years before he retired,  told me quite clearly that if I wanted to come visit with him, it would be to his office in Las Vegas, California where he lived and had an office, not Los Angeles where the firm’s offices were located.  Clearly with Bob, this was not an example of retiring in place, in absentia.

P.S. I do commend to those of you with the time and interest, the entire transcript or replay of the Q3 Commentary. They go into a discussion at length of dealing with the different scenarios of inflation or deflation that we may face. And they approach things with a degree of honesty and integrity that I find refreshing in a world full of asset gatherers with no interest in the yachts of the investors.

Living a Rewarding Retirement

By Robert Cochran

Some Thoughts on Social Security, Medicare, and the Markets

I’ve been officially retired for just more than two years. During that time, I have been asked numerous times about when to take Social Security retirement benefits. My general response is that it pays to delay receipt of benefits to age 70. After that, there is no incentive to delay other than potential income taxes.

A recent study, “The Retirement Solution Hiding in Plain Sight” by United Income (June, 2019), indicates most people would say “yes” to making one simple retirement planning decision that could mean more income during retirement. But the same study shows that 96% of retirees take their first Social Security check at something other than the best time to do it. The potential lost income is estimated to average $111,000 per household. Now there are many good reasons for starting benefits at an earlier time. They include health issues that force starting Social Security benefits as early as age 62, or even careful planning that indicates total income is sufficient to fund retirement prior to age 70.

For someone whose full retirement age (66) benefit is $1,320, their age 62 benefit would be $1,000, and their age 70 benefit would be $1,640. That’s 64 percent per month more for someone who waits. There is a trade-off for those who do not work into their later 60s and delay benefits until age 70, as they will need to draw from their portfolios to meet their income needs. The other side of the coin is that people who work past their early and mid-60s will perhaps need less, if anything, from their portfolios.

Poverty among the elderly could be cut in half, without a single program change, by making one good decision.

Maybe the most interesting finding from the study was this: Elderly poverty could be cut by nearly 50 percent if all retirees claimed Social Security at the financially optimal time. And the drop in poverty would potentially fall even further if they earned additional income while they waited to claim Social Security.  In full disclosure, I retired and started receiving Social Security benefits at age 67. Mine was a lifestyle decision, a choice other retirees may not have. I was able to retire before age 70 and not rely only on Social Security.


A close family member was recently diagnosed with lung cancer. While we do not yet know the extent or stage of the disease, we are nevertheless grateful that personal legal and medical documents were completed and signed a year ago. Health issues can appear seemingly from nowhere. Not only is it vital to have personal documents in order, but also to have the best Medicare Supplemental Insurance and Medicare Prescription Insurance. We recently received our annual report from our health insurance advisor, telling us that our existing Supplement Insurance is still the best option for us, but that we will save some dollars on our monthly premiums and prescriptions by making changes to Part D. For us, it is worth the advisor’s annual fee to have a knowledgeable person handle this for us. It gives us peace of mind, knowing we will have very good care as it is needed.


I was recently at a gathering of friends from my high school graduating class. As several of us discussed, it is amazing how quickly ten years’ time passes. We don’t know when we might see each other again, or even IF we will see each other again. We agreed that keeping physically active and doing some kind of rewarding volunteer work are important in living a rewarding a retirement.


MFO readers know that I don’t spend much time looking at my portfolio values. Some months I don’t even open the Schwab statements. This may shock people that someone who devoted more than 30 years to providing financial advice could step away from all of it so easily. There are four key truths in this decision.

  1. The world is always teetering on the brink. There have been reasons for concern and even frightening moments for as long as I can remember, but almost all of them were false alarms or had no lasting consequence. Some more mature readers may remember Louis Rukeyser’s response to a question about what the market was going to do. He said “The market will fluctuate. It will fluc up and fluc down.” How very true.
  2. I can’t change that. I fully admit that I have absolutely no control over what happens to the stock and bond markets. Worrying about things which I cannot control is wasted time.
  3. The financial press thrives by manufacturing crises. It is a fact that much of the broadcast financial media deliberately creates or hypes scary headlines in order to sell advertising. Do you ever see or hear them hype good news? Their strategy works.
  4. A sound long-term plan is the key to sleep. The best thing I have done is to create an allocation mix that allows me to sleep at night. I recently captured some profits at the urging of my former colleagues, now my advisors. We have a lot more sitting in cash than we ever had in the past, which helps offset some of the truly aggressive holdings we still hold.

Consider the current market’s record high just yesterday (29 October). If ever there was a time for extreme market volatility, it is now. But in fact, the market has remained rather resilient this year. Broadcast and print media are providing almost non-stop negative political news. Yet the economy remains robust, employment numbers remain strong, interest and mortgage rates remain historically low, and inflation is still lower than the Federal Reserve’s target level.

My advice to other retirees is to stay healthy, stay busy, and make it a point to spend some time doing things that bring joy and fulfillment to those whose lives are a struggle. Let’s be grateful for what we do have.


Limiting Choices

By Charles Lynn Bolin

Oddly enough, the most time-consuming part of investing for me is limiting my choices. To simplify and streamline the process, I looked at fund families with top performing mutual funds that are available as no-load funds with low minimum investments through Charles Schwab, Fidelity or Vanguard.

Investment Model

Hedge fund billionaire Ray Dalio, in our call of the day, says the global economy is in a “great sag” and the world has parallels to the 1930s… Speaking at a panel at the IMF and World Bank meeting in Washington, the founder of the world’s largest hedge fund, Bridgewater Associates, said he didn’t see a market or economic crash on the horizon but a “great sag.”

Why the Bull Market Won’t End with a Typical Crash, Says Hedge Fund Billionaire Ray Dalio”(Marketwatch, 10/26/2019)

I built the Investment Model, shown in Chart #1, over the past 7 years to estimate an allocation to stocks and bonds that maximizes the return on $100 invested in January 1995 by adjusting to the business cycle. It takes into account dividends, total bond returns, monetary policy, financial risk, valuations, market trends and volatility, orders, production, sales, banking, corporate health, and money market flows, among many others. It now sits at the minimum allocation of 20% to stocks. Charles Boccadoro wrote a fascinating article in June 2017 called “How Bad Can It Get?”. He shows the maximum drawdown of various stock to bond allocations since 1932. Charles also shows the Martin Ratio (risk adjusted return) is highest for a 30/70 stock to bond portfolio.

The shaded area in Chart #1 provides guidance to whether I should be more aggressive or defensive, and for only the third time in 25 years, it is saying to be defensive, which does not imply being bearish. The indicator went negative in October 2000 and December 2008. During the next six months, the S&P 500 fell 14 and 9 percent respectively before entering a bear market. The next six months are important to watch for signs of a global recession. The negative factors impacting the Investment Model now are monetary policy (rising interests over the past two years and unwinding of the balance sheet), yield curve, global growth slowdown, increasing flows to money markets (risk aversion), construction, valuations, low potential GDP growth (labor, capacity, potential GDP), corporate (sales, income, profits), shipping, orders, manufacturing, and leading indicators, along with a few that just recently went negative. Twenty percent of the data is quarterly, so there may be revisions as more data becomes available in November.

CHART #1: INVESTMENT MODEL

Source: Created by the Author

I use the MFO Premium screener to evaluate and implement the Investment Model by developing a ranking system based on Momentum (3 and 10 month trends and moving averages), Quality (bond rating, low leverage, Fund Family Rating, Ferguson Metrics, composite ratings), Valuation (price to earnings ratio, price to cash flow, price to book), Risk (Ulcer Index, MFO Risk, capture metrics, debt to equity, performance during recessions), Risk Adjusted Returns (Martin Ratio, MFO Rank, Great Owl and Honor Roll Classification), and Income (Yield).

The timeframe for all of the following data is 18 months.

We consciously selected an 18 month window because that corresponds with a period of rising volatility and intermittent market falls. The Investment Committee at Tweedy, Browne Company shares our judgment about the market shift we’re trying to capture:

Since early 2018, there have been periodic bouts of market volatility, which has translated into weakening correlations and improved idea flow for value investors like us. Past experience would suggest that prevailing investor anxiety is, in part, related to above-average risk asset valuations coupled with increasing macroeconomic uncertainty … we suspect that market volatility is likely to remain with us, and that should bode well for bargain hunting. (Investment Committee, Tweedy, Browne Company LLC, Third Quarter Commentary, October 2019)

From the perspective of a risk-aware investor, this shorter time-frame is more diagnostic than performance during years of unrelenting rises.

Limiting the Fund Families

Table 1 contains the final funds by family selected to be ranked. The rejected funds are mutual funds not available through Charles Schwab or Fidelity or that have high minimum investment requirements. The closed end funds were rejected based on high premiums or expenses using CEF Analyzer. “Barron’s Fund Family Ranking” is worth reading for those interested in more information about their views. I chose AMG because I like the Yacktman Focused Fund (YAFFX), Janus for the Janus Henderson Balanced (JABAX) fund, and Cohen & Steers for real estate funds.

TABLE #1: SUMMARY OF OCTOBER FUNDS EVALUATED

Fund Family Mutual Fund ETF CEF Total # Funds with an MFO Rating >=4 Great Owls
Blackrock 42 110 29 181 113 20
Fidelity 114 13 0 127 83 16
Invesco 42 66 8 116 73 20
Vanguard 58 22 0 80 60 12
MFS 34 0 7 41 27 8
PIMCO 34 12 0 46 23 4
T Rowe Price 62 0 0 62 21 8
Janus 17 1 0 18 15 3
Charles Schwab 21 9 0 30 15 4
State Street 0 19 0 19 14 4
Virtus 19 0 1 20 13 2
Nuveen 11 4 17 32 12 0
Cohen & Steers 10 0 7 17 12 1
AMG 14 0 0 14 12 3
American Funds 34 0 0 34 11 6
Other 5 56 11 72 59 10
Rejected 50 0 32 82 51 31
Total 567 312 112 991 614 152

Source: Created by the author based on Mutual Fund Observer

Table #2 contains the four fund families with the most funds with a MFO Rating of 4 or higher per Lipper sub-type, along with the number of funds in those four families. The funds in Table #2 were only included if they were managed or enhanced, 5 years old or older, and non-institutional. Only AMG, MFS, and Invesco had top ranked alternative funds.

TABLE #2: FUND FAMILIES WITH THE MOST TOP RANKED FUNDS

U.S. Equity Mixed Asset Bond Internat’l Equity Global Equity Sector Equity Municipal Bond
Fidelity Fidelity Fidelity Fidelity MFS Fidelity Invesco
MFS MFS Vanguard T Rowe Price Virtus Cohen & Steers Vanguard
T Rowe Price T Rowe Price T Rowe Price MFS Janus Invesco Nuveen
AMG Blackrock Invesco Virtus Misc Virtus Fidelity
44 58 37 45 13 34 16

Source: Created by the author based on LGDF data and MFO Premium screening

Ranking System

I built the ranking system for someone who invests according to the business cycle, is less tolerant of risk, or is interested in low to moderate risk with high risk adjusted returns. The Bear column refers to the average performance during the 2000 and 2007 bear markets. Each month, I compare the top ranked Lipper Categories to what I own to see if there is some small change that I should make. I personally think that many utility and real estate funds are over-bought as investors seek safety. In addition, many low volatility and conservative funds own large percentages of these categories. The key take away from this data is that investors have been flocking to safety, driving up the prices and returns. I believe that interest rates will fall further due to easing of monetary policy globally.

TABLE 3: TOP RANKED OBJECTIVES

Objective Ulcer Martin Yield RTN 3Month RTN 1Year Bear
Ultra-Short Obligations 0.0 10.9 2.7 0.7 2.9 3.4
Short Invest Grade Debt 0.0 + 2.6 0.8 4.6 3.9
Short U.S. Government Bond 0.1 24.5 2.3 0.5 4.0 5.0
Short-Intmdt Invest Grade Debt 0.1 31.3 2.6 1.0 6.4 4.7
Short U.S. Treasury 0.1 17.2 2.2 0.6 3.9 7.2
Short-Intmdt Muni Debt 0.2 21.1 2.0 0.7 5.0 +
GNMA 0.3 9.0 2.7 1.2 7.2 8.6
Intermediate Muni Debt 0.3 14.4 2.3 1.4 8.2 5.7
International Income 0.4 48.6 2.8 3.0 11.6 +
Gen & Ins Muni Debt 0.4 16.3 2.8 1.8 9.1 2.5
Core Bond 0.4 11.9 2.9 2.1 10.1 4.5
Global Income 0.4 7.7 3.1 1.9 8.0 4.8
High Yield Municipal Debt 0.5 15.1 4.1 2.3 9.5 (6.6)
Corp Debt BBB-Rated 0.6 12.0 3.4 2.3 11.4 +
General U.S. Government 0.7 10.9 2.2 3.2 12.5 9.1
General Bond 0.9 9.9 5.0 3.3 13.4 (0.3)
Utility 1.1 16.9 2.7 7.8 22.7 (31.3)
General U.S. Treasury 1.1 10.7 2.2 4.9 17.5 12.3
Income 1.5 2.5 2.8 1.5 6.6 (9.8)
EM Hard Currency Debt 1.7 2.9 4.6 1.3 10.9 (0.0)
Global Infrastructure 2.0 5.9 2.1 2.5 16.8 (35.8)
Real Estate 2.5 7.8 3.4 7.3 18.9 (21.8)

Source: Created by the author based on LGDF data and MFO Premium screening

I have a preference for Fidelity and Vanguard mutual funds, but want to see how funds from other fund families are performing. Table #4 contains the top ranked fund for each top ranked Lipper Category.

TABLE #4: TOP RANKED FUNDS BY OBJECTIVE

Objective Vanguard Fidelity CEF ETF Other
 International Income VTABX FCDSX   IAGG TNIBX
 GNMA VFIIX FGMNX   GNMA  
 Utility   FSUTX UTF VPU MMUFX
 Ultra-Short Obligations VUSFX FCNVX   MINT TRBUX
 Short U.S. Government VSGBX     FTSD OPGVX
 General & Insured Municipal Debt VWAHX FTABX   FMB OPAMX
 General U.S. Government   FGOVX   AGZ AMUSX
 Short-Intmdt Investment Grade Debt   FTHRX   VCSH BRASX
 Intermediate Municipal Debt VWITX FLTMX   ITM SWNTX
 General U.S. Treasury VFITX FUAMX   SCHR PRULX
 Short Investment Grade Debt VFSTX FYBTX   SPSB PRWBX
 High Yield Municipal Debt     NMZ HYMB ORNAX
 Core Bond VFICX FTBFX   FBND DODIX
 Short U.S. Treasury VFISX FUMBX   SCHO  
 Global Income   FGBFX   HOLD PRSNX
 Corporate Debt BBB-Rated   FCBFX BHK VCIT BRACX
 Emerging Markets Hard Currency Debt       VWOB TRECX
 Income VWINX FFFAX   AOK DIFAX
 General Bond   FPCIX BBN BAB PTCIX
 Global Infrastructure       NFRA CSUIX
 Short-Intermediate Municipal Debt VMLTX FSTFX   SUB OPITX
 Real Estate VGSLX FRIFX RNP REZ CSEIX

Source: Created by the author based on LGDF data and MFO Premium screening

Table #5 contains one of the highest rated funds for top ranked Lipper Categories. Each month, I create a list of funds and compare them to what I own to see if there is some small change that I want to make. Depending upon one’s investment needs, the funds in Tables 4 and 5 are an excellent starting point for building a low risk, high risk adjusted return portfolio.

TABLE #5: TOP RANKED FUNDS

Recession Resistant Funds – 18 Months
Symbol Name CAGR MFO Risk Ulcer MFO Rating Martin GO? Yield
TRBUX T Rowe Price Ultra ST Bond 3.1 1.0 0.0 5 Yes 2.8
VCSH Vanguard ST Corp Bond ETF 5.1 1.0 0.0 5 62.5 Yes 2.8
VTABX Vanguard Total International Bond 8.6 1.0 0.1 5 85.1 Yes 2.8
VFIIX Vanguard GNMA 5.4 1.0 0.3 5 9.6 No 2.9
VGIT Vanguard Intermediate-Term Treasury ETF 7.2 2.0 0.3 5 14.9 No 2.2
DODIX Dodge & Cox Income 6.2 1.0 0.3 5 12.7 Yes 3.1
VWAHX Vanguard High Yield Tax-Exempt 8.1 1.0 0.4 4 14.1 No 3.4
PRSNX T Rowe Price Global MltiSect Bond 6.9 1.0 0.7 3 7.0 No 3.5
JMUIX Janus Henderson Multi-Sect Income 6.5 1.0 0.3 5 12.8 Yes 4.6
TRECX T Rowe Price EM Market Corp Bond 6.2 2.0 1.2 5 3.5 Yes 4.7
FRIFX Fidelity Real Estate Income 12.1 2.0 1.0 5 10.0 Yes 4.3
VWINX Vanguard Wellesley Income 8.2 2.0 1.0 5 6.3 Yes 2.9
JGDIX Janus Henderson Global Inc Mngd Vol 7.8 2.0 1.3 5 4.4 Yes 3.2
TAIAX American Funds Tx-Adv Grwth&Inc Port 5.5 2.0 1.5 5 2.3 Yes 2.5
SPLV Invesco S&P 500 Low Volatility ETF 16.5 3.0 1.8 5 7.8 Yes 2.0
JERIX Janus Henderson Global Real Estate 15.0 3.0 2.5 4 5.2 No 2.9
LVHD Legg Mason Low Vol High Dividend ETF 9.6 3.0 2.1 5 3.5 Yes 3.7
XMLV Invesco S&P MidCap Low Volatility ETF 14.0 4.0 2.5 5 4.8 Yes 1.9
VMNVX Vanguard Global Min Vol 10.8 3.0 2.5 5 3.5 Yes 2.1
VIG Vanguard Dividend Appreciation ETF 12.0 4.0 3.6 5 2.8 Yes 1.7

Source: Created by the author based on LGDF data and MFO Premium screening

Here’s how to read that table. T. Rowe Price Ultra Short Term Bond (TRBUX), the first fund listed, has returned an annually 3.1% over the past 18 months. It falls in MFO’s lowest risk group (1) and has an Ulcer Index of zero. The Ulcer Index factors together the depth and duration of a fund’s drawdowns; funds that go down a long way and stay there a long while are the source of … well, ulcers. The lower the Ulcer Index, the better. In this case, TRBUX had no monthly drawdown at all, so the Ulcer Index is zero. The MFO Rating assesses a fund’s risk-adjusted returns based on the Martin Index; the Martin Index itself measures a fund’s performance during drawdowns, based on the logic that volatility on the upswing is annoying but volatility on the downside is disastrous. So a high MFO rating and high Martin Ratio are both good; in TRBUX’s case, the Martin is actually incalculably high so the space is blank. The Great Owl status tells you that the fund consistently ranks in the top tier of its peer group by risk-adjusted performance. On whole, you’d describe it as a flawless performance with about 3% annual returns.

Closing

What I gained from this is exercise is a list of fund families that can be purchased at the investment companies that I use and a list of funds which are not considered due to load fees, availability, or having high minimum investment requirements. It reduces the research required looking at individual funds. I continue to automate the process so that each month it requires less time. The Multisearch and new Portfolio tools at MFO Premium are powerful and easy to use. For most investors, the available tools are all that is required.

Disclaimer

I am not an economist nor an investment professional. I became interested in economic forecasting and modeling in 2007 when a mortgage loan officer told me that there was a huge financial crisis coming. There were signs of financial stress if you knew where to look. I have read dozens of books on business cycles since then. Discovering the rich database at the St. Louis Federal Reserve (FRED) provides most of the data to create an Investment Model. The tools at Mutual Fund Observer provide the means for implementing and validating the Investment Model.

Resources

Excellent books on investment models and business cycles are Nowcasting the Business Cycle by James Picerno, Conquering the Divide by Cornehlsen and Carr, Investing with the Trend by Gregory L. Morris, Ahead of the Curve by Joseph H. Ellis, Probable Outcomes by Ed Easterling, The Era of Uncertainty by Francois Trahan and Katerine Krantz, The Research Driven Investor by Timothy Hayes, and Beating the Market 3 Months at a Time by Gerald Appel and Marvin Appel.

Premium Site Updates: Fund Fee Rating, Category Averages, and Subscription Price

By Charles Boccadoro

Martini: No, it’s not stupid, Signora Mayes. L’amore e cieco.

Frances: Oh, love is blind. Yeah, we have that saying too.

Martini: Everybody has that saying because it’s true everywhere.

From the 2003 film “Under The Tuscan Sun”

ER Rating

Morningstar has long championed funds with low expense ratios. In Ben Johnson’s piece earlier this year, entitled Fund-Fee Study: The Key Factors Helping Drive Fund Fees Lower, he states: “… fees are one of the best indicators of future relative performance, as lower-cost funds generally have greater odds of surviving and outperforming their more-expensive peers.”

Price remains one of the five pillars in its qualitative fund rating system, along with parent, people, performance and process. That said, Morningstar seemed to turn a blind eye to funds charging indefensible front loads, but the industry has since all but buried that issue.

Yesterday, MFO Premium introduced its Expense Ratio (ER) Rating metric in MultiSearch – the site’s main fund screening tool. Funds are grouped or rated versus category peers by quintiles. Funds with lowest ERs receive a 1 (best), while funds with highest ERs receive a 5 (worst). Users can specify an absolute value of ER, say less than 1%, or an ER Rating.

The plot below reinforces why fees matter, something that should seem entirely self-evident. You’ll see that funds with the highest ER tend to deliver the worst returns over their lifetimes, and the opposite appears true. In fact, it’s 2-3 times more likely for a fund with the worst ER Rating to deliver the worst performance. Similarly, a fund with the best ER Rating is 2-3 times more likely to deliver the best performance.

The same holds true even if you extract index or so-called passive funds, as evidenced in the plot below. One other bit of evidence: through September there are 164 funds that share MFO Great Owl and Honor Roll distinctions. Of the 164, only 9 have the worst ER Rating, while 38 have the best.

Take-away:  If a fund in your portfolio has an MFO ER Rating of 5 (worst), you’d better have a good reason for holding it.


Category Averages

Another addition to MultiSearch is Averages. While the separate Averages tool shows category averages for several metrics, like Return and MFO Risk, it is limited in scope and offers few evaluation periods, like 1, 3, 5, 10, and 20 year plus full cycles.

When users select an Asset Universe of Averages, MultiSearch will now present the averages of all metrics as applicable for the 175 categories for any of the 42 evaluation periods selected. It’s pretty cool. Shortly, these new averages will be incorporated as an option in the Portfolios tool when funds are too young for an evaluation period of interest. (See Introducing MFO’s Portfolio Analysis Tool.)

The averages are based on oldest share class, typically; exceptions are ER, Yield, 12b-1 fee, and load, which include all share classes. Also, for convenience, AUM is the sum or total in category not the average. The symbol for these averages is “AV-” followed by the Lipper Category Code.

By selecting “Include Averages,” users can also add the category averages to display along with the other selected criteria, as illustrated below for the oldest Large Cap Core funds in our database.

Exporting MultiSearch results for all the Averages easily enables users to assess AUM across categories, subtypes and types, as illustrated below. Generally, equities/U.S. equities, bonds, and money market are where folks keep their money. (Note: There are about 1750 Fund of Funds in our database, which collectively hold about $2.5T, mostly affecting the Mixed Asset sums.)


Subscription Price

Beginning this month, we will be upping the price (donation level) of an annual subscription to MFO Premium from $100 to $120 for individuals and from $500 to $600 for companies. Company subscriptions give access for up to 10 individual accounts.

This increase covers corresponding price increases in our Lipper (now Refinitiv) datafeed. It also covers a (hard to believe) service sales tax being imposed on Lipper by Iowa, where our non-profit resides, as well as higher costs of our new user portal.

We believe the price remains a bargain, especially given the extent to which the site has evolved since its inception four years ago, thanks to continued feedback and recommendations from our subscribers. We’ve received considerable praise this past year. Here are a few from folks who’ve agreed to share:

“I look forward to more good things from the Premium Site, the best bargain in investing.” James C. Pursley, President and Chief Investment Officer, Gaia Capital Management, Inc.

“Damn, man, a major thumbs-up, with tons of admiration … it is an amazing site.” David R. Moran, active MFO Discussion Board member.

“Overall, one of the most powerful and comprehensive fund screeners I’ve come across.” Samuel Lee, founder SVRN Asset Management, LLC.

“Your site is fantastic and we seem to rely on it more-and-more these days to search and monitor client fund investments.” Michael P. Egan, CFP, Diversified Management, Inc.

With your continued support, we promise more good things to come.

Elevator Talk: Jonathan Brodsky and Waldemar Mozes Harbor International Small Cap (HIISX)

By David Snowball

Since the number of funds we can cover in-depth is smaller than the number of funds worthy of in-depth coverage, we’ve decided to offer one or two managers each month the opportunity to make a 300 word pitch to you. That’s about the number of words a slightly-manic elevator companion could share in a minute and a half. In each case, I’ve promised to offer a quick capsule of the fund and a link back to the fund’s site. Other than that, they’ve got a few hundred words and precisely as much of your time and attention as you’re willing to share. These aren’t endorsements; they’re opportunities to learn more.

On May 23, 2019, Harbor Capital Advisors did a hard reset on Harbor International Small Cap (HIISX). Over its first three years, the fund’s returns trailed nearly three-quarters of its peers and only a tiny bit less volatility. Harbor chose to empanel a new subadvisor, Cedar Street Asset Management. Cedar Street was founded in April of 2016, as an employee-owned investment management firm and has approximately $250 million in assets under management as of June 30, 2019.

The new management team is Jonathan Brodsky, Founder and Principal, and Waldemar Mozes, Director of Investments for Cedar Street. Mr. Brodsky co-managed Advisory Research International Small Cap Value (ADVLX) from 2010-2016, Calvert International Opportunities (CIOAX) from 2011-2016 and Acuitas International Small Cap (AISCX) from 2014-2016. Prior to joining Cedar Street, Mr. Mozes worked with TAMRO Capital Partners LLC as a manager, starting in 2008, after stints with Artisan Partners and The Capital Group, adviser to the American Funds. At TAMRO he developed the international small cap strategy and managed the ASTON/TAMRO International Small Cap Fund (AROWX/ATRWX) from its launch in 2014 to its untimely liquidation in January, 2016.

In the topsy turvy world of asset management, M&A Advisory Research was bought in 2010 by Piper Jaffray then sold again in 2019 while Aston was bought in 2016 by AMG, with all of its funds absorbed or liquidated.

Cedar Street Asset Management was specifically founded to provide a value-focused investment service free of such conflicting ownership structures. With the Harbor International Small Cap fund, the managers are seeking long-term growth of capital. The plan is to invest in a fairly compact portfolio of small cap stocks, primarily but not exclusively domiciled in developed international markets, using Cedar Street’s disciplined, valued-oriented approach.

Thinking about international small cap investing

As the name requires, the team will invest in international small caps. Over the past five years, that’s not been a happy place. The average international small- to mid-cap value fund has returned under 1% a year and the average core fund made just 1.3%. International smid-cap growth returned 3.6%, which looks great in comparison to the other two group but substantially trails even low-risk assets like muni bonds.

There are, nonetheless, reasons to take the asset class seriously.

1. International small caps are a major asset class.

In rough terms, four-five thousand stocks, 46 countries with, depending on how you count, somewhere between 100-200% of the total market capitalization of the two thousand US small caps. Collectively, their market cap is over $5 trillion, which is about 6% of the global stock market.

2. You’re underexposed to them.

The average US investor holds about 15% of their portfolio in international stocks but the average “core” international fund only has 1.5% of its money in small cap stocks. In rough terms, the average US investor might then have 0.225% in international small caps, about a 25:1 underweight.

The bias toward international large caps is ironic since small caps have greater price inefficiencies linked to low (and falling) analyst coverage, substantially higher 10-year returns than their large cap peers, higher risk-adjusted returns, lower correlation to the US market and better valuations. And their advantage over international large caps has been persistent over time and across markets.

As of May 2019, GMO projects international small caps to have higher returns than any asset class outside of the emerging markets over the next five to seven years.

The Cedar Street plan

Supported by a team of three analysts, the two PMs will build a portfolio of 50-70 international small cap stocks. The current market cap range for their universe is about $100 million – $8 billion. While they have the authority to invest in emerging markets, they anticipate that direct EM exposure will be “minimal.” Position sizes will be “conviction weighted” but any individual position is capped at 5%. They anticipate turnover in the range of 25-35% which implies a typical holding period of three to four years.

In building the portfolio, they give exceptional attention to downside protection. The team’s investment process review places the “downside review” before the “upside analysis,” which strikes me as singularly sensible. They have a strong preference for value-priced stocks of firms with solid underlying businesses and clean balance sheets. They also spend a lot of effort in a governance analysis. They argue that “Because of varied laws around corporate governance and knowledge of the local players in the markets and their views on minority investors, Cedar Street feels that a detailed review of corporate governance practices is key to success in this space.”

There are, by Lipper’s count, 116 international small- to mid-cap funds, about a dozen of which are quite good. We asked Messrs. Brodsky and Mozes to reflect a bit on what made them think the world needed a 117th strategy and why thought they might make it into The Distinguished Dozen. Here are their 300 words on the matter:

What sets our firm apart is our unique culture focused exclusively on capturing the inefficiencies that consistently present themselves in non-U.S. small caps. It all starts with our team. Every investment team member brings a unique set of work experiences and diverse perspectives to the firm. Each team member has also earned an equity ownership stake based on significant contributions to the firm. We also make investment decisions collaboratively based on this long-term, ownership mentality. As a result, every investment idea hews to our value-based principles and every potential idea is vetted with a consistent, rigorous process prior to gaining entry into our portfolios. This cultural cohesion allows us to maintain our focus even when our value-oriented style may be out of favor.

The other key attribute that differentiates us is the breadth of valuation inefficiencies that we are able to capture as a team thanks to our diverse work experiences, language skills, cultural backgrounds, and educational training. Our value philosophy still means that we buy stocks trading at inexpensive absolute and relative valuation multiples. But instead of capital-intensive, highly-levered cement companies trading at a discount to book value, we are experts at capturing value from a more dynamic universe of secular growth opportunities such as the electrification of automobiles, increasing use of renewable materials for consumer products packaging, digital advertising, and the growth of protein-rich diets of emerging consumers. We do all of our own investment research, which means we often find companies that are overlooked by brokers or unloved by local investors. When combined with our rigorous balance sheet and corporate governance review, our investment process produces a portfolio of companies that have above-average, through-the-cycle returns on equity or invested capital, with below average leverage and volatility.

The administrative details

The minimum initial investment for the retail shares (HIISX) is $2,500 and the expense ratio, after waivers, is1.32% on assets of $54 million. The fund offers three other share classes.

Name / ticker Expense ratio Minimum investment
Administrative HRISX 1.20 $50,000
Institutional HAISX 0.95 $50,000
Retirement HNISX 0.87 $1,000,000

The fund is available through Schwab, TDAmeritrade, Vanguard and a few other platforms. Its website, Harbor International Small Cap, doesn’t yet offer commentary from the Cedar Street team. The Cedar Street Asset Management site isn’t noticeably richer, except for a bunch on video clips (2016-19) on the In the News page. Those mostly offer commentary on external events (“X is overpriced”) rather than discussions of strategy and approach.

The general case for international small cap investing was nicely summarized in a December 2018 white paper from AMG and in a July 2019 one from two of the guys at Harbor Capital. It’s worth reading for folks new to the field. Mike Lipper, president of the Royce Funds, has a comparable piece (May 2019) but it requires a slightly annoying registration in order to get access.

Your holiday shopping list starts here: 15/15 funds

By David Snowball

The S&P500 posted, and the DJIA approached, new all-time highs at the end of October while unemployment remained at half century lows. And yet the health of the economy is so fragile that the Federal Reserve felt compelled to cut interest rates for a third time. Skeptics believe that effectively zero-to-negative interest rates is more likely to encourage corporate financial engineering than it is to encourage productive investment. Rupal Bhansali, manager of Ariel Global and Ariel International and now a member of the Barron’s Roundtable, warned that “the market, which had been on steroids, is now on opioids. That’s not going to end well.”

Headline writers, and the self-serving pundits who they channel, do have that “you say ‘crystal meth’ like it’s a bad thing” air about them. A single day’s digest from Business Insider (1 November 2019) led with these four tidbits

Forget the rate cut: BlackRock’s $1.9 trillion bond chief told us of a more significant bombshell the Fed just dropped on markets

‘I would always rather be late’: A chief researcher at a $67 billion financial giant reveals his strategy for avoiding disaster in a market obsessed with growth

Jim Rogers earned a 4,200% return with George Soros by investing in overlooked assets. He tells us what he’s buying now ahead of the ‘worst crash of our lifetime.’

‘Bad from every angle’: America’s trucking recession is now slamming one of the $800 billion industry’s largest companies

Bombshell, disaster, worst crash, slamming recession … and yet on the same day, MarketWatch trumpets:

Dow and S&P guaranteed to rise another 5% in the next two months

US stock market has a good chance to record new highs

Finally, the last bullish stock market signals falls into place

Chart analyst says new record gives investors the green light to jump back into bull market

Bull, indeed.

Tweedy, Browne’s Investment Committee offered a calm, yet near-encyclopedic, list of what might soon go wrong:

… prevailing investor anxiety is, in part, related to above-average risk asset valuations coupled with increasing macroeconomic uncertainty, not the least of which is what appears to be a slowdown in economic growth, both in the U.S. and abroad. Other potential issues currently on the horizon that could pose a threat to market confidence include, but are not limited to: a hard Brexit; escalating trade tensions with China; a long overdue recession; a military confrontation with Iran; a miscalculation by North Korea; continued unrest in Hong Kong; rising debt levels; antitrust scrutiny of some of the FAANG companies; the upcoming U.S. presidential election; and perhaps more importantly, the possibility, however remote, of an uptick in inflation and interest rates. An unexpected outcome with respect to any of these macroeconomic issues could dampen investor enthusiasm, and in turn, negatively impact risk asset valuations, shifting the teeter-totter back in value’s favor. In the interim, we suspect that market volatility is likely to remain with us, and that should bode well for bargain hunting. William H. Browne, et al, Third Quarter Commentary, October 2019

MFO’s recommendation is always the same, and is never a market call: don’t abandon the equity markets, don’t take on more risk than you can manage and keep cash reserves on hand to deploy when values erupt.

Most of us have neither the knowledge nor the fortitude to invest in the face of a market crisis. As a result, we tend to favor funds whose managers have been building cash during the market’s frothy phase; we believe it demonstrates a contrarian good judgment and offers the resources that can be deployed by a professional who doesn’t panic when, well, the rest of us do.

Our approach is to catalog for you funds that have two admirable characteristics: they have been generating solid to excellent absolute returns in the short-run but have substantial cash on hand in order to buffer, then profit from, a market crisis.

The funds below have a substantial equity component, at least 15% in cash and double-digit returns over the past year. We chose the shorter-than-usual 12-month window because it corresponds with the period of heightened market instability, which is relevant to imagining funds that can thrive in good times and bad.

I almost called these “the 10-15 funds” until I discovered that in police radio code, 10-15 signals “prisoner in custody.” I just wasn’t sure that I wanted to go there.

The final two columns are summative judgments from MFO and Morningstar. MFO’s highest designation is “Great Owl” (GO), earned by funds that finish in the 10% of their peer group on risk-adjusted returns for every period longer than 12 months. The Honor Roll (HR) designation is for fund that outperform their peers, not adjusted for risk.

The Morningstar stars are awarded in light of a fund’s past risk-adjusted returns. The medalist awards – gold, silver, bronze, neutral, negative – are a judgment, rendered either by human analysts or a Morningstar machine-learning model that tries to mimic the analysts, are a fund’s future prospects. A Gold-rate fund is one in which Morningstar has the greatest level of confidence that the fund is positioned to outperform in the future.

    Cash 1 year return 3 year return AUM Expense ratio Minimum MFO M*
Akre Focus AKREX Large Growth 19% 27% 23% 11,920 1.32 2,000 GO + HR 5 – Silver
AMG Yacktman Focused YAFFX Large core 26 13 13 3,700 1.27 2,000 GO + HR 4 – silver
Marshfield Concentrated Opportunities MRFOX Large Growth 27 27 22 112 1.10 10,000 GO 5 – neutral
Nuance Concentrated Value NCVLX Large Value 16 18 10 443 1.07 10,000 GO 4 – Neutral
Needham Small Cap Growth NESGX Small Growth 16 25 17 45 1.95 2,000 HR 3 – neutral
Sextant International SSIFX Intl Large Growth 26 19 13 109 1.04 1,000 HR 4 – neutral
Federated Kaufmann KAUFX Mid-Cap Growth 23 14 17 6,401 1.95 1,500 HR 4 – Neutral
Federated Kaufmann Small Cap FKASX Small Growth 16 14 22 3,582 1.35 1,500   5 -Neutral
Artisan International Value ARTKX Foreign Large Core 15 10 9 14,268 1.18 1,000 – closed   4 – silver
FPA International Value FPIVX Foreign Small/Mid Core 34 13 10 247 1.29 1,500   4 – Bronze
T. Rowe Price Int’l Concentrated Equity PRCNX Int’l Large Core 10 14 8 150 0.9 2,500   4 – bronze
BBH Partner Fund – International Equity BBHLX Foreign Large Growth 20 16 9 1,755 0.65 10,000   3 -neutral
Provident Trust Strategy  PROVX Large Growth 16 11 17 185 1.00 1,000   3 – Neutral
Fairholme FAIRX Large Value 28 25 4 1,090 0.82 10,000   1 – negative
Artisan Thematic ARTTX Large Growth 13 17 691 1.51 1,000   n/a
Clarkston Founders CIMDX Mid-Cap Core 28 12 43 0.91 10,000   n/a

Notes on the data: all performance and fee data are current as of mid-October, 2019. The funds’ cash holdings are Morningstar data which we cross-checked with the fund’s website; in the case of a disagreeable, we went with the funds’ self-report.

Every fund name is linked either to its MFO profile or to its homepage.

A quick gloss on some of the funds:

It is exceedingly rare for large funds to hold substantial cash reserves. Their business model does not allow such caution.

Artisan Thematic and Clarkston Founders have not yet reached their three-year mark. While Artisan Thematic strikes me as quirky but the manager does have a substantial record prior to Artisan and Artisan does have a remarkable record for hiring only “category busters” to manage their strategies. The open-minded might want to investigate.

Akre Focus and Sextant International have lead managers who are (1) brilliant, (2) principled and (3) in the … uhh, later stages of their investing careers. Folks might want to get comfortable with the state of the funds’ succession planning before proceeding.

Fairholme is probably not an attractive option for most investors. It is ultra-concentrated and ultra-volatile. When the lead sentence by the Morningstar analyst covering the fund begins “Fairholme doesn’t face a liquidity crisis anymore but …” you know things are iffy.

Yacktman Focused is ridiculously, inexplicable, consistently excellent.

Bottom line

It is delusional to believe that the market will rise forever or that you will have the knowledge and fortitude to commit your cash reserves at the moment of the market’s greatest despair. That is, neither having no cash is bad and having cash that you’re incapable of deploying is bad. Our recommendation, always, is to consider managers who have the cash and have a record of managing both rising markets and tumbling ones. These funds warrant some attention for that role.

Related articles: The 15 / 15 Funds (04/2018), 15/15 funds, one year on (03/2019) and Overachieving defenders: Your late-cycle shopping list (08/2019)