“Experts often possess more data than judgment.”
Colin Powell
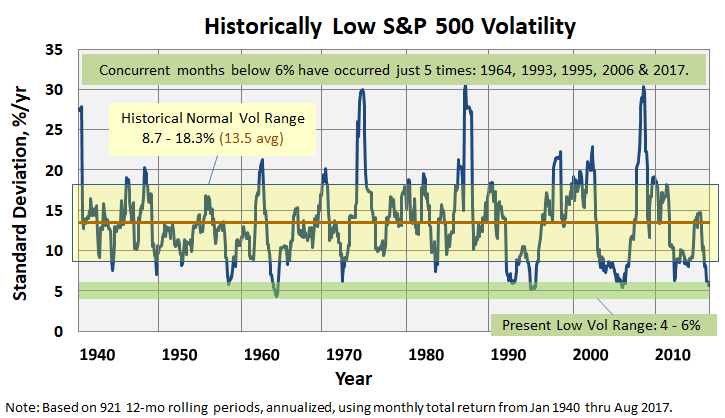
The S&P 500 closed August yesterday with an annualized standard deviation below 6%. Typically, since about 1940, which marked the end of The Great Depression, annualized standard deviation runs between 13 and 14%. It was the second consecutive month to break the 6% threshold; in fact, only five times has volatility remained this low for consecutive months: 1964, 1993, 1995, 2006 and 2017.
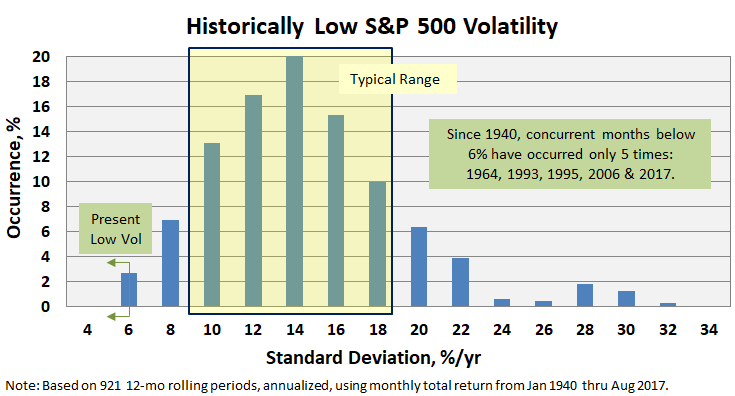
Another depiction highlighting just how infrequent these low volatility periods have been is presented in the following histogram, which shows percent occurrence (or frequency) of this volatility measure. The occurrence of S&P 500 annualized standard deviation below 6% is 2.7%, or just 25 times out of the 921 rolling 12 month periods analyzed. That is substantially less than high volatility occurrences of say above 24%, which investors experienced circa 1974, 1987, and 2008.
Such low volatility can skew fund performance ratings based on risk adjusted returns, like Sharpe ratio, which is defined as excess return divided by standard deviation. When the denominator approaches zero, Sharpe values explode (the mathematical term is “behaves hyperbolically”) and small differences can drive big changes in ratings. Morningstar avoids this situation with their “expected utility theory” ratings methodology, as we described previously in Morningstar’s Risk Adjusted Return Measure. The downside in its approach is the methodology generally penalizes funds with high volatility more so than it rewards funds with low volatility.
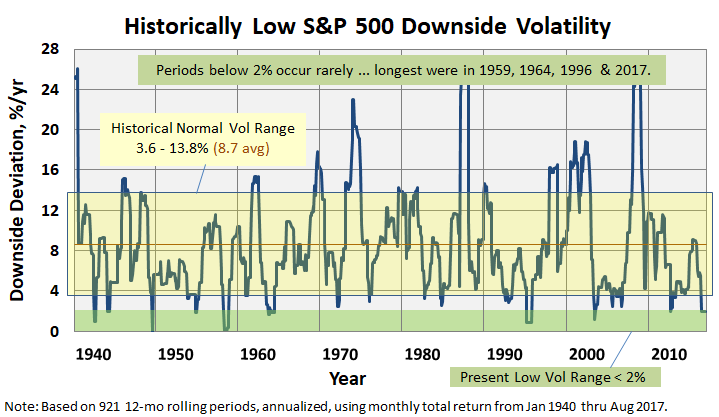
The current low volatility environment has had an even greater impact on downside volatility measures, like downside deviation, maximum drawdown, and ulcer index. (For definitions, please reference: A Look at Risk Adjusted Returns.)
Month ending August 2017, the S&P 500’s downside deviation dropped below 2% for the second consecutive month. The last time we experienced multiple months below 2% were in 1959, 1964 and 1996.
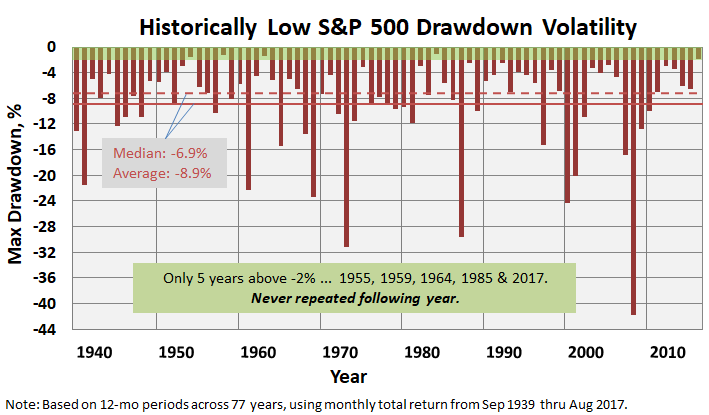
Investors became extremely sensitive to measures like maximum drawdown after experiencing massive retractions in 2002 and 2009, which resulted in many monthly retirement statements showing 50% or less life savings than just a couple years earlier. Maximum drawdown levels today? Once again, they are historically low based on 12-month evaluation periods, month ending August, across 77 years, from September 1939 through August 2017.
The current 12-month value is just -1.8%. Only five times does this metric get above -2% (zero being highest possible … no drawdown): 1955, 1959, 1964, 1985 and 2017. It’s never repeated the following year.


