By David Snowball
Dear friends,
It’s not a question of whether it’s coming. It’s just a question of whether you’ve been preparing intelligently.

A wave struck a lighthouse in Douro River in Porto, Portugal, Monday. The wave damaged some nearby cars and caused minor injuries. Pictures of the Day, Wall Street Journal online, January 6, 2014. Estela Silva/European Pressphoto Agency
There’s an old joke about the farmer with the leaky roof that never gets fixed. When the sun’s out, he never thinks about the leak and when it’s raining, he can’t get up there to fix it anyway. And so the leak continues.
Our investments likewise: people who are kicking themselves for not having 100% equity exposure in March 2009 and 200% exposure in January 2013 have been pulling money steadily from boring investments and adding them to stocks. The domestic stock market has seen its 13th consecutive month of inflows and the S&P 500 closed February at its highest nominal level ever.
I mention this now because the sun has been shining so brightly. March 9, 2014 marches the five-year anniversary of the current bull market. In those five years, a $10,000 investment in the S&P500 would have grown to $30,400. The same amount invested in the NASDAQ on March 9 would have grown to $35,900. The last remnants of the ferocious bear markets of 2000-02 and 2007-09 have faded from the ratings. And investors really want a do-over. All the folks hiding under their beds in 2009 and still peering out from under the blankies in 2011 feel cheated and they want in on the action, and they want it now.
Hence inflows into an overpriced market.
Our general suggestion is to learn from the past, but not to live there. Nothing we do today can capture the returns of the past five years for us. Sadly, we still can damage the next five. To help build a strong prospects for our future, we’re spending a bit of time this month talking about hedging strategies – ways to get into a pricey market without quite so much heartache – and cool funds that might be better positioned for the next five than you’d otherwise find.
And, too, we get to celebrate the onset of spring!
The search for active share
It’s much easier to lose in investing than to win. Sometimes we lose because we’re offered poor choices and sometimes we lose because we make poor ones. Frankly, it doesn’t take many poor choices to trash the best laid plans.
Winning requires doing a lot of things right. One of those things is deciding whether – or to what extent – your portfolio should rely on actively and passively managed funds. A lot of actively managed funds are dismal but so too are a lot of passive products: poorly constructed indexes, trendy themes, disciplines driven by marketing, and high fees plague the index and EFT crowd.
If you are going to opt for active management, you need to be sure that it’s active in more than name alone. As we’ve shown before, many active managers – especially those trying to deploy billions in capital – offer no advantage over a broad market index, and a lot of disadvantages.
One tool for measuring the degree to which your manager is active is called, appropriately enough, “active share.” Active share measures the degree to which your fund’s holdings differ from its benchmark’s. The logic is simple: you can’t beat an index by replicating it and if you can’t beat it, you should simply buy it.
The study “How Active Is Your Manager” (2009) by Cremers and Petajitso concluded that “Funds with high active share actually do outperform their benchmarks.” The researchers originally looked at an ocean of data covering the period from 1990 to 2003, then updated it through 2009. They found that funds with active share of at least 90% outperformed their benchmarks by 1.13% (113 basis points per year) after fees. Funds with active share below 60% consistently underperformed by 1.42 percentage points a year, after accounting for fees.
Some researchers have suggested that the threshold for active share needs to be adjusted to account for differences in the fund’s investment universe: a fund that invests in large to mega-cap names should have an active share north of 70%, midcaps should be above 80% and small caps above 90%.
So far, we’ve only seen research validating the 60% and 90% thresholds though the logic of the step system is appealing; of the 5008 publicly-traded US stocks, there are just a few hundred large caps but several thousand small and micro-caps.
There are three problems with the active share data. We’d like to begin addressing one of them and warn you of the other two.
Problem One: It’s not available. Morningstar has the data but does not release it, except in occasional essays. Fund companies may or may not have it, but almost none of them share it with investors. And journalists occasionally publish pieces that include an active share chart but those tend to be an idiosyncratic, one-time shot of a few funds. Nuts.
Problem Two: Active share is only as valid as the benchmark used. The calculation of active share is simply a comparison between a fund’s portfolio and the holdings in some index. Pick a bad index and you get a bad answer. By way of simple illustration, the S&P500 stock index has an active share of 100 (woo hoo!) if you benchmark it against the MSCI Emerging Markets Index.
Fund companies might have the same incentive and the same leverage with active share providers that the buyers of bond ratings did: bond issuers could approach three ratings agencies and say “tell me how you’ll rate my bond and I’ll tell you whether we’re paying for your rating.” A fund company looking for a higher active share might simply try several indexes until they find the one that makes them look good. Here’s the warning: make sure you know what benchmark was used and make sure it makes sense.
Problem Three: You can compare active share between two funds only if they’ve chosen to use the same benchmark. One large cap might have an active share of 70 against the Mergent Dividend Achievers Index while another has a 75 against the Russell 1000 Value Index. There’s no way, from that data, to know whether one fund is actually more active than the other. So, look for comparables.
To help you make better decisions, we’ve begun gathering publicly-available active share data released by fund companies. Because we know that compact portfolios are also correlated to higher degrees of independence, we’ve included that information too for all of the funds we could identify. A number of managers and advisors have provided active share data since our March 1st launch. Thanks! Those newly added funds appear in italics.
|
Fund
|
Ticker
|
Active share
|
Benchmark
|
Stocks
|
|
Artisan Emerging Markets (Adv)
|
ARTZX
|
79.0
|
MSCI Emerging Markets
|
90
|
|
Artisan Global Equity
|
ARTHX
|
94.6
|
MSCI All Country World
|
57
|
|
Artisan Global Opportunities
|
ARTRX
|
95.3
|
MSCI All Country World
|
41
|
|
Artisan Global Value
|
ARTGX
|
90.5
|
MSCI All Country World
|
46
|
|
Artisan International
|
ARTIX
|
82.6
|
MSCI EAFE
|
68
|
|
Artisan International Small Cap
|
ARTJX
|
97.8
|
MSCI EAFE Small Cap
|
45
|
|
Artisan International Value
|
ARTKX
|
92.0
|
MSCI EAFE
|
50
|
|
Artisan Mid Cap
|
ARTMX
|
86.3
|
Russell Midcap Growth
|
65
|
|
Artisan Mid Cap Value
|
ARTQX
|
90.2
|
Russell Value
|
57
|
|
Artisan Small Cap
|
ARTSX
|
94.2
|
Russell 2000 Growth
|
68
|
|
Artisan Small Cap Value
|
ARTVX
|
91.6
|
Russell 2000 Value
|
103
|
|
Artisan Value
|
ARTLX
|
87.9
|
Russell 1000 Value
|
32
|
|
Barrow All-Cap Core Investor
|
BALAX
|
92.7
|
S&P 500
|
182
|
|
Diamond Hill Select
|
DHLTX
|
89
|
Russell 3000 Index
|
35
|
|
Diamond Hill Large Cap
|
DHLRX
|
80
|
Russell 1000 Index
|
49
|
|
Diamond Hill Small Cap
|
DHSIX
|
97
|
Russell 2000 Index
|
68
|
|
Diamond Hill Small-Mid Cap
|
DHMIX
|
97
|
Russell 2500 Index
|
62
|
|
DoubleLine Equities Growth
|
DLEGX
|
88.9
|
S&P 500
|
38
|
|
DoubleLine Equities Small Cap Growth
|
DLESX
|
92.7
|
Russell 2000 Growth
|
65
|
|
Driehaus EM Small Cap Growth
|
DRESX
|
96.4
|
MSCI EM Small Cap
|
102
|
|
FPA Capital
|
FPPTX
|
97.7
|
Russell 2500
|
28
|
|
FPA Crescent
|
FPACX
|
90.3
|
Barclays 60/40 Aggregate
|
50
|
|
FPA International Value
|
FPIVX
|
97.8
|
MSCI All Country World ex-US
|
23
|
|
FPA Perennial
|
FPPFX
|
98.9
|
Russell 2500
|
30
|
|
Guinness Atkinson Global Innovators
|
IWIRX
|
99
|
MSCI World
|
28
|
|
Guinness Atkinson Inflation Managed Dividend
|
GAINX
|
93
|
MSCI World
|
35
|
|
Linde Hansen Contrarian Value
|
LHVAX
|
87.1 *
|
Russell Midcap Value
|
23
|
|
Parnassus Equity Income
|
PRBLX
|
86.9
|
S&P 500
|
41
|
|
Parnassus Fund
|
PARNX
|
92.6
|
S&P 500
|
42
|
|
Parnassus Mid Cap
|
PARMX
|
94.9
|
Russell Midcap
|
40
|
|
Parnassus Small Cap
|
PARSX
|
98.8
|
Russell 2000
|
31
|
|
Parnassus Workplace
|
PARWX
|
88.9
|
S&P 500
|
37
|
|
Pinnacle Value
|
PVFIX
|
98.5
|
Russell 2000 TR
|
37
|
|
Touchstone Capital Growth
|
TSCGX
|
77
|
Russell 1000 Growth
|
58
|
|
Touchstone Emerging Markets Eq
|
TEMAX
|
80
|
MSCI Emerging Markets
|
68
|
|
Touchstone Focused
|
TFOAX
|
90
|
Russell 3000
|
37
|
|
Touchstone Growth Opportunities
|
TGVFX
|
78
|
Russell 3000 Growth
|
60
|
|
Touchstone Int’l Small Cap
|
TNSAX
|
97
|
S&P Developed ex-US Small Cap
|
97
|
|
Touchstone Int’l Value
|
FSIEX
|
87
|
MSCI EAFE
|
54
|
|
Touchstone Large Cap Growth
|
TEQAX
|
92
|
Russell 1000 Growth
|
42
|
|
Touchstone Mid Cap
|
TMAPX
|
96
|
Russell Midcap
|
33
|
|
Touchstone Mid Cap Growth
|
TEGAX
|
87
|
Russell Midcap Growth
|
74
|
|
Touchstone Mid Cap Value
|
TCVAX
|
87
|
Russell Midcap Value
|
80
|
|
Touchstone Midcap Value Opps
|
TMOAX
|
87
|
Russell Midcap Value
|
65
|
|
Touchstone Sands Capital Select
|
TSNAX
|
88
|
Russell 1000 Growth
|
29
|
|
Touchstone Sands Growth
|
CISGX
|
88
|
Russell 1000 Growth
|
29
|
|
Touchstone Small Cap Core
|
TSFAX
|
99
|
Russell 2000
|
35
|
|
Touchstone Small Cap Growth
|
MXCAX
|
90
|
Russell 2000 Growth
|
81
|
|
Touchstone Small Cap Value
|
FTVAX
|
94
|
Russell 2000 Value
|
75
|
|
Touchstone Small Cap Value Opps
|
TSOAX
|
94
|
Russell 2000 Value
|
87
|
|
William Blair Growth
|
WBGSX
|
83
|
Russell 3000 Growth
|
53
|
* Linde Hansen notes that their active share is 98 if you count stocks and cash, 87 if you look only at the stock portion of their portfolio. To the extent that cash is a conscious choice (i.e., “no stock in our investable universe meets our purchase standards, so we’ll buy cash”), count both makes a world of sense. I just need to find out how other investors have handled the matter.
Who’s not on the list?
A lot of firms, some of whose absences are in the ironic-to-hypocritical range. Firms not choosing to disclose active share include:
BlackRock – which employs Anniti Petajisto, the guy who invented active share, as a researcher and portfolio manager in their Multi-Asset Strategies group. (They do make passing reference to an “active share buyback” on the part on one of their holdings, so I guess that’s partial credit, right?)
Fidelity – whose 5 Tips to Pick a Winning Fund tells you to look for “stronger performers [which are likely to] have a high ‘active share’”. (They do reprint a Reuters article ridiculing a competitor with a measly 56% active share, but somehow skip the 48% for Fidelity Blue Chip Growth, 47% for Growth & Income, the 37% for MegaCap Stock or the under 50% for six of their Strategic Advisers funds). (per the Wall Street Journal, Is Your Fund a Closet Index Fund, January 14, 2014).
Oakmark – which preens about “Harris Associates and Active Share” without revealing any.
Are you active? Would you like someone to notice?
We’ve been scanning fund company sites for the past month, looking for active share reports. If we’ve missed you, we’re sorry. Help us correct the oversight by sending us the link to where you report your active share stats. We’d be more than happy to offer a permanent home for the web’s largest open collection of active share data.
Does Size Matter?
 By Edward Studzinski
“Convictions are more dangerous enemies of truth than lies.”
Nietzsche
One of the more interesting consequences of the performance of equities in 2013 is the ramp-up of the active investment management marketing machines to explain why their performance in many instances lagged that of inexpensive index funds. This has resulted in a manure storm media blitz with terms and phrases such as “stock picker’s market” or “active share” or “concentrated portfolios.”
“Stock picker’s market” is generally a euphemism for active management. That is, why you should pay me 100 basis points for investing in a subset of the S&P 500, rather than pay Vanguard or some other index fund provider 5 basis points for their product. One of the rationales I used to regularly hear to justify active management fees was that the active manager will know when to get out of the market and when to get back in, whereas the small investor will always go in and out at the wrong time. The period of 2008-2009 puts paid to that argument when one looks at maximum drawdown numbers. The question it raises however is whether the time horizon most investment managers and investors use is far too short. I think it clearly is and that rather than three years or three to five years, we should be thinking of ten years at a minimum. Unfortunately, given personnel turnover in many investment organizations, it is difficult for the investing public to know or understand that the people who gave a fund its long-term performance, looking in the rear-view mirror, are not the ones doing the analysis or selecting the investments going forward. And if they are, often their time and attention is pulled in many other directions. This is why I now, sitting on an endowment investment committee, appreciate why an integral part of the investment consultant’s report covers stability of personnel and succession planning at current firms invested in as well as firms proposed for consideration. Of course, if you are the average retail investor, you are far better off to focus on your risk tolerance, true time horizon, and asset allocation, again making use of low cost index products if you are not going to spend the time and effort to replicate the work of the consultants used by endowments and pension funds.
I am going to leave it to others to discuss “active share.” I do think the question of “concentrated portfolios” is worth a few thoughts. I once asked a friend of mine, at a large East Coast fund complex, how he managed to keep track of the two hundred or so stocks in his fund portfolio. His answer was illuminating. He said that his firm had a very large research department and prided itself on its selection and training of analysts. Politically then, over time he had to use an idea or two from everyone or every area. His preference would have been to have a much more concentrated portfolio. I will refer to that then as the “ark” approach to investment management. Other firms, such as Longleaf, have tended from the get-go to have truly concentrated portfolios, say somewhere between twenty to twenty five stocks, given that the benefits of diversification run-out at a certain number of securities. Their rationale has been that rarely, when you are building a portfolio from the bottom up based on what are the most undervalued ideas, do ideas number thirty to forty have the same expected return potential as ideas number one to ten. (That is even more the case with the S&P 500 hitting new all time highs now).
There is another way to look at this which I think makes it more understandable for the average person. In 2006, Huber Capital Managed LLC performed a study, looking at value-oriented investors, entitled “Limited Assets Under Management is a Competitive Advantage.” The study assumed an equal weighted portfolio of 2.5% positions (forty stocks) to show how the investable universe of securities shrank at certain asset levels. It looked at the Russell 1000 Value Index and the Russell 2000 Value Index. The conclusion of the study was that as assets under management grew, portfolio managers faced increasingly unpleasant choices. One choice of course was to shrink the investment universe, what I have referred to in the past as the rule limiting investments to securities that can be bought or sold in five days average trading volume.
Another alternative was to increase the number of stocks held in the portfolio. You can see whether your manager has done this by going back five or ten years and looking at annual reports. When the fund was $5B in asset size, did it own thirty stocks? Do you really believe that with the fund at $10B or $15B in asset size, that it has found another twenty or thirty undervalued stocks? Look also to see if the number of research analysts has increased materially. Are roughly the same number of analysts covering more names?
The third choice was to make the fund very concentrated or even non-diversified by SEC standards, with individual positions greater than five per cent. That can work, but it entails taking on career risk for the analysts and fund managers, and enterprise risk for the management company. A fund with $10B in assets under management has available only 50% of the investable set of stocks to invest in, assuming it is going to continue to focus on liquidity of the investment as an implicit criteria. That is why you see more and more pension funds, endowments, and family office managers shifting to low-cost index or ETF vehicles for their large cap investments. The incremental return is not justified by the incremental fee over the low-cost vehicle. And with a long-term time horizon, the compounding effect of that fee differential becomes truly important to returns.
My thanks to Huber Capital Manangement LLC for doing this study, and to Long Short Advisors for making me aware of it in one of their recent reports. Both firms are to be commended for their integrity and honesty. They are truly investment managers rather than asset gatherers.
On the impact of fund categorization: Morningstar’s rejoinder
 Morningstar’s esteemed John Rekenthaler replied to MFO’s February commentary on categorization, although officially “his views are his own.” His February 5 column is entitled How Morningstar Categorizes Funds.
Snowball’s gloss: John starts with a semantic quibble (Charles: “Morningstar says OSTFX is a mid-cap blend fund,” John: “Morningstar does not say what a fund is,” just what category it’s been assigned to), mischaracterizes Charles’s article as “a letter to MFO” (which I mention only because he started the quibble-business) and goes on to argue that the assignment of OSTFX to its category is about as reasonable a choice as could be made. Back to Charles:
Mr. R. uses BobC’s post to frame an explanation of what Morningstar does and does not do with respect to fund categorization. In his usual thoughtful and self-effacing manner, he defends the methodology, while admitting some difficulty in communicating. Fact is, he remains one of Morningstar’s best communicators and Rekenthaler Report is always a must read.
I actually agree with his position on Osterweis. Ditto for his position on not having an All Cap category (though I suspect I’m in the minority here and he actually admits he may be too). He did not address the (mis-)categorization of River Park Short Term High Yield Fund (RPHYX/RPHIX, closed). Perhaps because he is no longer in charge of categorization at Morningstar.
The debate on categorization is never-ending, of course, as evidenced by the responses to his report and the many threads on our own board. For the most part, the debate remains a healthy one. Important for investors to understand the context, the peer group, in which prospective funds are being rated.
In any case and as always, we very much appreciate Mr. Rekenthaler taking notice and sharing his views.
Snowball’s other gloss: geez, Charles is a lot nicer than I am. I respect John’s work but frankly I don’t really tingle at the thought that he “takes notice.” Well, except maybe for that time at the Morningstar conference when he swerved at the last minute to avoid crashing into me. I guess there was a tingle then.
Snowball’s snipe: at the sound of Morningstar’s disdain, MFWire did what MFWire does. They raised high the red-and-white banner, trumpeting John’s argument and concluding with a sharp “grow up, already!” I would have been much more impressed with them if they’d read Charles’s article beforehand. They certainly might have, but there’s no evidence in the article that they felt that need.
One of the joys of writing for the Observer is the huge range of backgrounds and perspectives that our readers bring to the discussion. A second job is the huge range of backgrounds and perspectives that my colleagues bring. Charles, in particular, can hear statistics sing. (He just spent a joyful week in conference studying discounted cash-flow models.) From time to time he tries, gently, to lift the veil of innumeracy from my eyes. The following essay flows from our extended e-mail exchanges in which I struggled to understand the vastly different judgments of particular funds implied by different ways of presenting their risk-adjusted statistics.
We thought some of you might like to overhear that conversation.
Morningstar’s Risk Adjusted Return Measure
Central to any fund rating system is the performance measure used to determine percentile rank order. MFO uses Martin ratio, as described Rating System Definitions. Morningstar developed its own risk adjusted return (MRAR), which Nobel Laureate William Sharpe once described as a measure that “…differs significantly from more traditional ones such as various forms of the Sharpe ratio.” While the professor referred to an earlier version of MRAR, the same holds true today.
Here is how Morningstar describes MRAR on its Data FAQ page: Morningstar adjusts for risk by calculating a risk penalty for each fund based on “expected utility theory,” a commonly used method of economic analysis. Although the math is complex, the basic concept is relatively straightforward. It assumes that investors are more concerned about a possible poor outcome than an unexpectedly good outcome and that those investors are willing to give up a small portion of an investment’s expected return in exchange for greater certainty. A “risk penalty” is subtracted from each fund’s total return, based on the variation in its month-to-month return during the rating period, with an emphasis on downward variation. The greater the variation, the larger the penalty. If two funds have the exact same return, the one with more variation in its return is given the larger risk penalty.
For the curious and mathematically inclined, the detailed equations are well documented in The Morningstar Rating Methodology. The following figure illustrates how MRAR behaves for three hypothetical funds over a 3 year period ending Dec 2013:
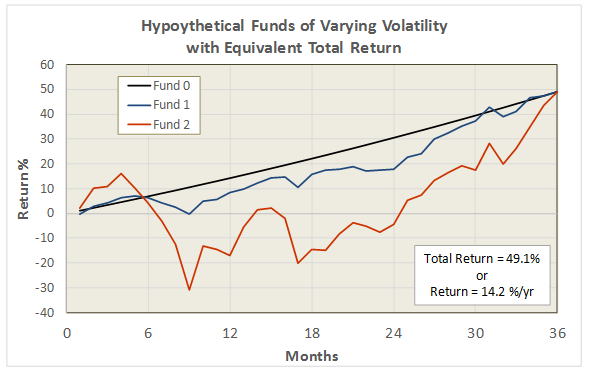
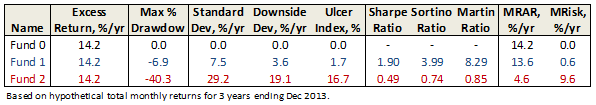
Each fund in the illustration delivers the same total return, but with varying levels of volatility. The higher the volatility, the lower the risk adjusted return. Fund 0 delivers consistent returns every month with zero volatility; consequently, it receives the highest MRAR, which in this case is the fund’s annualized total return minus the risk-free T-Bill (i.e., it’s the annualized “excess” return).
Morningstar computes MRAR for all funds over equivalent periods, and then percentile ranks them within their respective categories to assign appropriate levels, 1 star for those funds in the lowest group and the coveted 5 star rating for the highest.
It also computes a risk measure MRisk and performs a similar ranking to designate “low” to “high” risk funds within each category. MRisk is simply the difference between the annualized excess return of the fund and its MRAR.
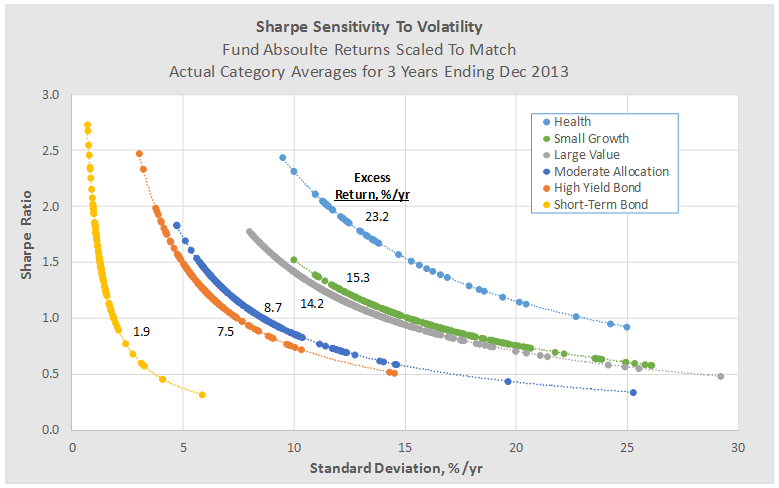
The following figure provides further insight into how MRAR behaves for funds of varying volatility. This time, fund total returns have been scaled to match their category averages, again for the 3 year period ending Dec 2013. The figure includes results from several categories showing MRAR versus the tradition volatility measure, annualized standard deviation.
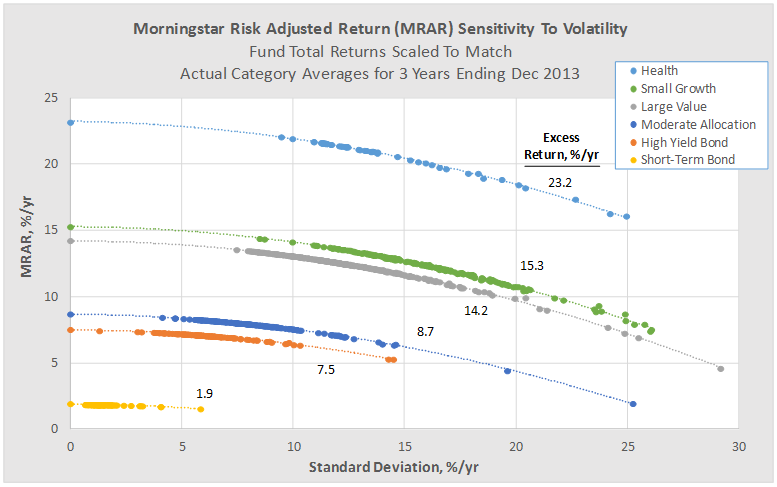
Once again we see that funds with higher volatility generally receive lower MRARs and that the highest possible MRAR is equal to a fund’s annualized excess return, which occurs at zero standard deviation.
A consequence of Morningstar’s methodology is that low volatility funds with below average returns can quite possibly be out-ranked by average volatility funds with average returns. Put another way, the methodology generally penalizes funds with high volatility more so than it rewards funds with low volatility, since with the latter the benefit is “capped.”
This behavior is different from other risk adjusted return measures based on say Sharpe ratio, as can be seen in the figure below. Here the same funds from above are plotted against Sharpe, but now funds with low volatility are rewarded handsomely, even if they have below average total returns.
Revisiting the Morningstar risk measure MRisk, one finds another observation: it appears to correlate rather satisfactorily against a simple function based on standard deviation (up to about 30% for funds of positive total return without load):
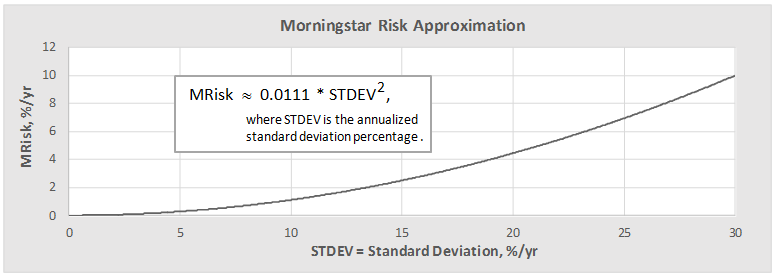
Which means that Morningstar’s risk adjusted return can be estimated from the following:
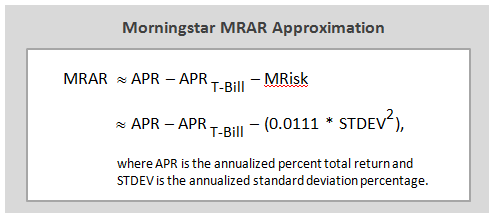
This simple approximation may come in handy, like when David wonders: “Why do RPHIX and ICMYX, which have superior 3 year Sharpe ratios, rate a very inferior 1 star by Morningstar?” He can use the above calculation to better understand, as illustrated here:
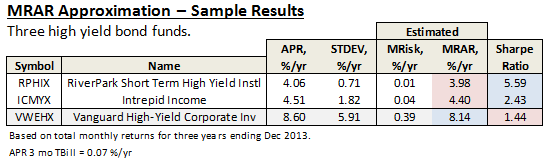
While both do indeed have great 3 year Sharpe ratios – RPHIX is highest of any US fund – they both have below average total returns relative to their current peer group, as represented by say VWEHX, a moderate risk and average returning high yield bond “reference” fund.
Their low volatilities simply get no love from Morningstar’s risk adjusted return measure.
27Feb2014/Charles
Celebrating one-starness
I was having a nice back-channel conversation with a substantially frustrated fund manager this week. He read Charles’s piece on fund categorization and wrote to express his own dismay with the process. He’s running a small fund. It hit its three-year mark and earned five stars. People noticed. Then Morningstar decided to recategorize the fund (into something he thinks he isn’t). And it promptly became one star. And, again, people – potential investors – noticed, but not in a good way.
Five to one, with the stroke of a pen? It happens, but tends not to get trumpeted. After all, it rather implies negligence on Morningstar’s part if they’ve been labeling something as, say, a really good conservative allocation fund for years but then, on further reflection, conclude that it’s actually a sucky high-yield bond or preferred stock fund.
Here’s what Morningstar’s explanation for such a change looks like in practice:
Morningstar Alert
Osterweis Strategic Income Fund OSTIX
12-03-13 01:00 PM
Change in Morningstar Fund Star Rating: The Morningstar Star Rating for this fund has changed from 4 stars to 2 stars. For details, go to http://quicktake.morningstar.com/Fund/RatingsAndRisk.asp?Symbol=OSTIX.
Sadly, when you go to that page there are no details that would explain an overnight drop of that magnitude. On the “performance” page, you will find the clue:

I don’t have an opinion on the appropriateness of the category assignment but it would be an awfully nice touch, given the real financial consequences of such a redesignation, if Morningstar would take three sentences to explain their rationale at the point that they make the change.
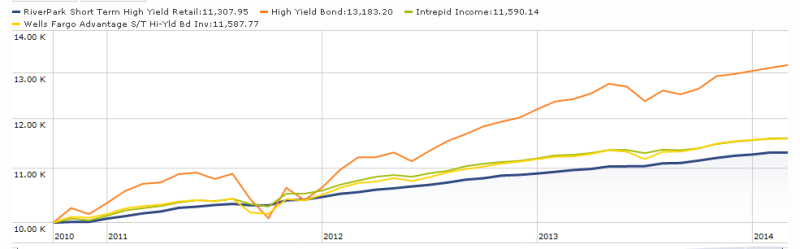
Which got me to thinking about my own favorite one-star fund (RiverPark Short Term High Yield RPHYX and RPHIX, which is closed) and Charles’s favorite one-shot stat on a fund’s risk-adjusted returns (its Sharpe ratio).
And so, here’s the question: how many funds have a higher (i.e., better) Sharpe ratio than does RPHYX?
And, as a follow-up, how many have a Sharpe ratio even half as high as RiverPark’s?
That would be “zero” and “seven,” respectively, out of 6500 funds.
Taking up Rekenthaler’s offer
In concluding his response to Charles’s essay, John writes:
A sufficient critique is one that comes from a fund that truly does not behave like others in its category, that contains a proposal for a modification to the existing category system, that does not lead to rampant category proliferation, and that results in a significantly closer performance comparison between the fund and its new category. In such cases, Morningstar will consider the request carefully–and sometimes make the suggested change.
Ummm … short-term high-yield? In general, those are funds that are much more conservative than the high-yield group. The manager at RiverPark Short-Term High Yield (RPHYX) positions the fund as a “cash management” account. The managers at Intrepid Income (ICMYX) claim to be “absolute return” investors. Wells Fargo Advantage Short-Term High-Yield Bond (STHBX) seems similarly positioned. All are one-star funds (as of February 2014) when judged against the high-yield universe.
“Does not behave like others in its category” but “results in a significantly closer performance comparison [within] its new category.” The orange line is the high-yield category. That little cluster of parallel, often overlapping lines below it are the three funds.
“Does not lead to rampant category proliferation.” You mean, like creating a “preferred stock” category with seven funds? That sort of proliferation? If so, we’re okay – there are about twice as many short-term high-yield candidates as preferred stock ones.
I’m not sure this is a great idea. I am pretty sure that dumping a bunch of useful, creative funds into this particular box is a pretty bad one.
Next month’s unsought advice will highlight emerging markets balanced (or multi-asset) funds. We’re up to a dozen of them now and the same logic that pulled US balanced funds out of the equity category and global balanced funds out of the international equity category, seems to be operating here.
Two things you really should read
In general, most writing about funds has the same problem as most funds do: it’s shallow, unoriginal, unreflective. It contributes little except to fill space and get somebody paid (both honorable goals, by the way). Occasionally, though, there are pieces that are really worth some of our time, thought and reflection. Here are two.
I’m not a great fan of ETFs. They’ve always struck me as trading vehicles, tools for allowing hedge funds and others to “make bets” rather than to invest. Chuck Jaffe had a really solid piece entitled “The growing case against ETFs” (Feb. 23, 2014) that makes the argument that ETFs are bad for you. Why? Because the great advantage of ETFs are that you can trade them all day long. And, as it turns out, if you give someone a portfolio filled with ETFs that’s precisely – and disastrously – what they do.
The Observer was founded on the premise that small, independent, active funds are the only viable alternative to a low-cost indexed portfolio. As funds swell, two bad things happen: their investable universe shrinks and the cost of making a mistake skyrockets, both of which lead to bad investment choices. There’s a vibrant line of academic research on the issue. John Rekenthaler began dissecting some of that research – in particular, a recent study endorsing younger managers and funds – in a four-part series of The Rekenthaler Report. At this writing, John had posted two essays: “Are Young Managers All That?” (Feb. 27, 2014) and “Has Your Fund Become Too Large, Or Is Industry Size the Problem?” (Feb. 28, 2014). The first essay walks carefully through the reasons why older, larger funds – even those with very talented managers – regress. To my mind, he’s making a very strong case for finding capacity-constrained strategies and managers who will close their funds tight and early. The second picks up an old argument made by Charles Ellis in his 1974 “The Loser’s Game” essay; that the growth and professionalization of the investment industry is so great that no one – certainly not someone dragging a load – can noticeably outrun the crowd. The problem is less, John argues, the bloat of a single fund as the effect of “$3 trillion in smart money chasing the same ideas.”
Regardless of whether you disdain or adore ETFs, or find the industry’s difficulties located at the level of undisciplined funds or an unwieldy industry, you’ll come away from these essays with much to think about.
RiverPark Strategic Income: Another set of ears
I’m always amazed by the number of bright and engaging folks who’ve been drawn to the Observer, and humbled by their willingness to freely share some of their time, insights and experience with the rest of us. One of those folks is an investor and advisor named “Mark” who is responsible for extended family money, a “multi-family office” if you will. He had an opportunity to spend some time chatting with David Sherman in mid-January as he contemplated a rather sizeable investment in RiverPark Strategic Income (RSIVX) for some family members who would benefit from such a strategy. Herewith are some of the reflections he shared over the course of a series of emails with me.
Where he’s coming from
Mark wrote that to him it’s important to understand the “context” of RSIVX. Mr. Sherman manages private strategies and hedge fund monies at Cohanzick Management, LLC. He cut his teeth at Leucadia National (whose principal Ian Cumming is sometimes referred to as Canada’s Warren Buffett) and is running some sophisticated and high entry strategies that have big risks and big rewards. His shop is not as large as some, sure, but Mr. Sherman seems to prefer it that way.
Some of what Mr. Sherman does all day “informs” RSIVX. He comes across an instrument or an idea that doesn’t fit in one strategy but may in another. It has the risk/reward characteristics that he wants for a particular strategy and so he and his team perform their due diligence on it. More on that later.
Where he is
RSIVX only exists, according to Mr. Sherman, because it fills a need. The need is for an annuity like stream of income at a rate that “his mother could live off” and he did not see such a thing in the marketplace. (In 2007 you could park money at American Express Bank in a jumbo CD at 5.5%. No such luck today.) He saw many other total return products out there in the high yield space where an investor can get a bit higher returns than what he envisions. But some of those returns will be from capital appreciation, i.e., returns from in essence trading. Mr. Sherman did not want to rely on that. He wants a lower duration portfolio (3-4 years) that he can possibly but not necessarily hold to get nice, safe, relatively high coupons from. As long as his investor has that timeframe, Mr. Sherman believes he can compound the money at 6-8% annually, and the investor gets his money back plus his return.
Shorter timeframes, because of impatience or poor timing choices, carry no such assurances. It’s not a CD, it’s not a guaranteed annuity from an insurer, but it’s what is available and what he is able to get for an investor.
How? Well, one inefficiency he hopes to exploit is in the composition of SPDR Barclays High Yield Bond (JNK) and iShares High Yield Corporate Bond (HYG). He doesn’t believe they reflect the composition of high yield space accurately with their necessary emphasis on the most liquid names. He will play in a different sandbox with different toys. And he believes it’s no more risky and thinks it is less so. In addition, when the high yield market moves, especially down, those names move fast.
Mark wrote that he asked David whether the smoothness of his returns exhibited in RPHYX and presumably in RSIVX in the future was due or would be due to a laddering strategy that he employed. He said that it was not – RSIVX’s portfolio was more of a barbell presently- and he did not want to be pigeonholed into a certain formula or strategy. He would do whatever it took to produce the necessary safe returns and that may change from time to time depending upon the market.
What changing interest rates might mean
What if rates fall? If rates fall then, sure, the portfolio will have some capital appreciation. What if rates rise? Well, every day and every month, David said, the investor will grind toward the payday on the shorter duration instruments he is holding. Mark-to-market they will be “worth” less. The market will be demanding higher interest rates and what hasn’t rolled off yet will not be as competitive as the day he bought them. The investor will still be getting a relatively high 6-8% return and as opportunities present themselves and with cash from matured securities and new monies the portfolio will be repopulated over time in the new interest rate environment. Best he can do. He does not intend to play the game of hedging.
Where he might be going

Mark said he also asked about a higher-risk follow-on to RSIVX. He said that David told him that if he doesn’t have something unique to bring that meets a need, he doesn’t want to do it. He believes RPHYX and RSIVX to be unique. He “knew” he could pull off RPHYX, that he could demonstrate its value, and then have the credibility to introduce another idea. That idea is the Strategic Income Fund.
He doesn’t see a need for him to step out on the spectrum right now. There are a hundred competitors out there and a lot of overlap. People can go get a total return fund with more risk of loss. Returns from them will vary a lot from year to year unless conditions are remarkably stable. This [strategy] almost requires a smaller, more nimble fund and manager. Here he is. Here it is. So the next step out isn’t something he is thinking [immediately] about, but he continually brings ideas to Morty.
Mark concludes: “We discussed a few of his strategies that had more risk. They are fascinating but definitely not vanilla or oatmeal and a few I had to write out by hand the mechanics afterward so I could “see” what he was doing. One of them took me about an hour to work through where the return came from and where it could go possibly wrong.
But he described it to me because working on it gave him the inspiration for a totally different situation that, if it came to pass, would be appropriate for RSIVX. It did, is much more vanilla and is in the portfolio. Very interesting and shows how he thinks. Would love to have a beer with this guy.”
Mark’s bottom line(s)
Mark wanted me to be sure to disclose that he and his family have a rather large position in RiverPark Strategic Income now, and will be holding it for an extended period assuming all goes well (years) so, yeah, he may be biased with his remarks. He says “the strategy is not to everyone’s taste or risk tolerance”. He holds it because it exactly fills a need that his family has.
Observer Fund Profiles:
Each month the Observer provides in-depth profiles of between two and four funds. Our “Most Intriguing New Funds” are funds launched within the past couple years that most frequently feature experienced managers leading innovative newer funds. “Stars in the Shadows” are older funds that have attracted far less attention than they deserve.
Driehaus Emerging Markets Small Cap Growth (DRESX): There’s a lot to be said for EM small caps. They provide powerful diversification and performance benefits for a portfolio. The knock of them is that they’re too hot to handle. Driehaus’s carefully constructed, hedged portfolio seems to have cooled the handle by a lot.
Guinness Atkinson Inflation Managed Dividend (GAINX): It’s easy to agree that owning the world’s best companies, especially if you buy them on the cheap, is a really good strategy. GAINX approaches the challenge of constructing a very compact, high quality, low cost portfolio with quantitative discipline and considerable thought.
Intrepid Income (ICMUX): What’s not to like about this conservative little short-term, high-yield fund. It’s got it all: solid returns, excellent risk management and that coveted one-star rating! Intrepid, like almost all absolute value investors, is offering an object lesson on the important of fortitude in the face of frothy markets and serial market records.
RiverPark Gargoyle Hedged Value (RGHVX): The short story is this. Gargoyle’s combination of a compact, high quality portfolio and options-based hedging strategy has, over time, beaten just about every reasonable comparison group. Unless you anticipate a series of 20 or 30% gains in the stock market over the rest of the decade, it might be time to think about protecting some of what you’ve already made.
Elevator Talk: Ted Gardner, Salient MLP & Energy Infrastructure II (SMLPX)
 Since the number of funds we can cover in-depth is smaller than the number of funds worthy of in-depth coverage, we’ve decided to offer one or two managers each month the opportunity to make a 200 word pitch to you. That’s about the number of words a slightly-manic elevator companion could share in a minute and a half. In each case, I’ve promised to offer a quick capsule of the fund and a link back to the fund’s site. Other than that, they’ve got 200 words and precisely as much of your time and attention as you’re willing to share. These aren’t endorsements; they’re opportunities to learn more.
Master limited partnerships (MLPs) are an intriguing asset class which was, until very recently, virtually absent from both open-end fund and ETF portfolios.
MLPs are a form of business organization, in the same way corporations are a form of organization. Their shares trade on US exchanges (NYSE and NASDAQ) and they meet the same SEC security registration requirements as corporations do. They were created in the 1980s primarily as a tool to encourage increased energy production in the country and the vast majority of MLPs (75% or so) are in the energy sector.
MLPs are distinct from corporations in a number of ways:
- They’re organized around two groups: the limited partners (i.e., investors) and the general partners (i.e., managers). The limited partners provide capital and receive quarterly distributions.
- MLPs are required, by contract, to pay minimum quarterly distributions to their limited partners. That means that they produce very consistent streams of income for the limited partners.
- MLPs are required, by law, to generate at least 90% of their income from “qualified sources.” Mostly that means energy production and distribution.
The coolest thing about MLPs is the way they generate their income: they operate hugely profitable, economically-insensitive monopolies whose profits are guaranteed by law. A typical midstream MLP might own a gas or oil pipeline. The MLP receives a fee for every gallon of oil or cubic foot of gas moving through the pipe. That rate is set by a federal agency and that rate rises every year by the rate of inflation plus 1.3%. It doesn’t matter whether the price of oil soars or craters; the MLP gets its toll regardless. And it doesn’t really matter whether the economy soars or craters: people still need warm homes and gas to get to work. At worst, bad recessions eliminate a year’s demand rise but haven’t yet caused a net demand decrease. As the population grows and energy consumption rises, the amount moving through the pipelines rise and so does the MLPs income.
Those profits are protected by enormously high entry barriers: building new pipelines cost billions, require endless hearings and permits, and takes years. As a result, the existing pipelines function as de facto a regional monopoly, which means that the amount of material traveling through the pipeline won’t be driven down by competition for other pipelines.
Quick highlights of the benchmark Alerian MLP index:
- From inception through early 2013, the index returned 16% annually, on average.
- For that same period, it had a 7.1% yield which grew 7% annually.
- There is a low correlation – 50 – between the stock market and the index. REITs say at around 70 and utility stocks at 25, but with dramatically lower yield and returns.
Only seven of the 17 funds with “MLP” in their names have been around long enough to quality for a Morningstar rating; all seven are four- or five-star funds, measured against an “energy equity” peer group. Here’s a quick snapshot of Salient (the blue line) against the two five-star funds (Advisory Research MLP & Energy Income INFIX and MLP & Energy Infrastructure MLPPX) and the first open-end fund to target MLPs (Oppenheimer SteelPath MLP Alpha MLPAX):
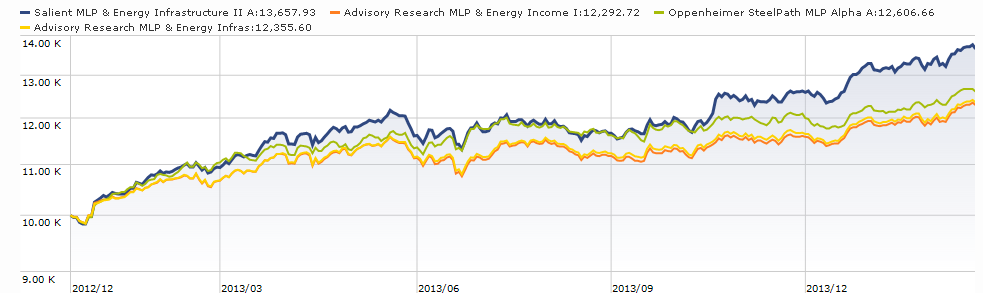
The quick conclusion is that Salient was one of the best MLP funds until autumn 2013, at which point it became the best one. I did not include the Alerian MLP index or any of the ETFs which track it because they lag so far behind the actively-managed funds. Over the past year, for example, Salient has outperformed the Alerian MLP Index – delivering 20% versus 15.5%.
High returns and substantial diversification. Sounds perfect. It isn’t, of course. Nothing is. MLP took a tremendous pounding in the 2007-09 meltdown when credit markets froze and dropped again in August 2013 during a short-lived panic over changes in MLP’s favorable tax treatment. And it’s certainly possible for individual MLPs to get bid up to fundamentally unattractive valuations.
 Ted Gardner is the co‐portfolio manager for Salient’s MLP Complex, one manifestation of which is SMLPX. He oversees and coordinates all investment modeling, due diligence, company visits, and management conferences. Before joining Salient he was both Director of Research and a portfolio manager for RDG Capital and a research analyst with Raymond James. Here are his 200 words on why you should consider getting into the erl bidness:
Our portfolio management team has many years of experience with MLP investing, as managers and analysts, in private funds, CEFs and separate accounts. We considered both the state of the investment marketplace and our own experiences and thought it might translate well into an open-end product.
As far as what we saw in the marketplace, most of the funds out there exist inside a corporate wrapper. Unfortunately C-Corp funds are subject to double taxation and that can create a real draw on returns. We felt like going the traditional mutual fund, registered investment company route made a lot of sense.
We are very research-intensive, our four analysts and I all have a sell side background. We take cash flow modeling very seriously. It’s a fundamental modeling approach, modeling down to the segment levels to understand cash flows. And, historically, our analysts have done a pretty good job at it.
We think we do things a bit differently than many investors. What we like to see is visible growth, which means we’re less yield-oriented than others might be. We typically like partnerships that have a strategic asset footprint with a lot of organic growth opportunities or those with a dropdown story, where a parent company drops more assets into a partnership over time. We tend to avoid firms dependent on third-party acquisitions for growth. And we’ve liked investing in General Partners which have historically grown their dividends at approximately twice the rate of the underlying MLPs.
The fund has both institutional and retail share classes. The retail classes (SMAPX, SMPFX) nominally carry sales loads, but they’re available no-load/NTF at Schwab. The minimum for the load-waived “A” shares is $2,500. Expenses are 1.60% on about $630 million in assets. Here’s the fund’s homepage, but I’d recommend that you click through to the Literature tab to grab some of the printed documentation.
River Park/Gargoyle Hedged Value Conference Call Highlights
 On February 12th we spoke for an hour with Alan Salzbank and Josh Parker, both of the Gargoyle Group, and Morty Schaja, CEO of RiverPark Funds. Here’s a brief recap of the highlights:
Alan handles the long portfolio. Josh, a securities lawyer by training, handles the options portfolio. He’s also an internationally competitive bridge player (Gates, Buffett, Parker…) and there’s some reason to believe that the habits of mind that make for successful bridge play also makes for successful options trading. They have 35 and 25 years of experience, respectively, and all of the investment folks who support them at Gargoyle have at least 20 years of experience in the industry. Morty has been investigating buy-write strategies since the mid-1980s and he described the Gargoyle guys as “the team I’ve been looking for for 25 years.”
The fund combines an unleveraged long portfolio and a 50% short portfolio, for a steady market exposure of 50%. The portfolio rebalances between those strategies monthly, but monitors and trades its options portfolio “in real time” throughout the month.
The long portfolio is 80-120 stocks, and stock selection is algorithmic. They screen the 1000 largest US stocks on four valuation criteria (P/B, P/E, P/CF, P/S) and then assign a “J score” to each stock based on how its current valuation compares with (1) its historic valuation and (2) its industry peers’ valuation. They then buy the 100 more undervalued stocks, but maintain sector weightings that are close to the S&P 500’s.
The options portfolio is a collection of index call options. At base, they’re selling insurance policies to nervous investors. Those policies pay an average premium of 2% per month and rise in value as the market falls. That 2% is a long-term average, during the market panic in the fall of 2008, their options were generating 8% per month in premiums.
Why index calls? Two reasons: (1) they are systematically mispriced, and so they always generate more profit than they theoretically should. In particular, they are overpriced by about 35 basis points/month 88% of the time. For sellers, that means something like a 35 bps free lunch. And (2) selling calls on their individual stocks – that is, betting that the stocks in their long portfolio will fall – would reduce returns. They believe that their long portfolio is a collection of stocks superior to any index and so they don’t want to hedge away any of their upside.
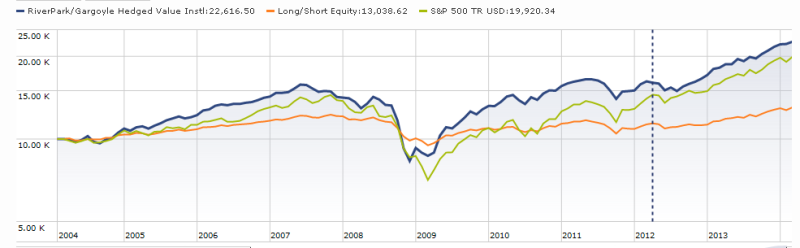
And it works. Their long portfolio has outperformed the S&P 500 by an average of 5% per year for 15 years. The entire strategy has outperformed the S&P in the long-term and has matched its returns, with less volatility, in the shorter term. Throughout, it has sort of clubbed its actively-managed long-short peers. It also anticipates clubbing the emerging bevy of buy-write ETFs.
The guys identify two structural advantages they have over an ETF: (1) they buy stocks superior to those in broad indexes and (2) they manage their options portfolio moment by moment, while the ETF just sits and takes hits for 29 out of 30 days each month.
There’s evidence that they’re right. The ETFs are largely based on the CBOE S&P Buy-Write Index (BXM). Between 2000-12, the S&P 500 returned 24% and the BXM returned 52%; the options portion of the Gargoyle portfolio returned 110% while the long portfolio crushed the S&P.
Except not so much in 2008. The fund’s maximum drawdown was 48%, between 10/07 and 03/08. The guys attributed that loss to the nature of the fund’s long portfolio: it buys stocks in badly dented companies when the price of the stock is even lower than the company’s dents would warrant. Unfortunately in the meltdown, those were the stocks people least wanted to own so they got killed. The fund’s discipline kept them from wavering: they stayed 100% invested and rebalanced monthly to buy more of the stocks that were cratering. The payback comes in 2009 when they posted a 42% return against the S&P’s 26% and again in 2010 when they made 18% to the index’s 15%.
The managers believe that ’08 was exceptional, and note that the strategy actually made money from 2000-02 when the market suffered from the bursting of the dot-com bubble.
In general, the strategy fares poorest when the market has wild swings. It fares best in gently rising markets, since both the long and options portfolios can make money if the market rises but less than the strike price of the options – they can earn 2% a month on an option that’s triggered if the market rises by more than 1%. If the market rises but by less than 1%, they pay out nothing, pocket the 2% and pocket the capital appreciation from their long portfolio.
What’s the role of the fund in a portfolio? They view it as a substitute for a large-cap value investment; so if your asset allocation plan is 20% LCV, then you could profitably invest up to 20% of your portfolio in Gargoyle. For the guys, it’s 100% of their US equity exposure.
Morty Speaks! The rationale for hedging a long-term portfolio.
The Gargoyle call sparked – here’s a surprise – considerable commentary on our discussion board. Some were impressed with Josh and Alan’s fortitude in maintaining their market exposure during the 2007-09 meltdown but others had a more quizzical response. “Expatsp” captured it this way: “Though this seems the best of the long/short bunch, I just don’t see the appeal of long/short funds for anyone who has a long-term horizon.”

No. Not Morty.
There’s a great scene in Big Bang Theory where the brilliant but socially-inept Sheldon clears up a misunderstanding surrounding a comment he made about his roommate: “Ah, I understand the confusion. Uh, I have never said that you are not good at what you do. It’s just that what you do is not worth doing.” Same theme.
Morty Schaja, RiverPark’s president, is in an interesting position to comment on the question. His firm not only advises a pure long/short fund (RiverPark Long/Short Opportunity RLSFX) and a long hedged with options fund (RiverPark Gargoyle), but it also runs a very successful long-only fund (RiverPark Large Cap Growth RPXFX, which he describes as “our five-star secret weapon”).
With the obvious disclaimer that Morty has a stake in the success of all of the RiverPark funds (and the less-obvious note that he has invested deeply in each), we asked him the obvious question: Is it worth doing?
The question is simple. The answer is more complex.
I believe the market will rise over time and that over the long run investing in a long-only strategy makes investment sense. Most analysts stop there believing that a higher expected return is the driving factor and that volatility and risk are less relevant if you have the luxury of not needing the money over a long time period like ten years or greater. Yet, I believe allocating a portion of your investable assets in hedged strategies makes economic sense.
Why is that? I have a list of reasons:
- Limiting the downside adds to the upside: It’s the mathematics of compounding. Eliminating the substantial down drafts makes it easier to realize better long term average returns. For example, after a 30% decline you need to gain 42.85% to get back to even. A fund that goes up 20% every other year, and declines 10% every other year, averages 8.0% per year. In contrast, a fund that goes up 30% every other year and declines 20% every other year only averages 4.0% per year. That’s why a strategy capturing, say, 80% of the market’s upside and 50% of its downside can, in the long term, produce greater returns than a pure equity strategy.
- Hedging creates an atmosphere of manageable, tolerable risk. Many studies of human nature show that we’re not nearly as brave as we think we are. We react to the pain of a 10% loss much more strongly than to the pleasure of a 10% gain. Hedged funds address that unquestioned behavioral bias. Smaller draw downs (peak to trough investment results) help decrease the fear factor and hopefully minimize the likelihood of selling at the bottom. And investors looking to increase their equity exposure may find it more tolerable to invest in hedged strategies where their investment is not fully exposed to the equity markets. This is especially true after the ferocious market rally we have experienced since the financial crisis.
- You gain the potential to play offense: Maintaining a portion of your assets in hedged strategies, like maintaining a cash position, will hopefully provide investors the funds to increase their equity exposure at times of market distress. Further, certain hedged strategies that change their exposure, either actively or passively, based on market conditions, allows the fund managers to play offense for your benefit.
- You never know how big the bear might be: The statistics don’t lie. The equity indices have historically experienced positive returns over rolling ten-year periods since we started collecting such data. Yet, there is no guarantee. It is not impossible that equities could enter a secular (that is, long-term) bear market and in such an environment long-only funds would arguably be at a distinct disadvantage to hedged strategies.
It’s no secret that hedged funds were originally the sole domain of very high net worth, very sophisticated investors. We think that the same logic that was compelling to the ultra-rich, and the same tools they relied on to preserve and grow their wealth, would benefit the folks we call “the mass affluent.”
Since RiverPark is one of the very few investment advisors to offer the whole range of hedged funds, I asked Morty to share a quick snapshot of each to illustrate how the different strategies are likely to play out in various sets of market conditions.
Let’s start with the RiverPark Long/Short Opportunity Fund.
Traditional long/short equity funds, such as the RiverPark Long/Short Opportunity Fund, involve a long portfolio of equities and a short book of securities that are sold short. In our case, we typically manage the portfolio to a net exposure of about 50%: typically 105%-120% invested on the long side, with a short position of typically 50%-75%. The manager, Mitch Rubin, manages the exposure based on market conditions and perceived opportunities, giving us the ability to play offense all of the time. Mitch likes the call the fund an all-weather fund; we have the ability to invest in cheap stocks and/or short expensive stocks. “There is always something to do”.
How does this compare with the RiverPark/Gargoyle Hedged Value Fund?
The RiverPark/Gargoyle Hedged Value Fund utilizes short index call options to hedge the portfolio. Broadly speaking this is a modified buy/write strategy. Like the traditional buy/write, the premium received from selling the call options provides a partial cushion against market losses and the tradeoff is that the Fund’s returns are partially capped during market rallies. Every month at options expiration the Fund will be reset to a net exposure of about 50%. The trade-off is that over short periods of time, the Fund only generates monthly options premiums of 1%-2% and therefore offers limited protection to sudden substantial market declines. Therefore, this strategy may be best utilized by investors that desire equity exposure, albeit with what we believe to be less risk, and intend to be long term investors.
And finally, tell us about the new Structural Alpha Fund.
The RiverPark Structural Alpha Fund was converted less than a year ago from its predecessor partnership structure. The Fund has exceptionally low volatility and is designed for investors that desire equity exposure but are really risk averse. The Fund has a number of similarities to the Gargoyle Fund but, on average the net exposure of the Fund is approximately 25%.
Is the Structural Alpha Fund an absolute return strategy?
In my opinion it has elements of what is often called an absolute return strategy. The Fund clearly employs strategies that are not correlated with the market. Specifically, the short straddles and strangles will generate positive returns when the market is range bound and will lose money when the market moves outside of a range on either the upside or downside. Its market short position will generate positive returns when the market declines and will lose money when the market rises. It should be less risky and more conservative than our other two hedge Funds, but will likely not keep pace as well as the other two funds in sharply rising markets.
Conference Call Upcoming
We haven’t scheduled a call for March. We only schedule calls when we can offer you the opportunity to speak with someone really interesting and articulate. No one has reached that threshold this month, but we’ll keep looking on your behalf.
Conference call junkies might want to listen in on the next RiverNorth call, which focuses on the RiverNorth Managed Volatility Fund (RNBWX). Managed Volatility started life as RiverNorth Dynamic Buy-Write Fund. Long/short funds comes in three very distinct flavors, but are all lumped in the same performance category. For now, that works to the detriment of funds like Managed Volatility that rely on an options-based hedging strategy. The fund trails the long/short peer group since inception but has performed slightly better than the $8 billion Gateway Fund (GATEX). If you’re interested in the potential of an options-hedged portfolio, you’ll find the sign-up link on RiverNorth’s Events page. The webcast takes place March 13, 2014 at 3:15 Central.
Launch Alert: Conestoga SMid Cap (CCSMX)
On February 28, 2014, Conestoga Mid Cap (CCMGX) ceased to be. Its liquidation was occasioned by negative assessments of its “asset size, strategic importance, current expenses and historical performance.” It trailed its peers in all seven calendar quarters since inception, in both rising and falling periods. With under $2 million in assets, its disappearance is not surprising.
Two things are surprising, however. First, its poor relative performance is surprising given the success of its sibling, Conestoga Small Cap (CCASX). CCASX is a four-star fund that received a “Silver” designation from Morningstar’s analysts. Morningstar lauds the stable management team, top-tier long-term returns, low volatility (its less volatile than 90% of its peers) and disciplined focus on high quality firms. And, in general, small cap teams have had little problem in applying their discipline successfully to slightly-larger firms.
Second, Conestoga’s decision to launch (on January 21, 2014) a new fund – SMid Cap – in virtually the same space is surprising, given their ability simply to tweak the existing fund. It smacks of an attempt to bury a bad record.
My conclusion after speaking with Mark Clewett, one of the Managing Directors at Conestoga: yeah, pretty much. But honorably.
Mark made two arguments.
-
Conestoga fundamentally mis-fit its comparison group. Conestoga targeted stocks in the $2 – 10 billion market cap range. Both its Morningstar peers and its Russell Midcap Growth benchmark have substantial investments in stocks up to $20 billion. The substantial exposure to those large cap names in a mid-cap wrapper drove its peer’s performance.
The evidence is consistent with that explanation. It’s clear from the portfolio data that Conestoga was a much purer mid-cap play that either its benchmark or its peer group.
|
Portfolio
|
Conestoga Mid Cap
|
Russell Mid-cap Growth
|
Mid-cap Growth Peers
|
|
% large to mega cap
|
0
|
35
|
23
|
|
% mid cap
|
86
|
63
|
63
|
|
% small to micro cap
|
14
|
2
|
14
|
|
Average market cap
|
5.1M
|
10.4M
|
8.4M
|
By 2013, over 48% of the Russell index was stocks with market caps above $10 billion.
Mark was able to pull the attribution data for Conestoga’s mid-cap composite, which this fund reflects. The performance picture is mixed: the composite outperformed its benchmark in 2010 and 2011, then trailed in 2013 and 2013. The fund’s holdings in the $2-5 billion and $5–10 billion bands sometimes outperformed their peers and sometimes trailed badly.
-
Tweaking the old fund would not be in the shareholders’ best interest. The changes would be expensive and time-consuming. They would, at the same time, leave the new fund with the old fund’s record; that would inevitably cause some hesitance on the part of prospective investors, which meant it would be longer before the fund reached an economically viable size.
The hope is that with a new and more appropriate benchmark, a stable management team, sensible discipline and clean slate, the fund will achieve some of the success that Small Cap’s enjoyed. I’m hopeful but, for now, we’ll maintain a watchful, sympathetic silence.
Funds in Registration
New mutual funds must be registered with the Securities and Exchange Commission before they can be offered for sale to the public. The SEC has a 75-day window during which to call for revisions of a prospectus; fund companies sometimes use that same time to tweak a fund’s fee structure or operating details.
Funds in registration this month are eligible to launch in late April or early May 2014 and some of the prospectuses do highlight that date.
This month David Welsch battled through wicked viruses and wicked snowstorms to track down eight funds in registration, one of the lowest totals since we launched three years ago.
The clear standout in the group is Dodge & Cox Global Bond, which the Dodge & Cox folks ran as “a private fund” since the end of December 2012. It did really well in its one full year of operation – it gained 2.6% while its benchmark lost the same amount – and it comes with D&C’s signature low minimum, low expenses, low drama, team management.
Three other income funds are at least mildly interesting: Lazard Emerging Markets Income, Payden Strategic Income and Whitebox Unconstrained Income.
Manager Changes
On a related note, we also tracked down 50 sets of fund manager changes. The most intriguing of those include fallout from the pissing match at Pimco as Marc Seidner, an El-Erian ally, leaves to become GMO’s head of fixed-income operations.
Updates: The Observer here and there
I had a long conversation with a WSJ reporter which led to a short quotation in “Infrastructure funds are intriguing, but ….” The Wall Street Journal, Feb. 4 2014. My bottom line was “infrastructure funds appear to be an incoherent mish-mash, with no two funds even agreeing on what sectors are worth including much less what stocks. I don’t see any evidence of them adding value to a portfolio,” an observation prompted in part by T. Rowe Price’s decision to close their own Global Infrastructure fund. The writer, Lisa Ward, delicately quotes me as saying “you probably already own these same stocks in your other funds.”
I was quoted as endorsing Artisan Global Small Cap (ARTWX) in Six promising new funds (though the subtitle might have been: “five of which I wouldn’t go near”), Kiplinger’s, Feb. 12 2014. ARTWX draws on one of the most storied international management teams around, led by Mark Yockey. The other funds profiled include three mutual funds and two ETFs. The funds are Miller Income Opportunity (I’ve written elsewhere that “The whole enterprise leaves me feeling a little queasy since it looks either like Miller’s late-career attempt to prove that he’s not a dinosaur or Legg’s post-divorce sop to him”), Fidelity Event-Driven (FARNX: no record that Fido can actually execute with new funds anymore, much less with niche funds and untested managers), and Vanguard Global Minimum Volatility (VMVFX: meh – they work backward from a target risk level to see what returns they can generate). The ETFs are two of the “smart beta” sorts of products, iShares MSCI USA Quality Factor (QUAL) and Schwab Fundamental U.S. Broad Market (FNDB).
Finally, there was a very short piece entitled “Actively managed funds with low volatility,” in Bottom Line, Feb. 15 2014. The publication is not online, at least not in an accessible form. The editors were looking for funds with fairly well-established track records that have a tradition of low volatility. I offered up Cook & Bynum Fund (COBYX, I’ve linked to our 2013 profile of them), FPA Crescent (FPACX, in which I’m invested) and Osterweis Fund (OSTWX).
Updates: Forbes discovers Beck, Mack & Oliver Partners (BMPEX)
Forbes rank a nice article on BMPEX, “Swinging at Strikes,” in their February 10, 2014 issue. Despite the lunacy of describing a $175 million fund as “puny” and “tiny,” the author turns up some fun facts to know and tell (the manager, Zac Wydra, was a premed student until he discovered that the sight of blood made him queasy) and gets the fund’s basic discipline right. Zac offers some fairly lively commentary in his Q4 shareholder letter, including a nice swipe at British haughtiness and a reflection on the fact that the S&P 500 is at an all-time high at the same time that the number of S&P 500 firms issuing negative guidance is near an all-time high.
Briefly Noted . . .
BlackRock has added the BlackRock Emerging Markets Long/Short Equity Fund (BLSAX) and the BlackRock Global Long/Short Equity Fund (BDMAX) as part of the constituent fund lineup in its Aggressive Growth, Conservative , Growth and Moderate Prepared Portfolios, and its Lifepath Active-Date series. Global has actually made some money for its investors, which EM has pretty much flatlined while the emerging markets have risen over its lifetime. No word on a target allocation for either.
Effective May 1, Chou Income (CHOIX) will add preferred stocks to the list of their principal investments: “fixed-income securities, financial instruments that provide exposure to fixed-income securities, and preferred stocks.” Morningstar categorizes CHOIX as a World Bond fund despite the fact that bonds are less than 20% of its current portfolio and non-U.S. bonds are less than 3% of it.
Rydex executed reverse share splits on 13 of its funds in February. Investors received one new share for between three and seven old shares, depending on the fund.
Direxion will follow the same path on March 14, 2014 with five of their funds. They’re executing reverse splits on three bear funds and splits on two bulls. They are:
|
Fund Name
|
Reverse Split
Ratio
|
|
Direxion Monthly S&P 500® Bear 2X Fund
|
1 for 4
|
|
Direxion Monthly 7-10 Year Treasury Bear 2X Fund
|
1 for 7
|
|
Direxion Monthly Small Cap Bear 2X Fund
|
1 for 13
|
|
Fund Name
|
Forward Split
Ratio
|
|
Direxion Monthly Small Cap Bull 2X Fund
|
2 for 1
|
|
Direxion Monthly NASDAQ-100® Bull 2X Fund
|
5 for 1
|
SMALL WINS FOR INVESTORS
Auxier Focus (AUXIX) is reducing the minimum initial investment for their Institutional shares from $250,000 to $100,000. Investor and “A” shares remain at $5,000. The institutional shares cost 25 basis points less than the others.
TFS Market Neutral Fund (TFSMX) reopened to new investors on March 1, 2014.
At the end of January, Whitebox eliminated its Advisor share class and dropped the sales load on Whitebox Tactical. Their explanation: “The elimination of the Advisor share class was basically to streamline share classes … eliminating the front load was in the best interest of our clients.” The first makes sense; the second is a bit disingenuous. I’m doubtful that Whitebox imposed a sales load because it was “in the best interest of our clients” and I likewise doubt that’s the reason for its elimination.
CLOSINGS (and related inconveniences)
Artisan Global Value (ARTGX) closed on Valentine’s Day.
Grandeur Peak will soft close the Emerging Markets Opportunities (GPEOX) and hard close the Global Opportunities (GPGOX) and International Opportunities (GPIOX) strategies on March 5, 2014.
Effective March 5, 2014, Invesco Select Companies Fund (ATIAX) will close to all investors.
Vanguard Admiral Treasury Money Market Fund (VUSSX) is really, really closed. It will “no longer accept additional investments from any financial advisor, intermediary, or institutional accounts, including those of defined contribution plans. Furthermore, the Fund is no longer available as an investment option for defined contribution plans. The Fund is closed to new accounts and will remain closed until further notice.” So there.
OLD WINE, NEW BOTTLES
Effective as of March 21, 2014, Brown Advisory Emerging Markets Fund (BIAQX) is being changed to the Brown Advisory – Somerset Emerging Markets Fund. The investment objective and the investment strategies of the Fund are not being changed in connection with the name change for the Fund and the current portfolio managers will continue. At the same time, Brown Advisory Strategic European Equity Fund (BIAHX) becomes Brown Advisory -WMC Strategic European Equity Fund.
Burnham Financial Industries Fund has been renamed Burnham Financial Long/Short Fund (BURFX). It’s a tiny fund (with a sales load and high expenses) that’s been around for a decade. It’s hard to know what to make of it since “long/short financial” is a pretty small niche with few other players.
Caritas All-Cap Growth Fund has become Goodwood SMID Cap Discovery Fund (GAMAX), a name that my 13-year-old keeps snickering at. It’s been a pretty mediocre fund which gained new managers in October.
Compass EMP Commodity Long/Short Strategies Fund (CCNAX) is slated to become Compass EMP Commodity Strategies Enhanced Volatility Weighted Fund in May. Its objective will change to “match the performance of the CEMP Commodity Long/Cash Volatility Weighted Index.” It’s not easily searchable by name at Morningstar because they’ve changed the name in their index but not on the fund’s profile.
Eaton Vance Institutional Emerging Markets Local Debt Fund (EELDX) has been renamed Eaton Vance Institutional Emerging Markets Debt Fund and is now a bit less local.
Frost Diversified Strategies and Strategic Balanced are hitting the “reset” button in a major way. On March 31, 2014, they change name, objective and strategy. Frost Diversified Strategies (FDSFX) becomes Frost Conservative Allocation while Strategic Balanced (FASTX) becomes Moderate Allocation. Both become funds-of-funds and discover a newfound delight in “total return consistent with their allocation strategy.” Diversified currently is a sort of long/short, ETFs, funds and stocks, options mess … $4 million in assets, high expense, high turnover, indifferent returns, limited protection. Strategic Balanced, with a relatively high downside capture, is a bit bigger and a bit calmer but ….
Effective on or about May 30, 2014, Hartford Balanced Allocation Fund (HBAAX) will be changed to Hartford Moderate Allocation Fund.
At the same time, Hartford Global Research Fund (HLEAX) becomes Hartford Global Equity Income Fund, with a so far unexplained “change to the Fund’s investment goal.”
Effective March 31, 2014, MFS High Yield Opportunities Fund (MHOAX) will change its name to MFS Global High Yield Fund.
In mid-February, Northern Enhanced Large Cap Fund (NOLCX) became Northern Large Cap Core Fund though, at last check, Morningstar hadn’t noticed. Nice little fund, by the way.
Speaking of not noticing, the folks at Whitebox have accused of us ignoring “one of the most important changes we made, which is Whitebox Long Short Equity Fund is now the Whitebox Market Neutral Equity Fund.” We look alternately chastened by our negligence and excited to report such consequential news.
OFF TO THE DUSTBIN OF HISTORY
BCM Decathlon Conservative Portfolio, BCM Decathlon Moderate Portfolio and BCM Decathlon Aggressive Portfolio have decided that they can best serve their shareholders by liquidating. The event is scheduled for April 14, 2014.
BlackRock International Bond Portfolio (BIIAX) has closed and will liquidate on March 14, 2014. A good move given the fund’s dismal record, though you’d imagine that a firm with BlackRock’s footprint would want a fund of this name.
Pending shareholder approval, City National Rochdale Diversified Equity Fund (AHDEX) will merge into City National Rochdale U.S. Core Equity Fund (CNRVX) of the Trust. I rather like the honesty of their explanation to shareholders:
This reorganization is being proposed, among other reasons, to reduce the annual operating expenses borne by shareholders of the Diversified Fund. CNR does not expect significant future in-flows to the Diversified Fund and anticipates the assets of the Diversified Fund may continue to decrease in the future. The Core Fund has significantly more assets [and] … a significantly lower annual expense ratio.
Goldman Sachs Income Strategies Portfolio merged “with and into” the Goldman Sachs Satellite Strategies Portfolio (GXSAX) and Goldman Sachs China Equity Fund with and into the Goldman Sachs Asia Equity Fund (GSAGX) in mid-February.
Huntington Rotating Markets Fund (HRIAX) has closed and will liquidate by March 28, 2014.
Shareholders of Ivy Asset Strategy New Opportunities Fund (INOAX) have been urged to approve the merger of their fund into Ivy Emerging Markets Equity Fund (IPOAX). The disappearing fund is badly awful but the merger is curious because INOAX is not primarily an emerging markets fund; its current portfolio is split between developed and developing.
The Board of Trustees of the JPMorgan Ex-G4 Currency Strategies Fund (EXGAX) has approved the liquidation and dissolution of the Fund on or about March 10, 2014. The “strategies” in question appear to involve thrashing around without appreciable gain.
After an entire year of operation (!), the KKR Board of Trustees of the Fund approved a Plan of Liquidation with respect to KKR Alternative Corporate Opportunities Fund (XKCPX) and KKR Alternative High Yield Fund (KHYZX). Accordingly, the Fund will be liquidated in accordance with the Plan on or about March 31, 2014 or as soon as practicable thereafter.
Loomis Sayles Mid Cap Growth Fund (LAGRX) will be liquidated on March 14th, a surprisingly fast execution given that the Board approved the action just the month before.
On February 13, 2014, the shareholders of the Quaker Small Cap Growth Tactical Allocation Fund (QGASX) approved the liquidation and dissolution of the Fund.
In Closing . . .
We asked you folks, in January, what made the Observer worthwhile. That is, what did we offer that brought you back each month? We poured your answers into a Wordle in hopes of capturing the spirit of the 300 or so responses.

Three themes recurred: (1) the Observer is independent. We’re not trying to sell you anything. We’re not trying to please advertisers. We’re not desperate to write inflated drivel in order to maximize clicks. We don’t have a hidden agenda.
(2) We talk about things that other folks do not. There’s a lot of appreciation for our willingness to ferret out smaller, emerging managers and to bring them to you in a variety of formats. There’s also some appreciate of our willingness to step back from the fray and try to talk about important long-term issues rather than sexy short-term ones.
(3) We’re funny. Or weird. Perhaps snarky, opinionated, cranky and, on a good day, curmudgeonly.
And that helps us a lot. As we plan for the future of the Observer, we’re thinking through two big questions: where should we be going and how can we get there? We’ll write a bit next time about your answer to the final question: what should we be doing that we aren’t (yet)?
We’ve made a couple changes under the hood to make the Observer stronger and more reliable. We’ve completed our migration to a new virtual private server at Green Geeks, which should help with reliability and allow us to handle a lot more traffic. (We hit records again in January and February.) We also upgraded the software that runs our discussion board. It gives the board better security and a fresher look. If you’ve got a bookmarked link to the discussion board, we need you to reset your link to http://www.mutualfundobserver.com/discuss/discussions. If you use your old bookmark you’ll just end up on a redirect page.
In April we celebrate our third anniversary. Old, for a website nowadays, and so we thought we’d solicit the insights of some of the Grand Old Men of the industry: well-seasoned, sometimes storied managers who struck out on their own after long careers in large firms. We’re trying hard to wheedle our colleague Ed, who left Oakmark full of years and honors, to lead the effort. While he’s at that, we’re planning to look again at the emerging markets and the almost laughable frenzy of commentary on “the bloodbath in the emerging markets.” (Uhh … Vanguard’s Emerging Market Index has dropped 8% in a year. That’s not a bloodbath. It’s not even a correction. It’s a damned annoyance. And, too, talking about “the emerging markets” makes about as much analytic sense as talking about “the white people.” It’s not one big undifferentiated mass). We’ve been looking at fund flow data and Morningstar’s “buy the unloved” strategy. Mr. Studzinski has become curious, a bit, about Martin Focused Value (MFVRX) and the arguments that have led them to a 90% cash stake. We’ll look into it.
Please do bookmark our Amazon link. Every bit helps!
As ever,


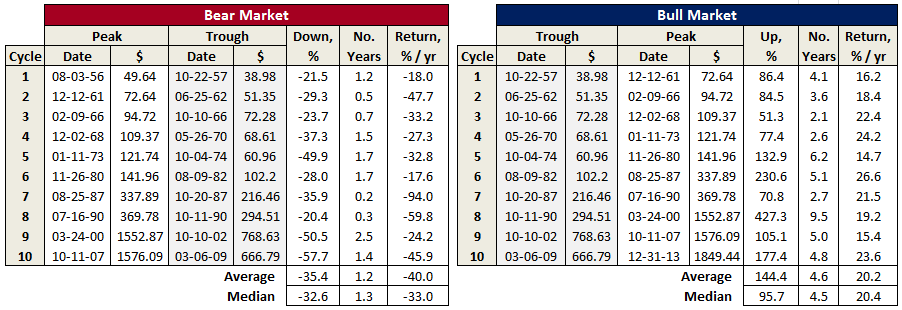
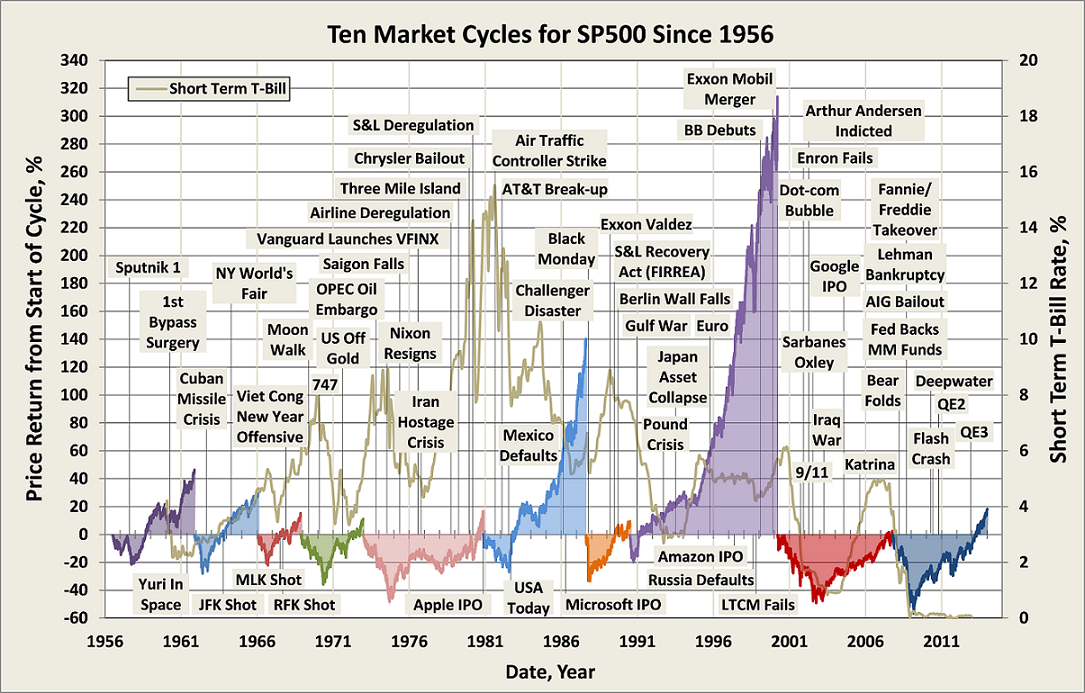
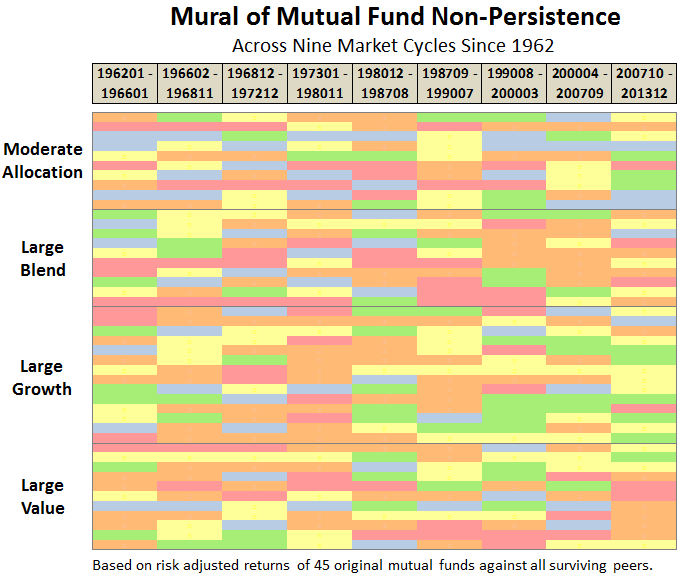
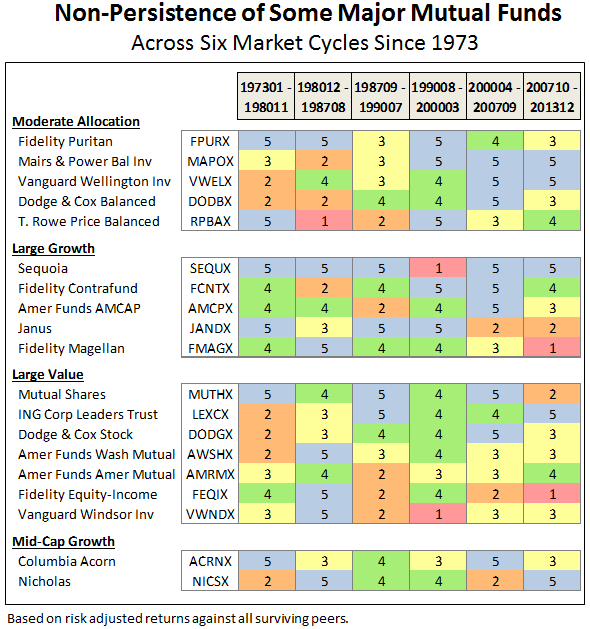
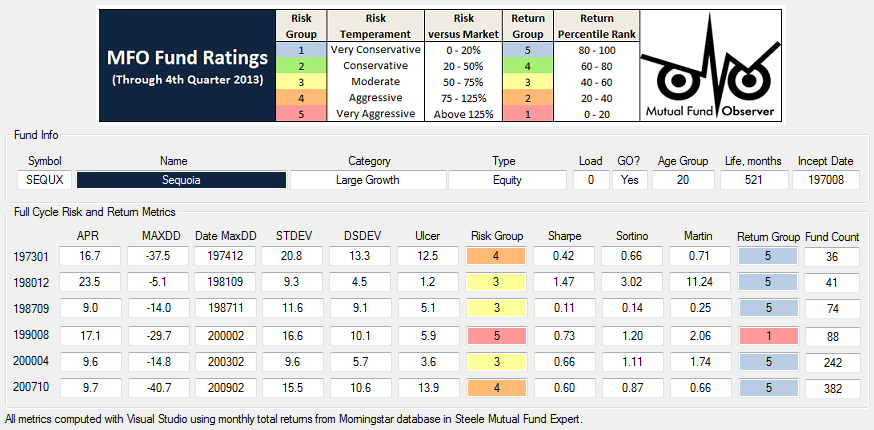
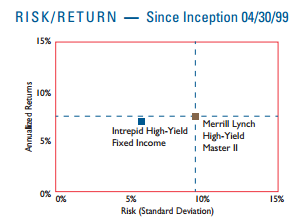
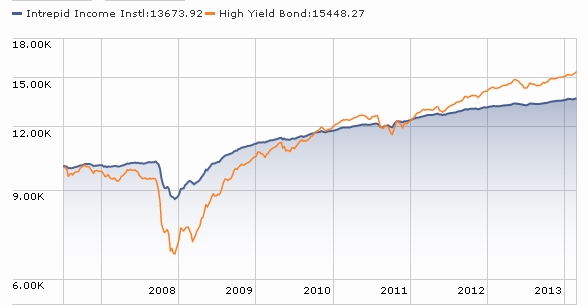

 One of the joys of having entered the investment business in the 1980’s is that you came in at a time when the profession was still populated by some really nice and thoughtful people, well-read and curious about the world around them. They were and are generally willing to share their thoughts and ideas without hesitation. They were the kind of people that you hoped you could keep as friends for life. One such person is my friend, Bruce, who had a thirty-year career on the “buy side” as both an analyst and a director of research at several well-known money management firms. He retired in 2008 and divides his time between homes in western Connecticut and Costa Rica.
 From Bruce’s perspective, too much money is chasing too few good ideas. This has resulted in what we call “style drift”. Firms that had made their mark as small cap or mid cap investors didn’t want to kill the goose laying the golden eggs by shutting off new money, so they evolved to become large cap investors. But ultimately that is self-defeating, for as the assets come in, you either have to shut down the flows or change your style by adding more and larger positions, which ultimately leads to under-performance.
 Roy Weitz grouped funds into only five equity and six specialty “benchmark categories” when he established the legacy