Originally published in April 1, 2013 Commentary
To describe Richard P. Cook and J. Dowe Bynum (C&B) as value investors would be accurate, but certainly not adequate. Their website is rich with references to value investment principles championed by Benjamin Graham, John Burr Williams, Charlie Munger, and Warren Buffet. “The value investing inoculation took immediately,” C&B explain, after reading Mr. Buffett’s biography in high school. They have been investing together literally since childhood and at age 23 they actually tried to start their own mutual fund. That did not happen, but years later in 2001 they established Cook & Bynum Capital Management and in mid-2009 they launched their namesake The Cook & Bynum Fund COBYX, which turned out to be perfect timing.
Like many experienced investors on MFO, C&B do not view volatility as risk, but as opportunity. That said, the lack of volatility in 43 months of COBYX performance through February 2013 is very alluring and likely helped propel the fund’s popularity, now with $102M AUM. Its consistent growth rate resembles more a steady bond fund, say PONDX, than an equity fund. The fund received a 5-Star Morningstar Rating for the 3-year period ending mid-2012.
Other than strictly adhering to the three most important words of value investing (“Margin of Safety”) when assessing stock price against inherent value, C&B do not impose explicit drawdown control or practice dynamic allocation, like risk-parity AQRNX or long-short ARLSX. They try instead to buy wonderful businesses at discounted prices. To quote Mr. Buffett: “If you’re right about what, you don’t have to worry about when very much.”
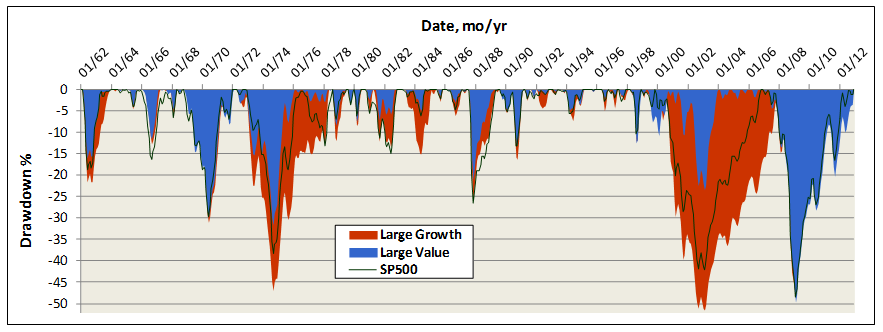
Fortunately, history is on their side. The chart below depicts drawdowns for the last 50 years, comparing value versus growth large cap fund averages. Value funds indeed generally suffer smaller and shorter drawdowns. But not always. The term “value trap” became ubiquitous during the financial collapse of 2008, when many highly respected, long established, and top performing value funds (prime example DODGX) were simply hammered. And, when the forest is burning, all the trees go with it.

While Mr. Cook and Mr. Bynum must have managed their private accounts through such turbulent times, COBYX has enjoyed bull market conditions since its inception. (Perhaps a reluctant bull, but nonetheless…) Still, when the market dipped 7% in May 2012, COBYX did not drop at all. In September 2011, SP500 dropped 16%, COBYX dipped only 5%. Its biggest drawdown was June 2010 at 9% versus 13% for the market. The tame behavior is due partly to C&B’s propensity to hold cash. Not as a strategy, they explain, but as residual to value opportunities available. They unloaded Kraft, for example, shortly after the company split its international and domestic businesses. Here is an excerpt from COBYX’s 2012 annual report explaining their move:
Despite neither of the companies’ fundamental business prospects changing one iota, the market reacted to the news by trading both of the stocks higher. We used this opportunity to liquidate our stake in both companies. It is popular, even within our value discipline, for investors to advocate various financial engineering strategies in an attempt to drive near-term stock price appreciation rather than to focus on a company’s long-term cash flows – where real value resides.
C&B take pride in not being “closet indexers” to their benchmarks SP500 and MSCI All Country World Index (ACWI). So far they have tended to hold consumer defensive stocks, like Wal-Mart, Procter & Gamble, and Coca-Cola. Although more recently, they own Microsoft, which accounts for 16% of the portfolio. COBYX’s lifetime correlation to SP500 is 66% and its beta is only 0.47.
The strategy has delivered handsomely. Just how good is it? Below compares COBYX with several other Morningstar 5 star funds, including Charles Akre’s AKREX, Steven Romick’s FPA Crescent Fund, Donald Yacktman’s YAFFX, Sequoia Fund (perhaps the greatest fund ever), plus landmark Berkshire Hathaway.

Since COBYX inception, it has produced the highest risk adjusted returns, based on both Sharpe and Sortino Ratios, with the lowest standard and downside volatilities. It has delivered more than 90% of SP500 total return with less than 60% of its volatility. Interestingly, all of these top-performing mutual funds have low beta against SP500, like COBYX, but again for the record, C&B reject metrics like beta: “Risk is not volatility.”
COBYX is also highly concentrated. As of December 2012, it held only seven equities. C&B’s strategy is to focus only on companies whose businesses they can understand – depth of insight is the edge they seek. They employ Kelly Criterion to size positions in their portfolio, which represents an implicit form of risk management. John Kelly developed it in 1950s at AT&T’s Bell Labs to optimize transmission rate through long distance phone lines. Edward Thorpe then famously employed the technique to “Beat the Dealer” and later to help optimize his hedge fund investments at Princeton/Newport Partners. In C&B’s implementation, Kelly is edge over odds, or expected returns over range of outcomes. What is currently their biggest position? Cash at 34%.
Bottom-line: Hard not to love this young fund, performance to date, and philosophy employed by its managers. High ER, recently dropped from 1.88 to 1.49, has been its one detractor. Hopefully, ER reduction continues with AUM growth, since world-stock fund median is already a hefty 1.20 drag.
(Thank you, sir! David)
